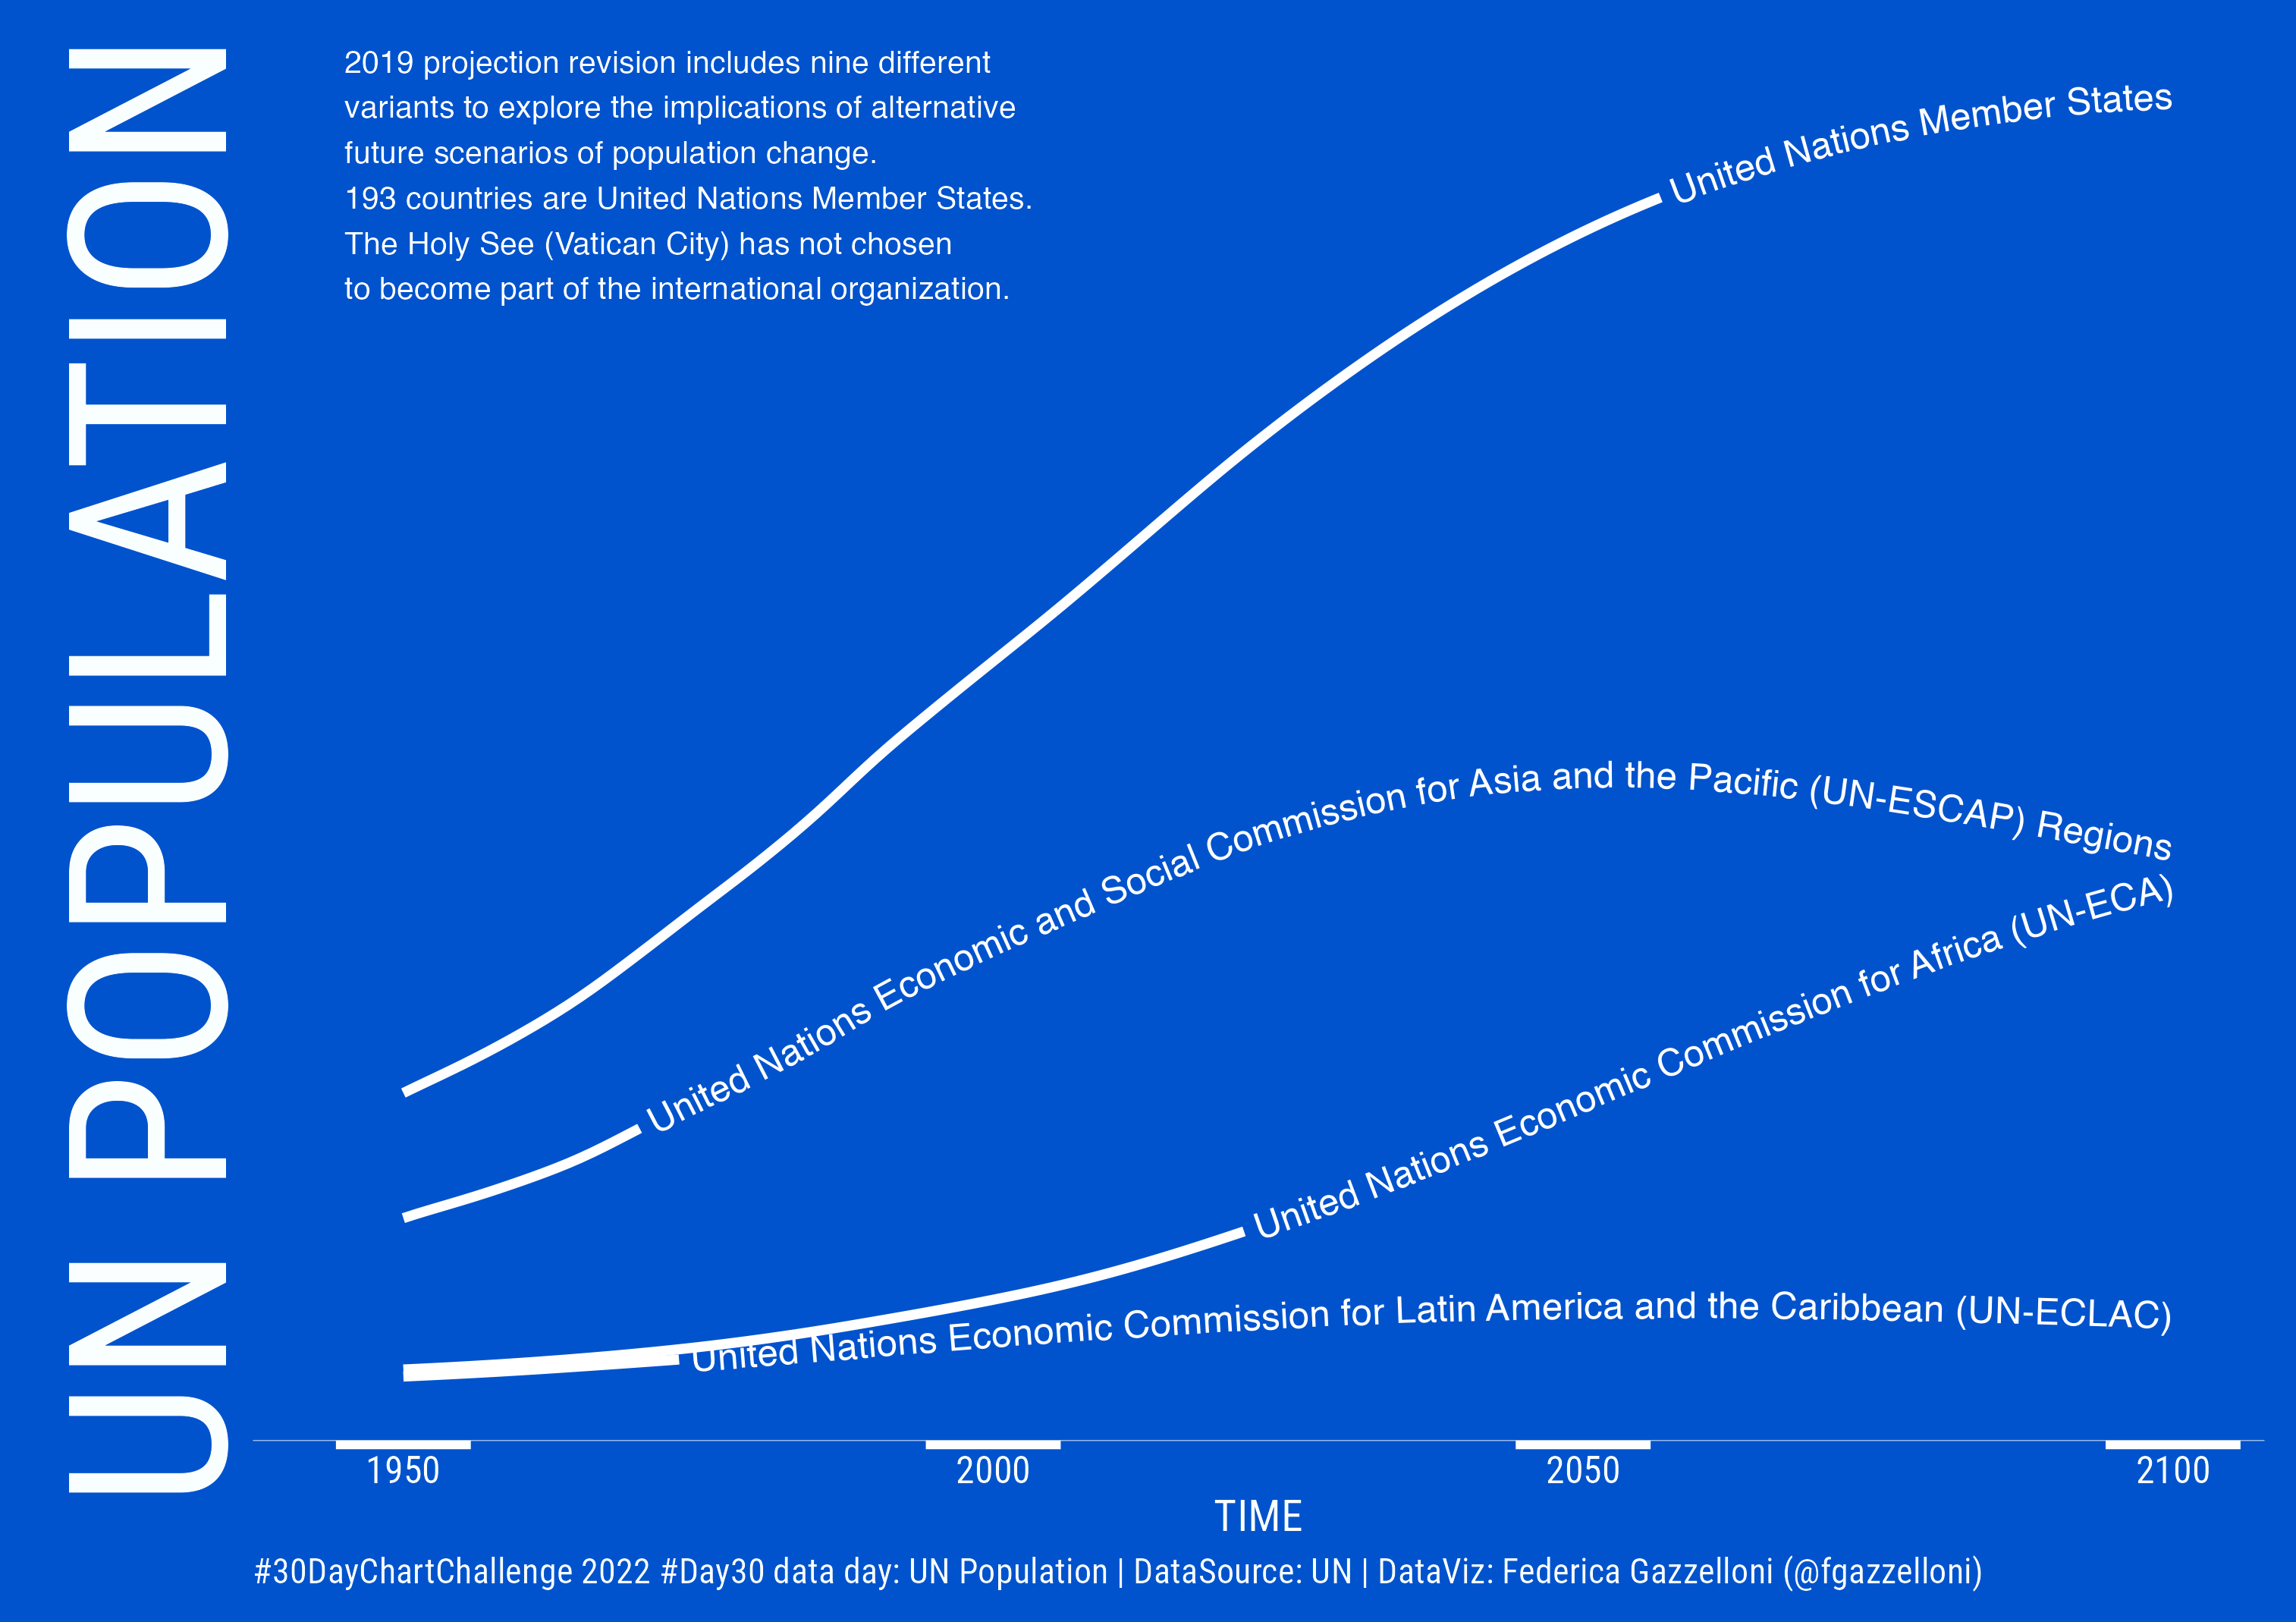
A time-series visualization of United Nations population estimates and projections by region from 1950 onward.
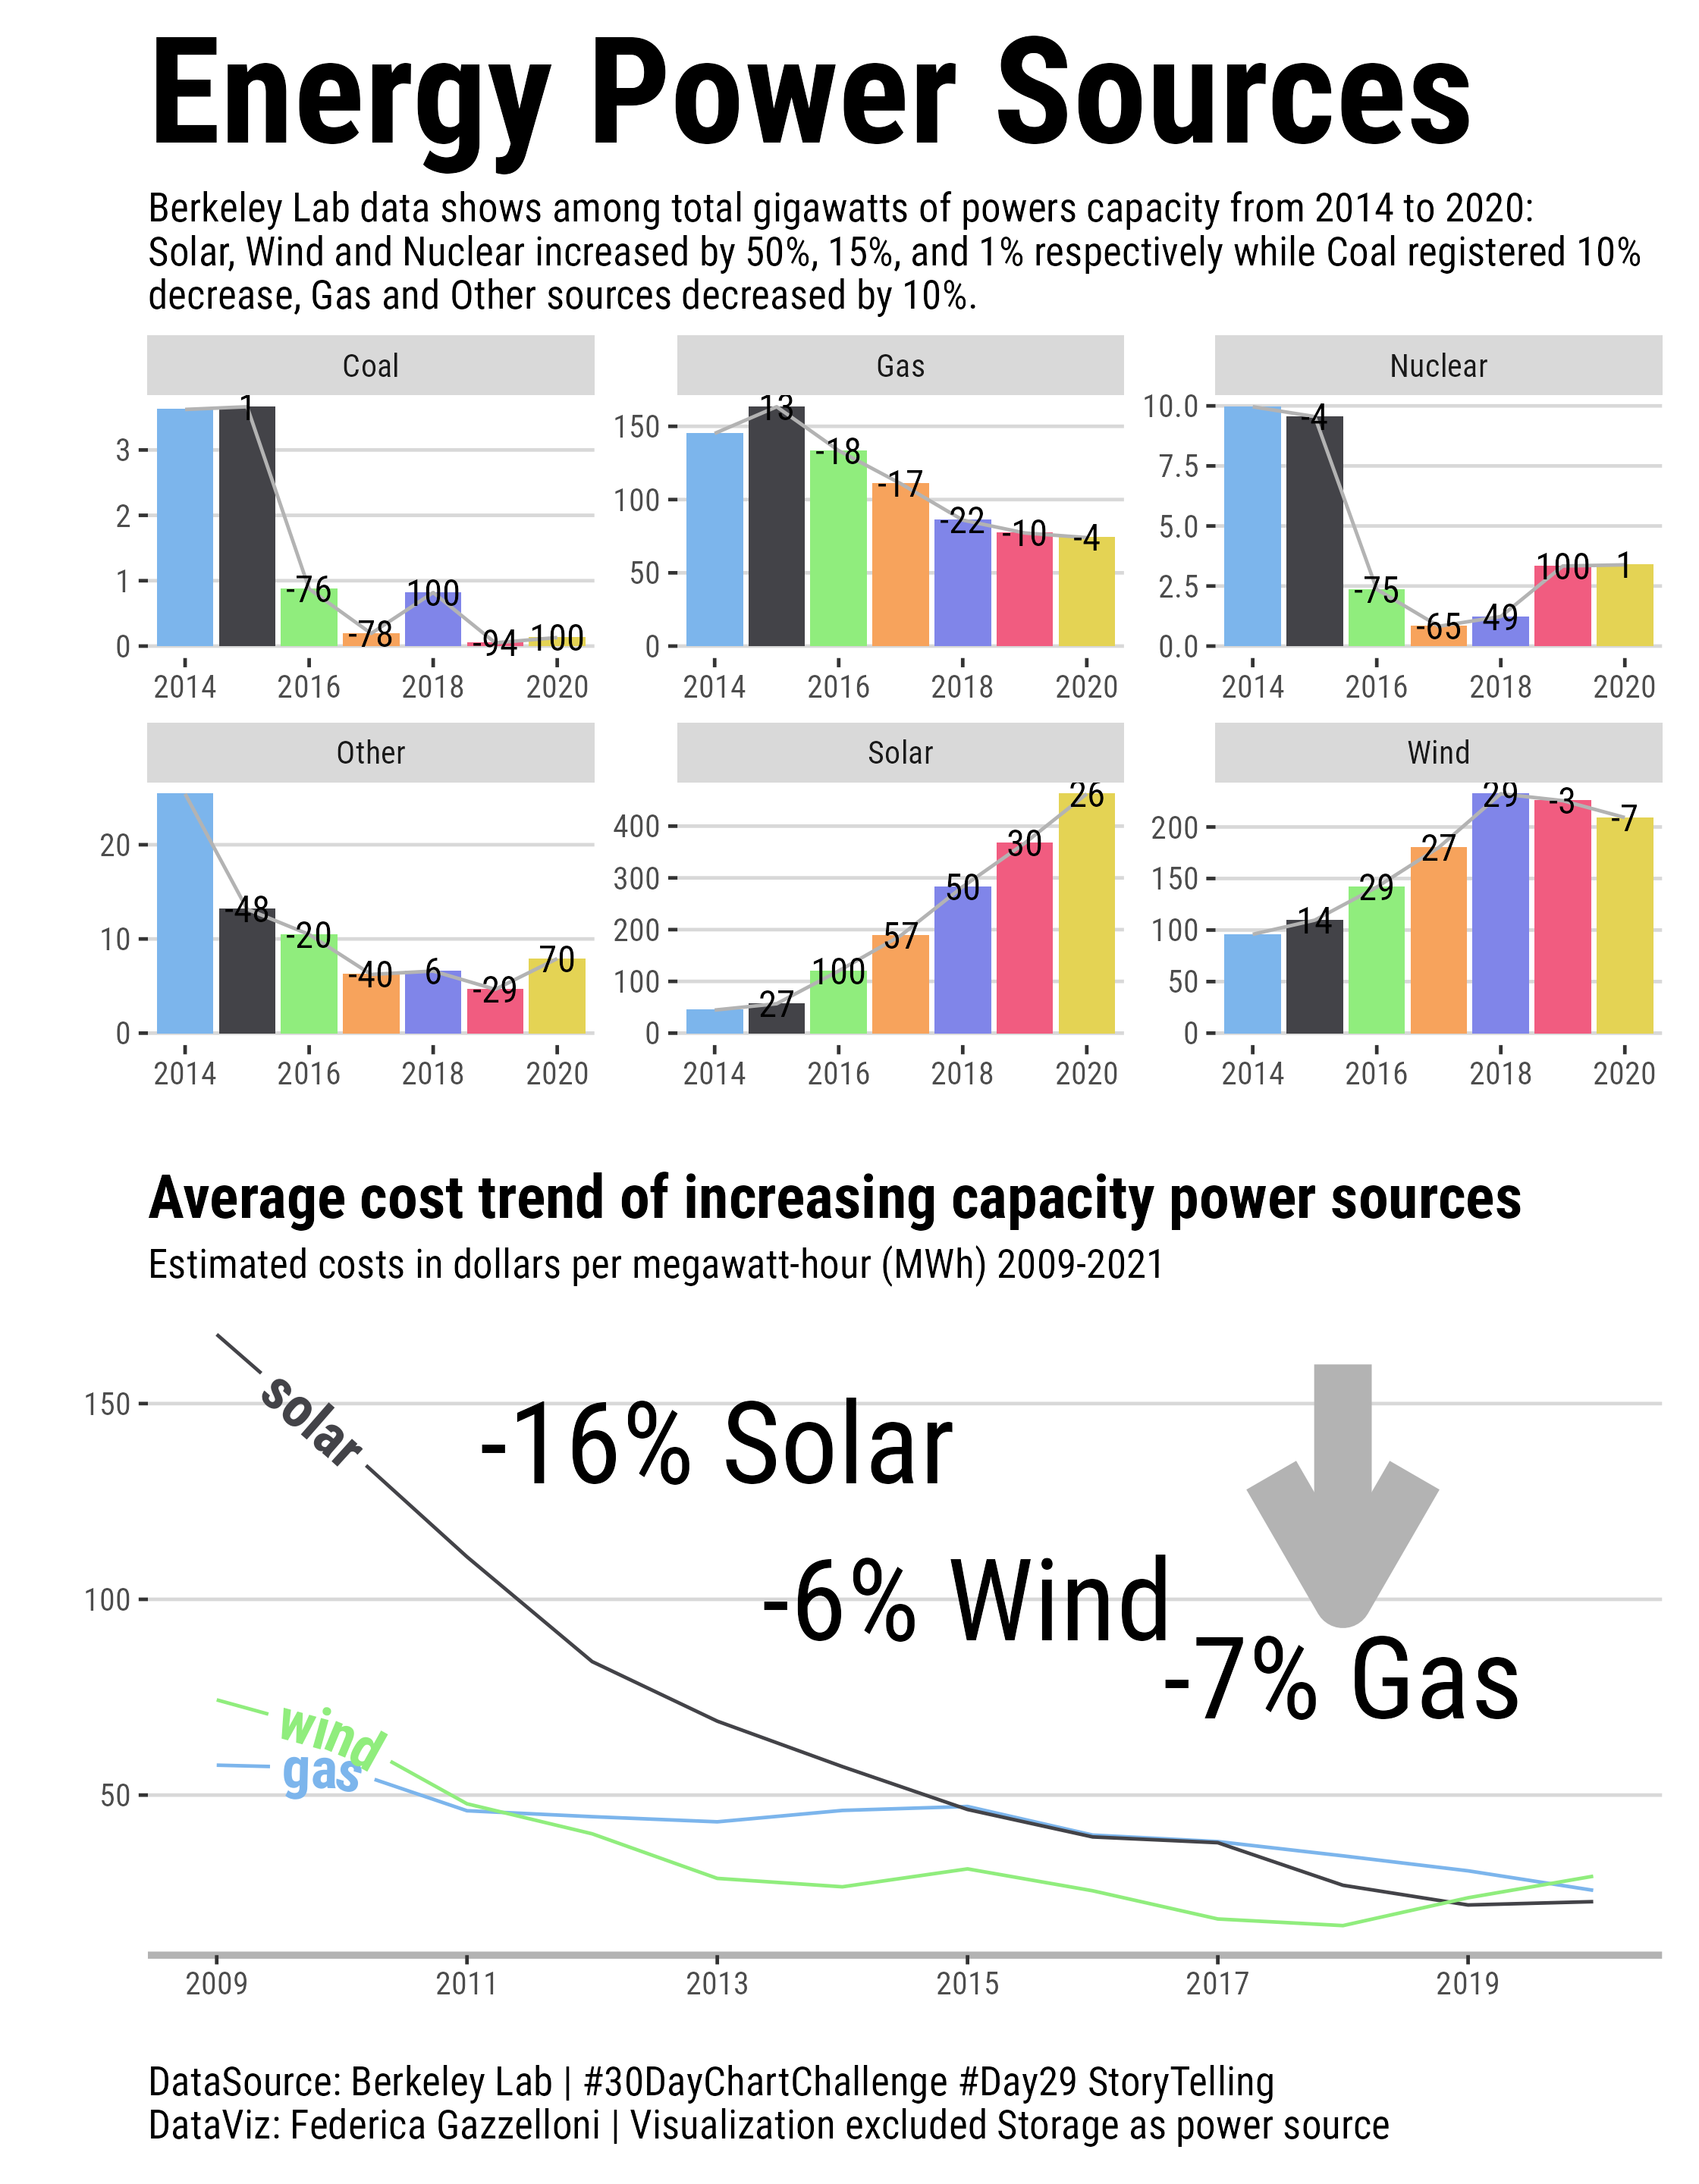
A paired view of energy capacity and cost trends from 2014 to 2021, comparing growth in renewable and other power sources.
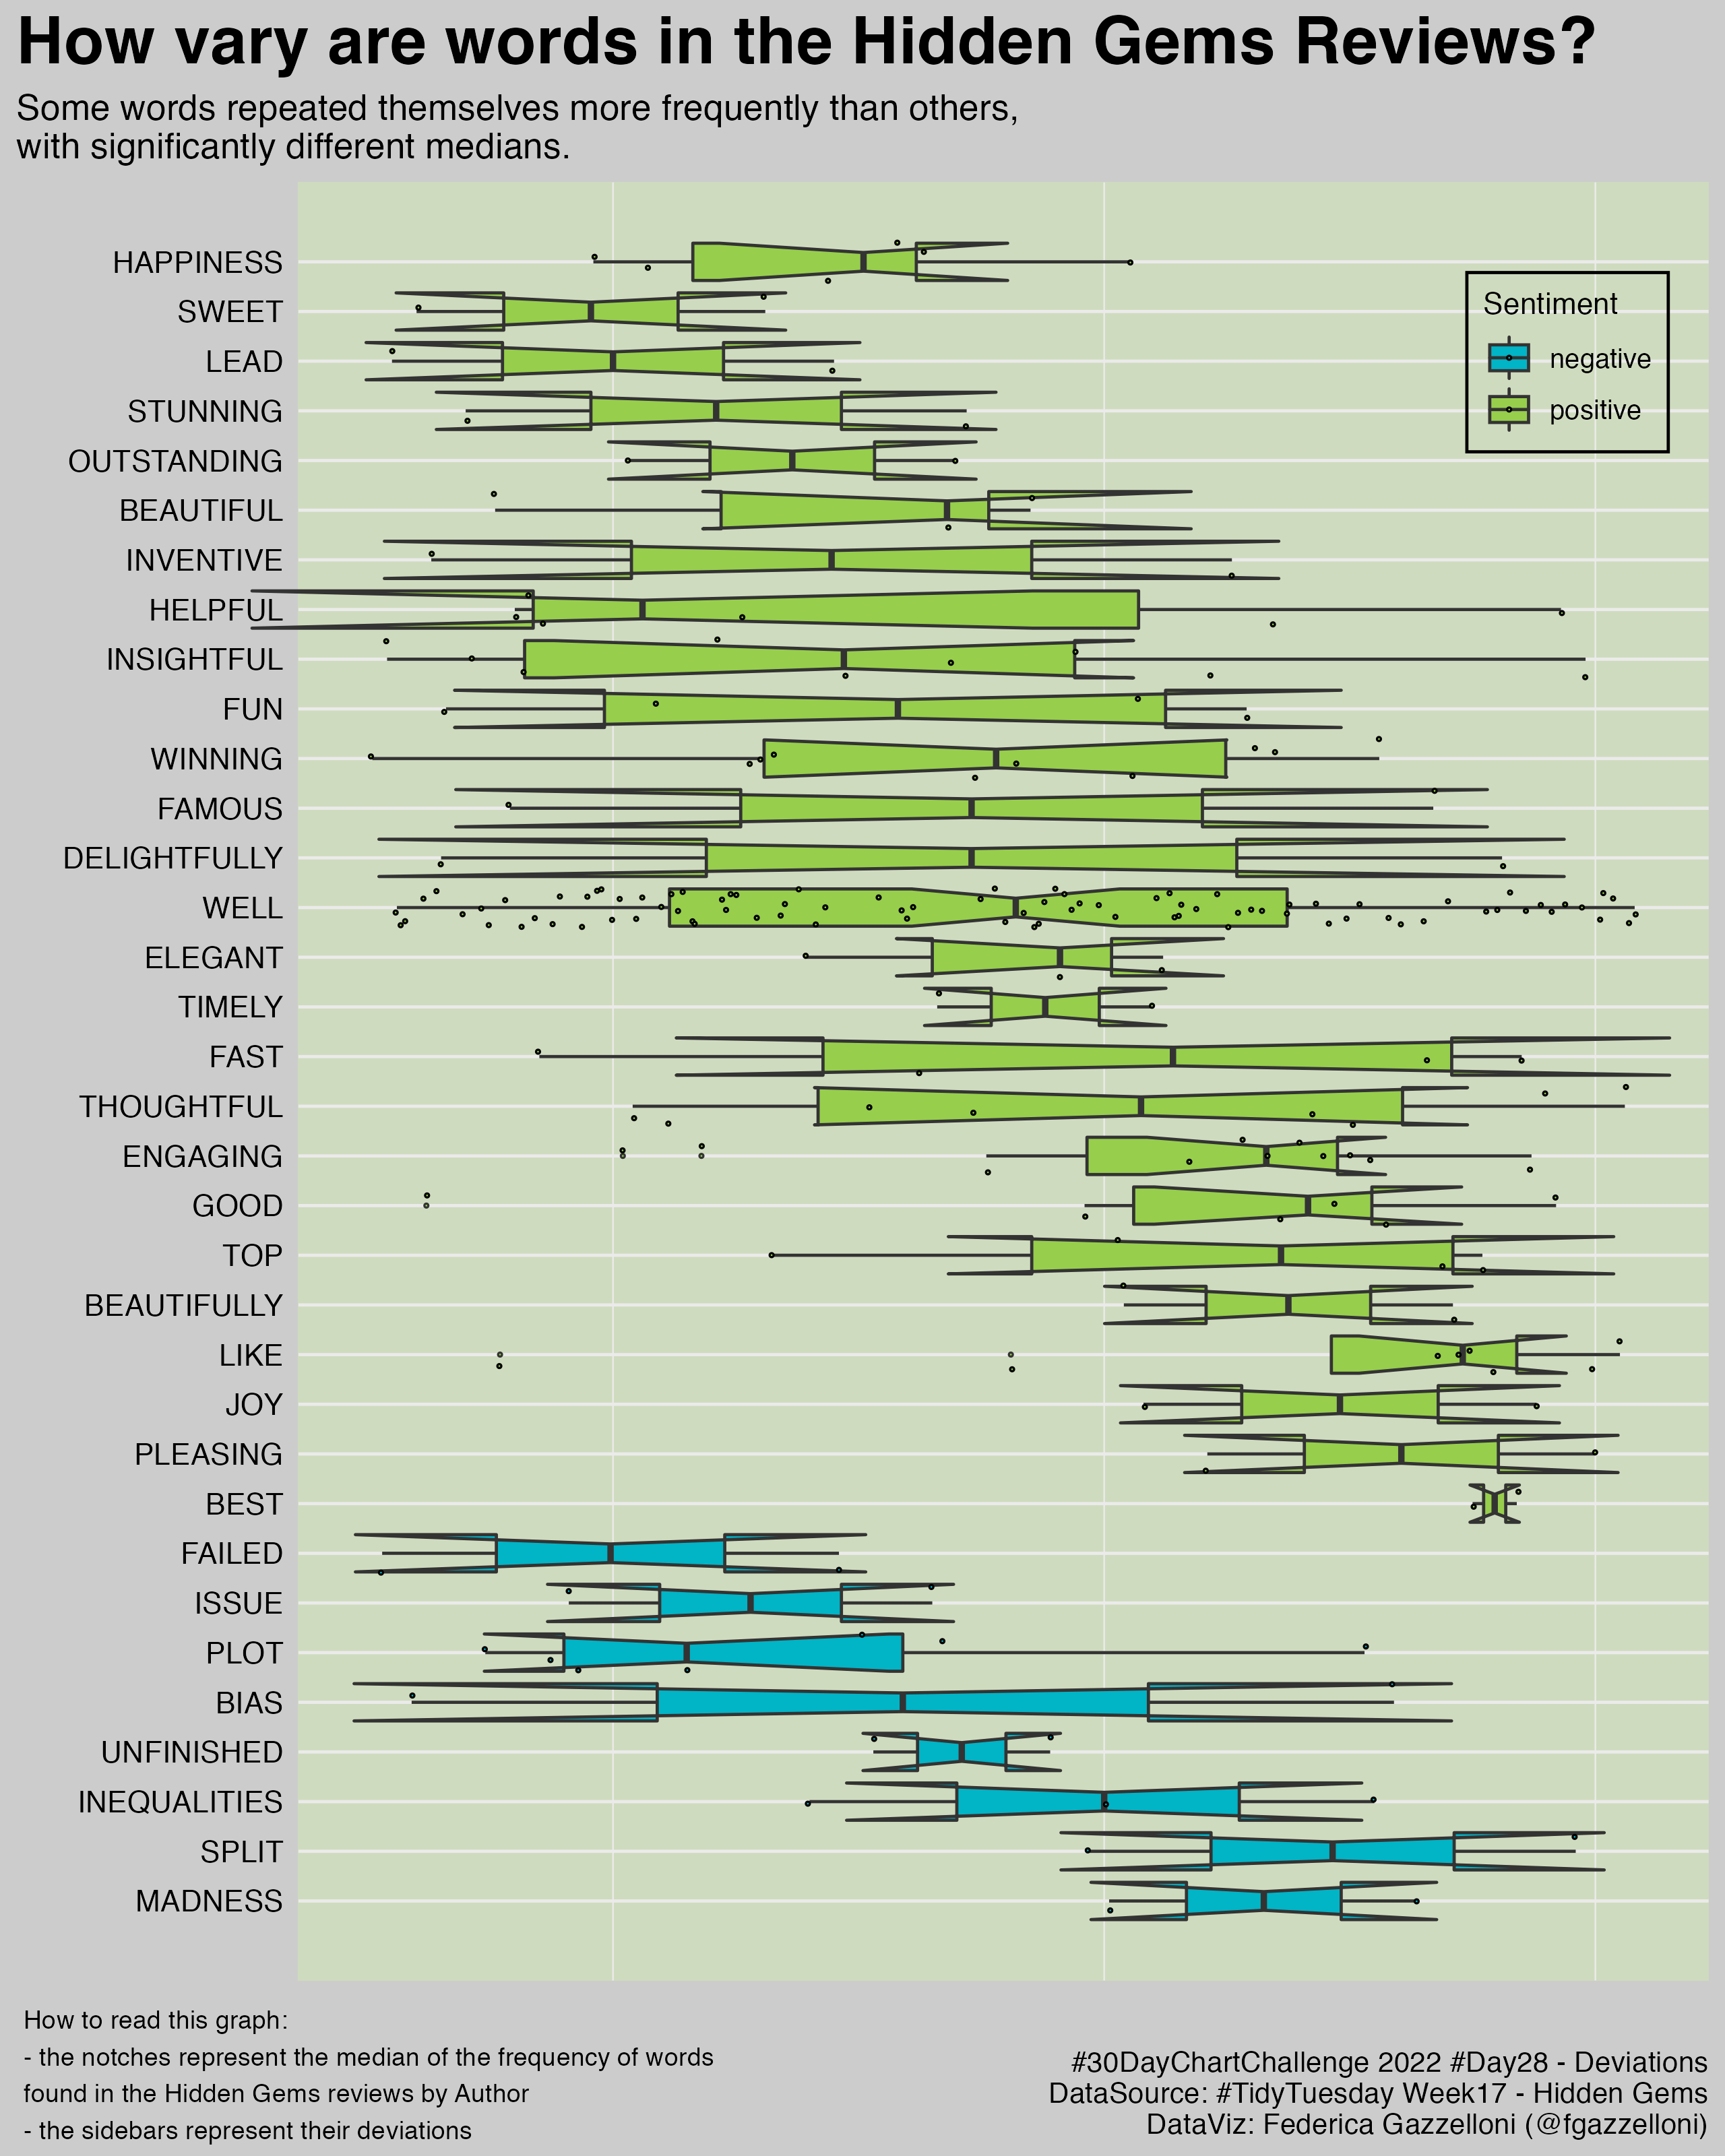
A boxplot comparison of word frequency in Kaggle Hidden Gems reviews, using notches to compare medians.
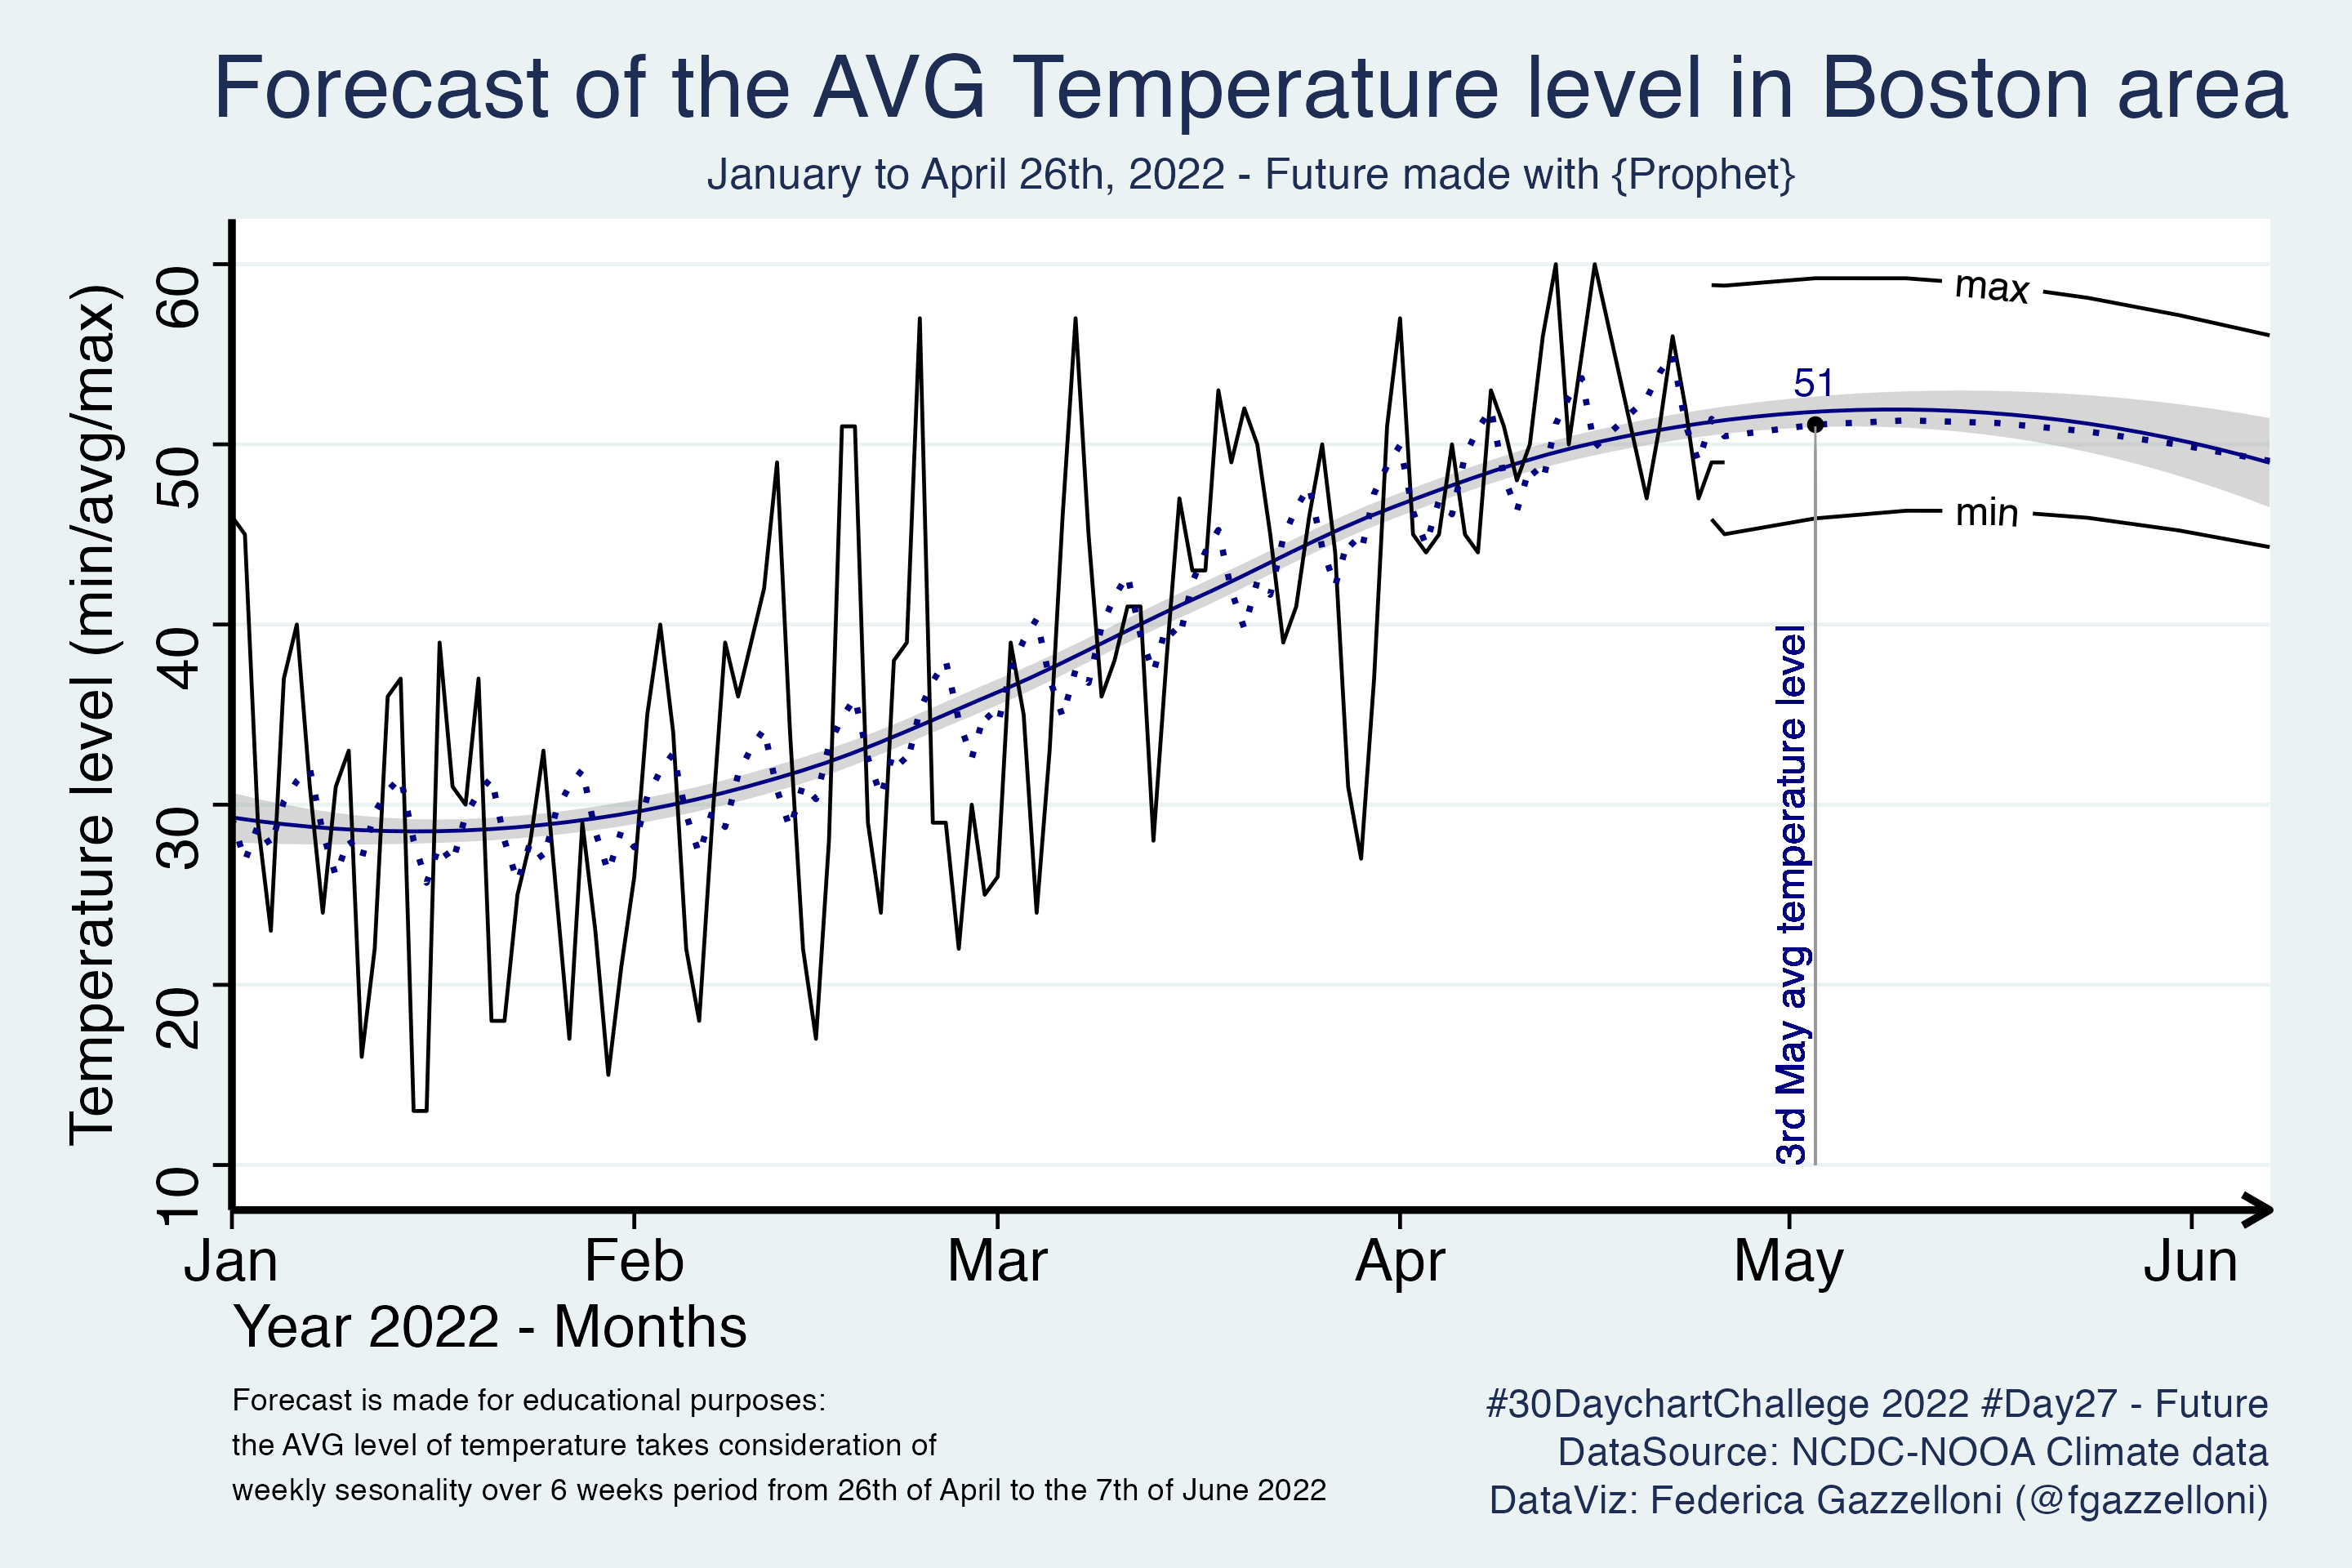
A time-series forecast of temperatures in the Boston area from January through April 2022 using Prophet.
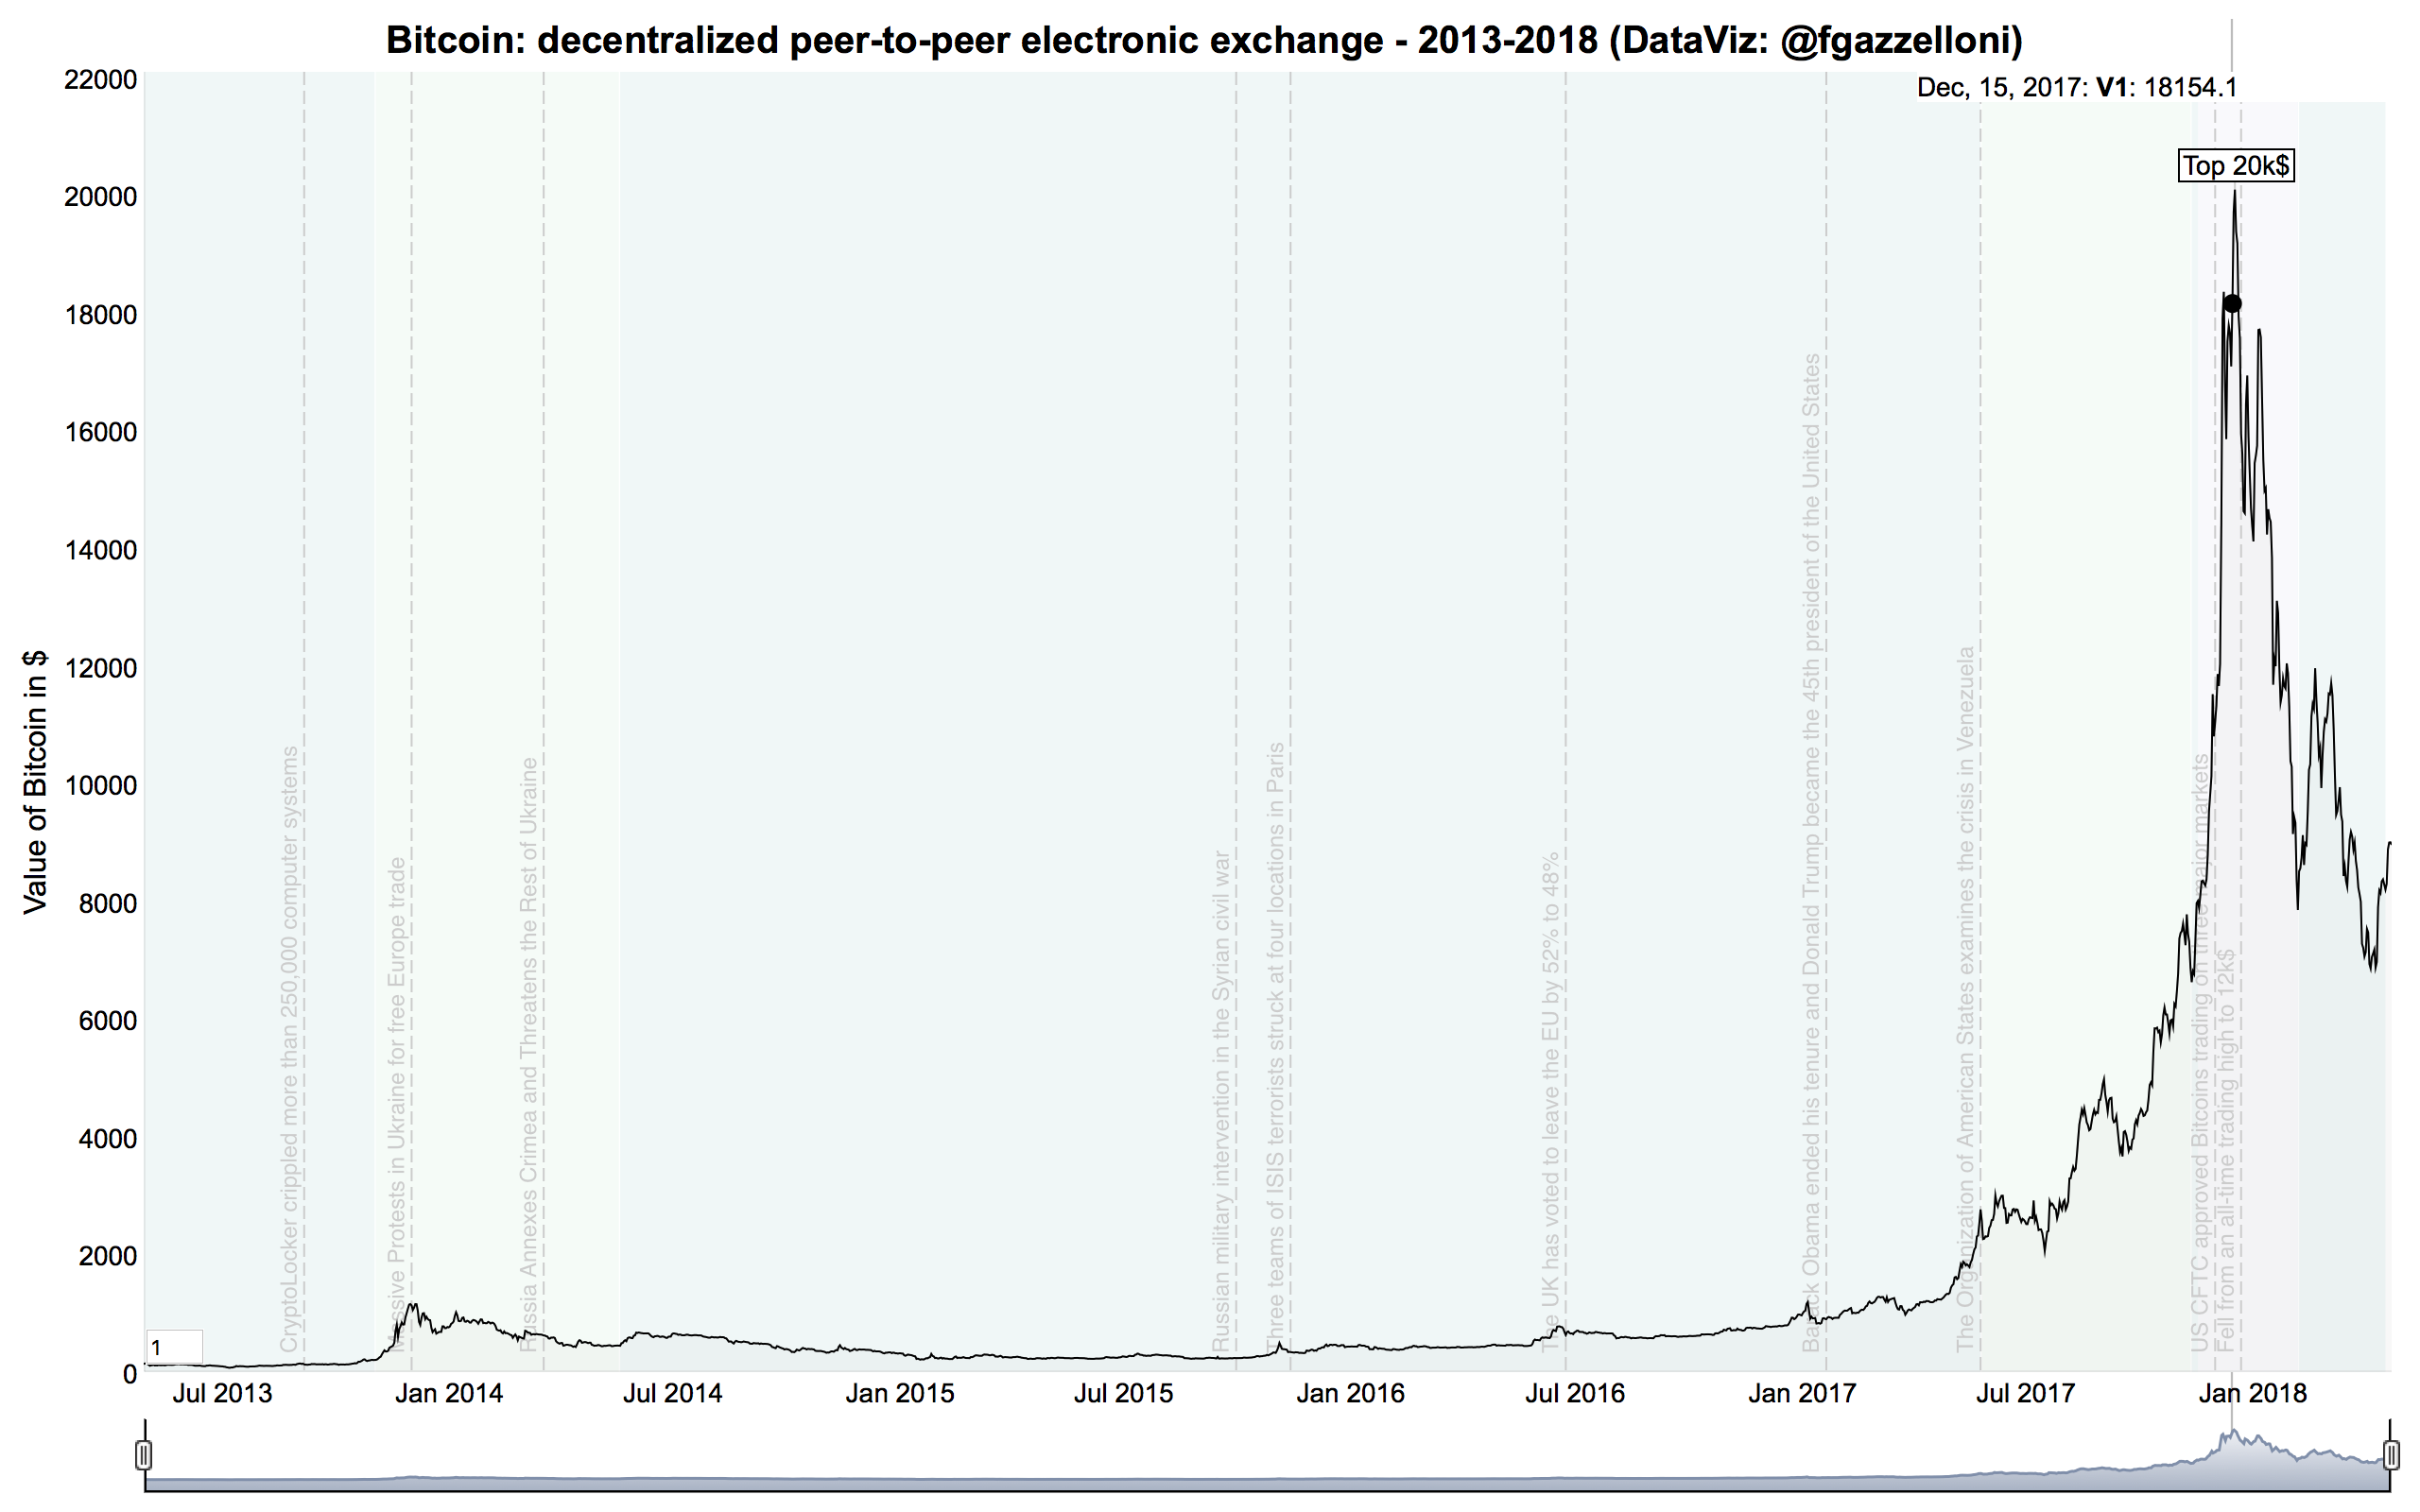
An interactive Bitcoin value time series from 2013 to 2018, with annotations marking major events.
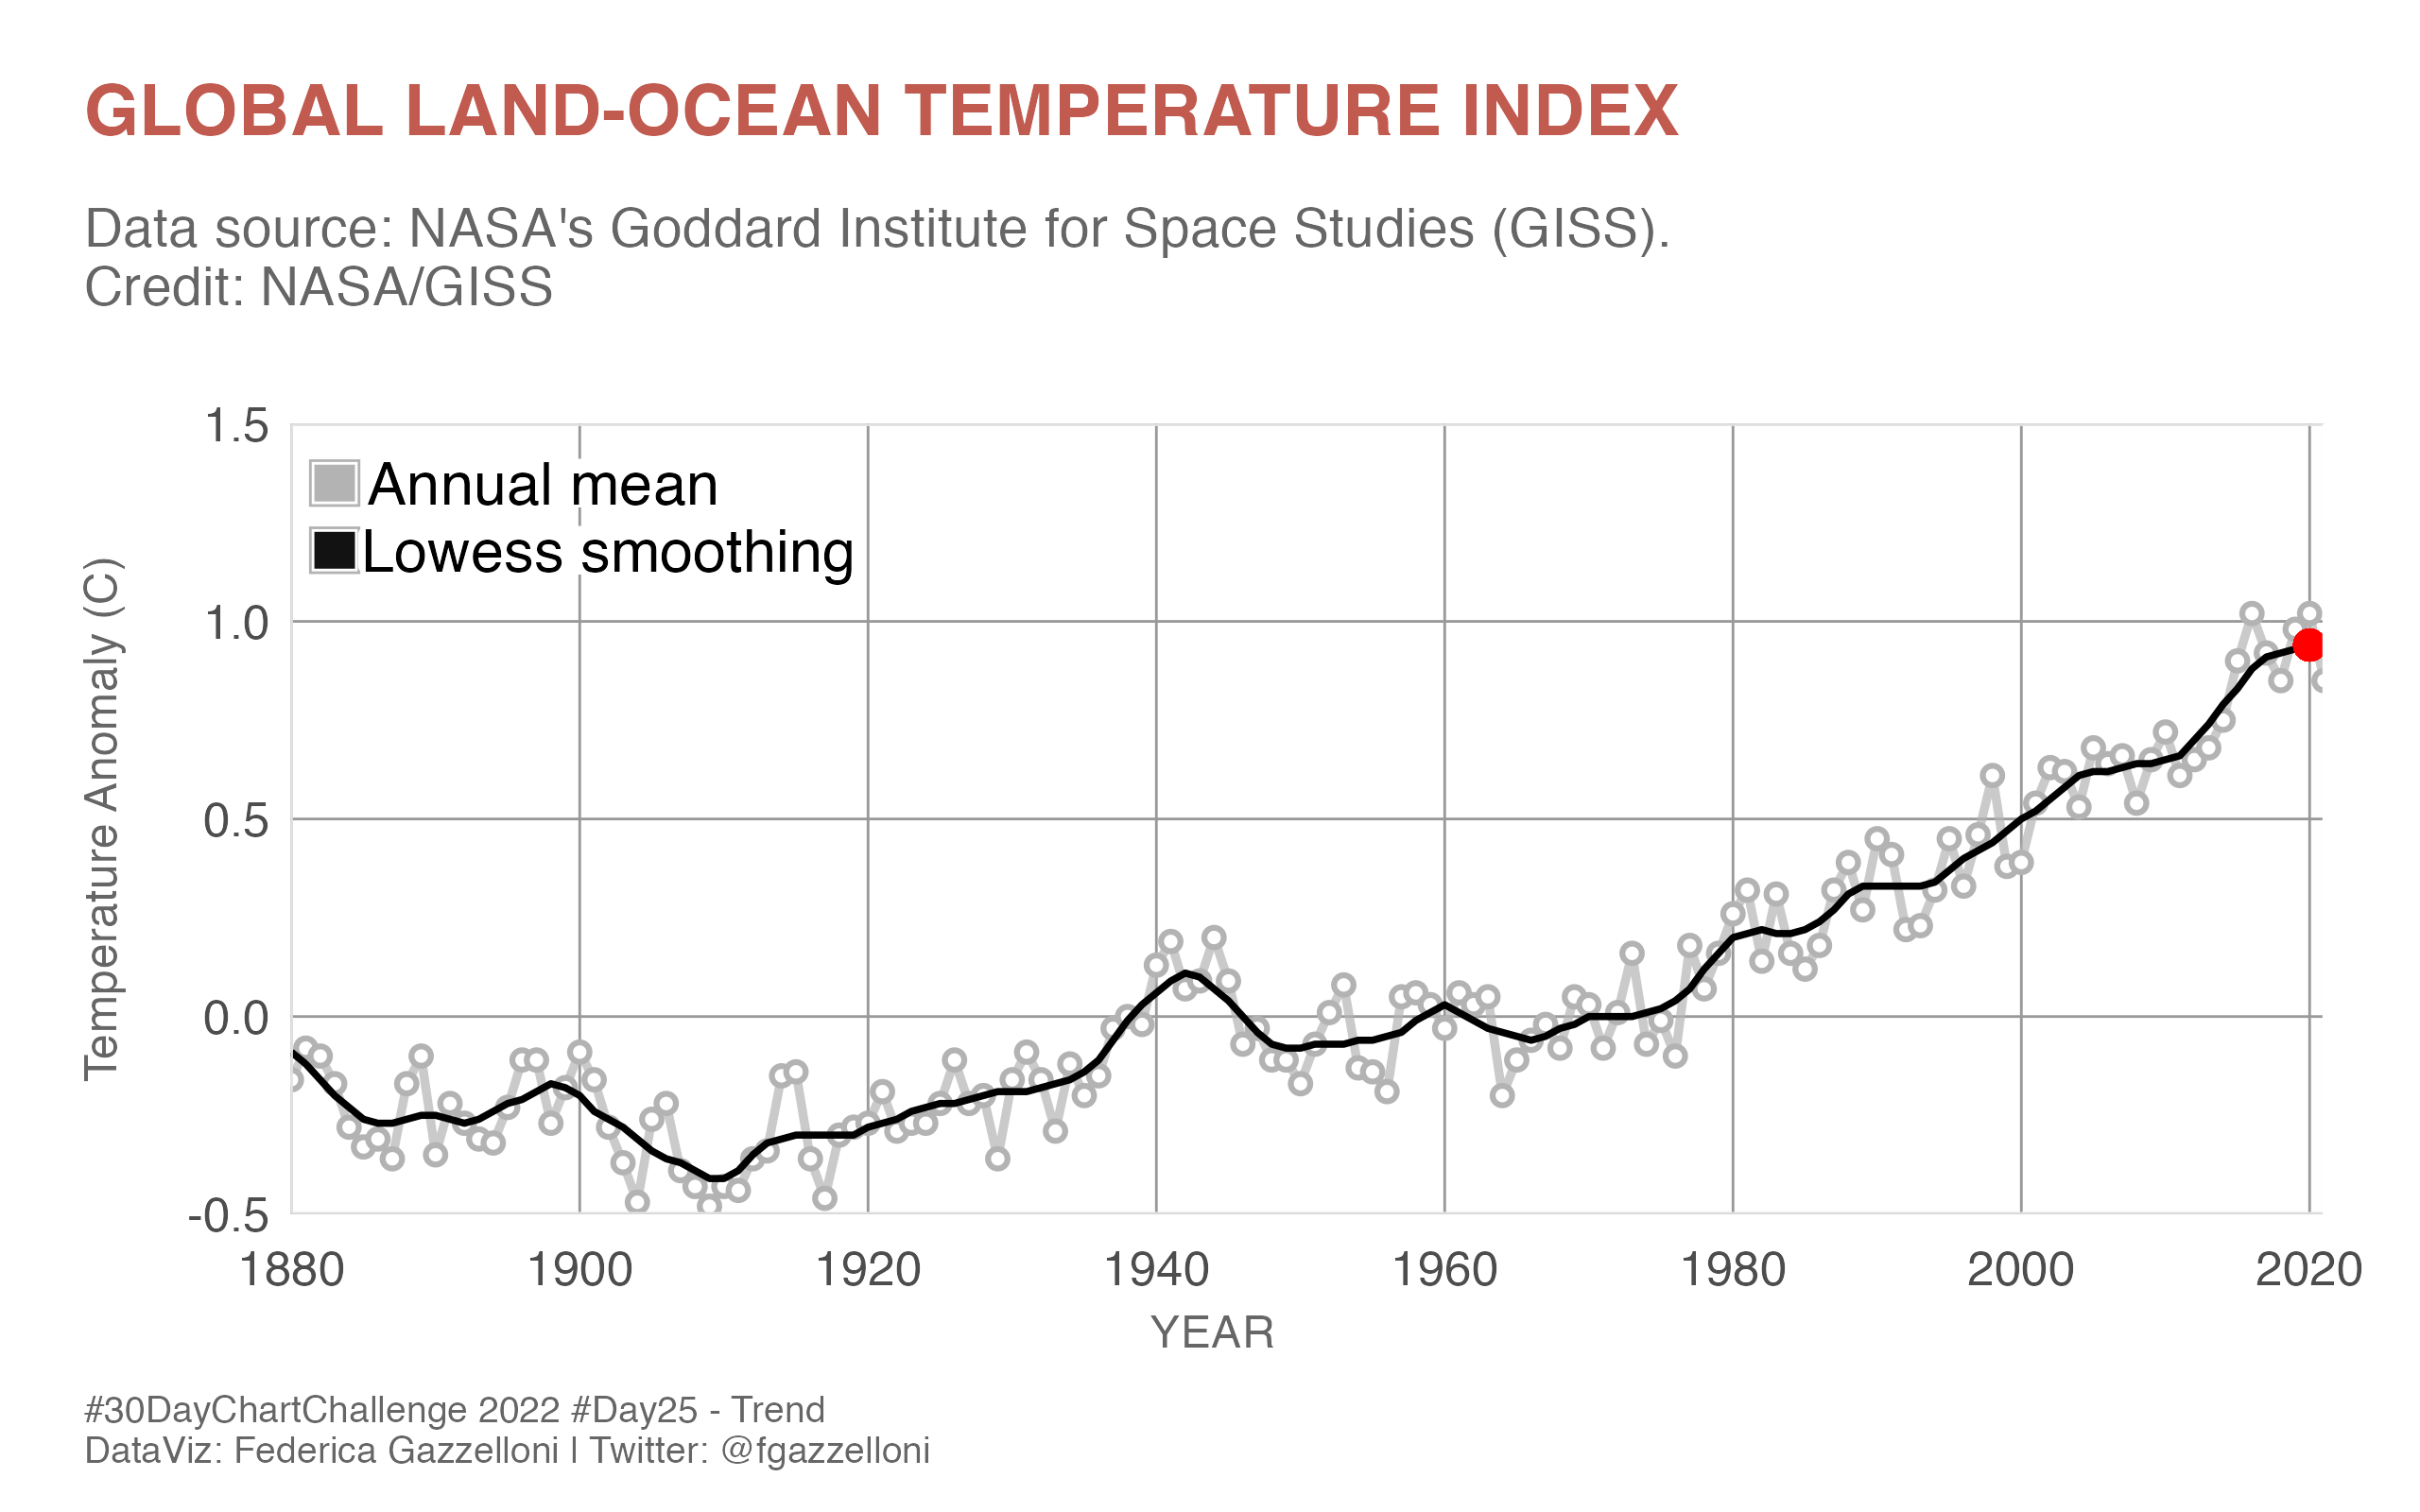
A trend chart of the NASA global land-ocean temperature index.
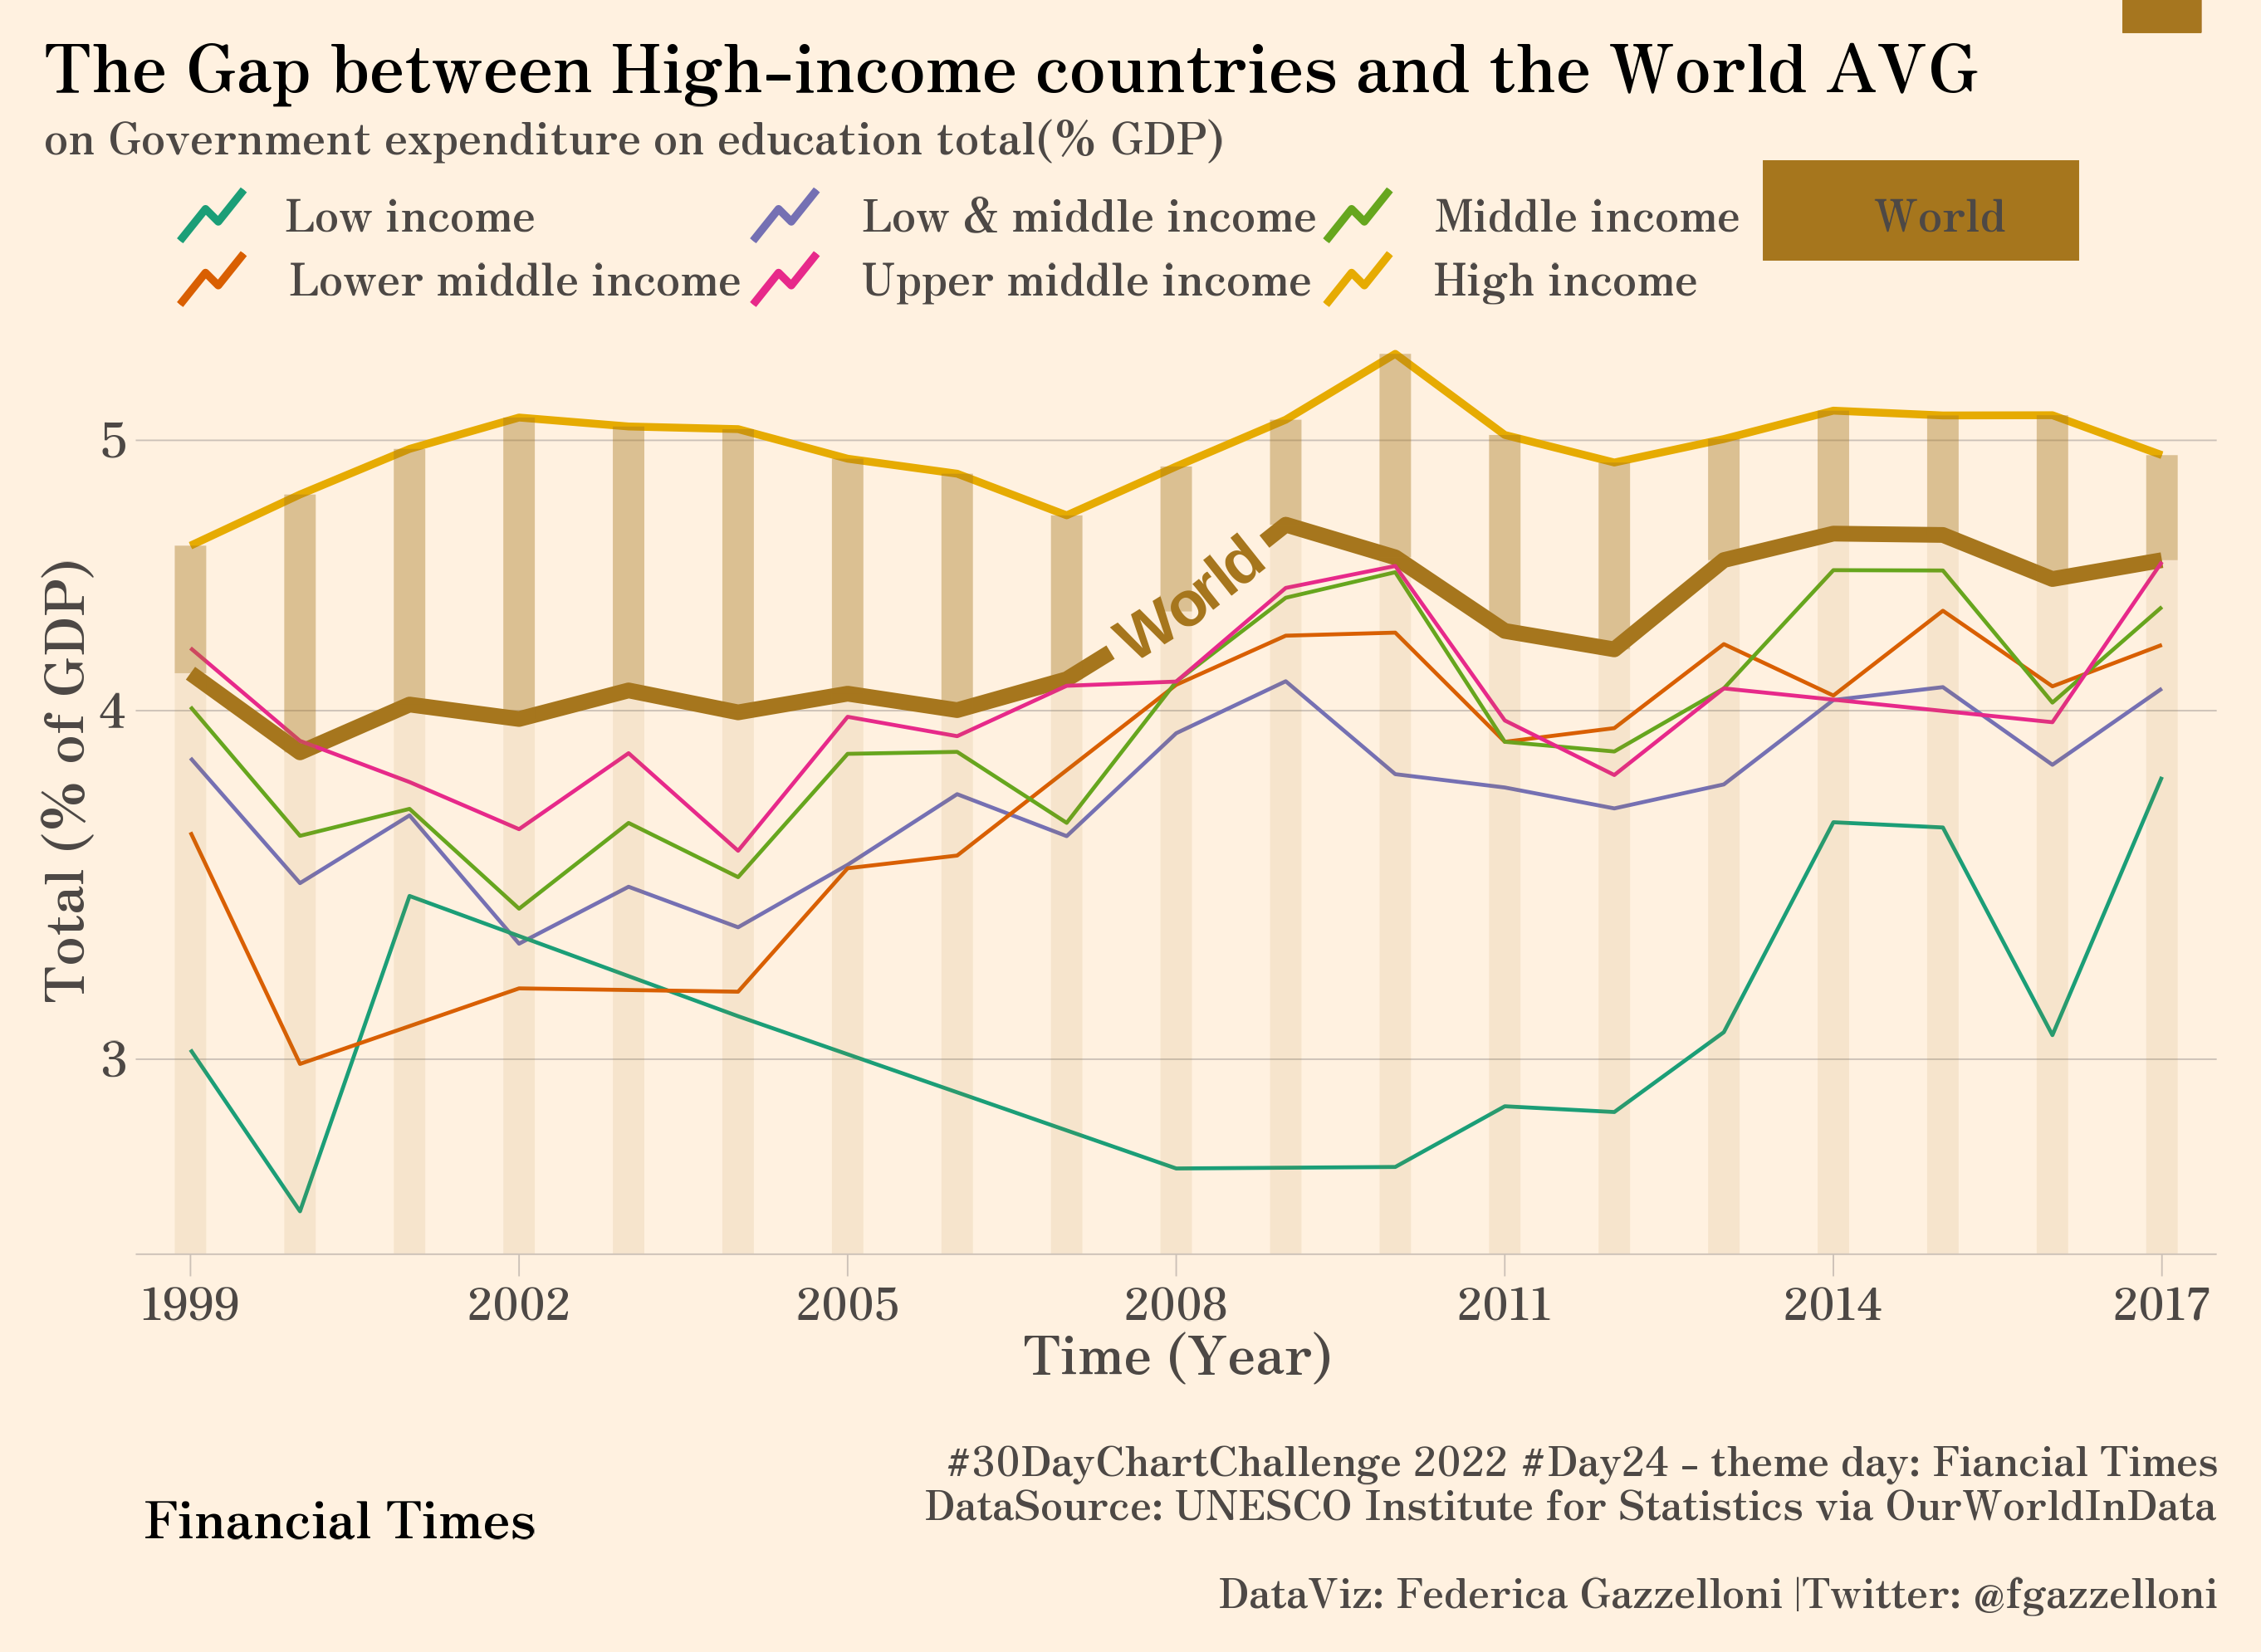
A comparison of education spending in high-income countries and the world average, measured as a share of GDP.
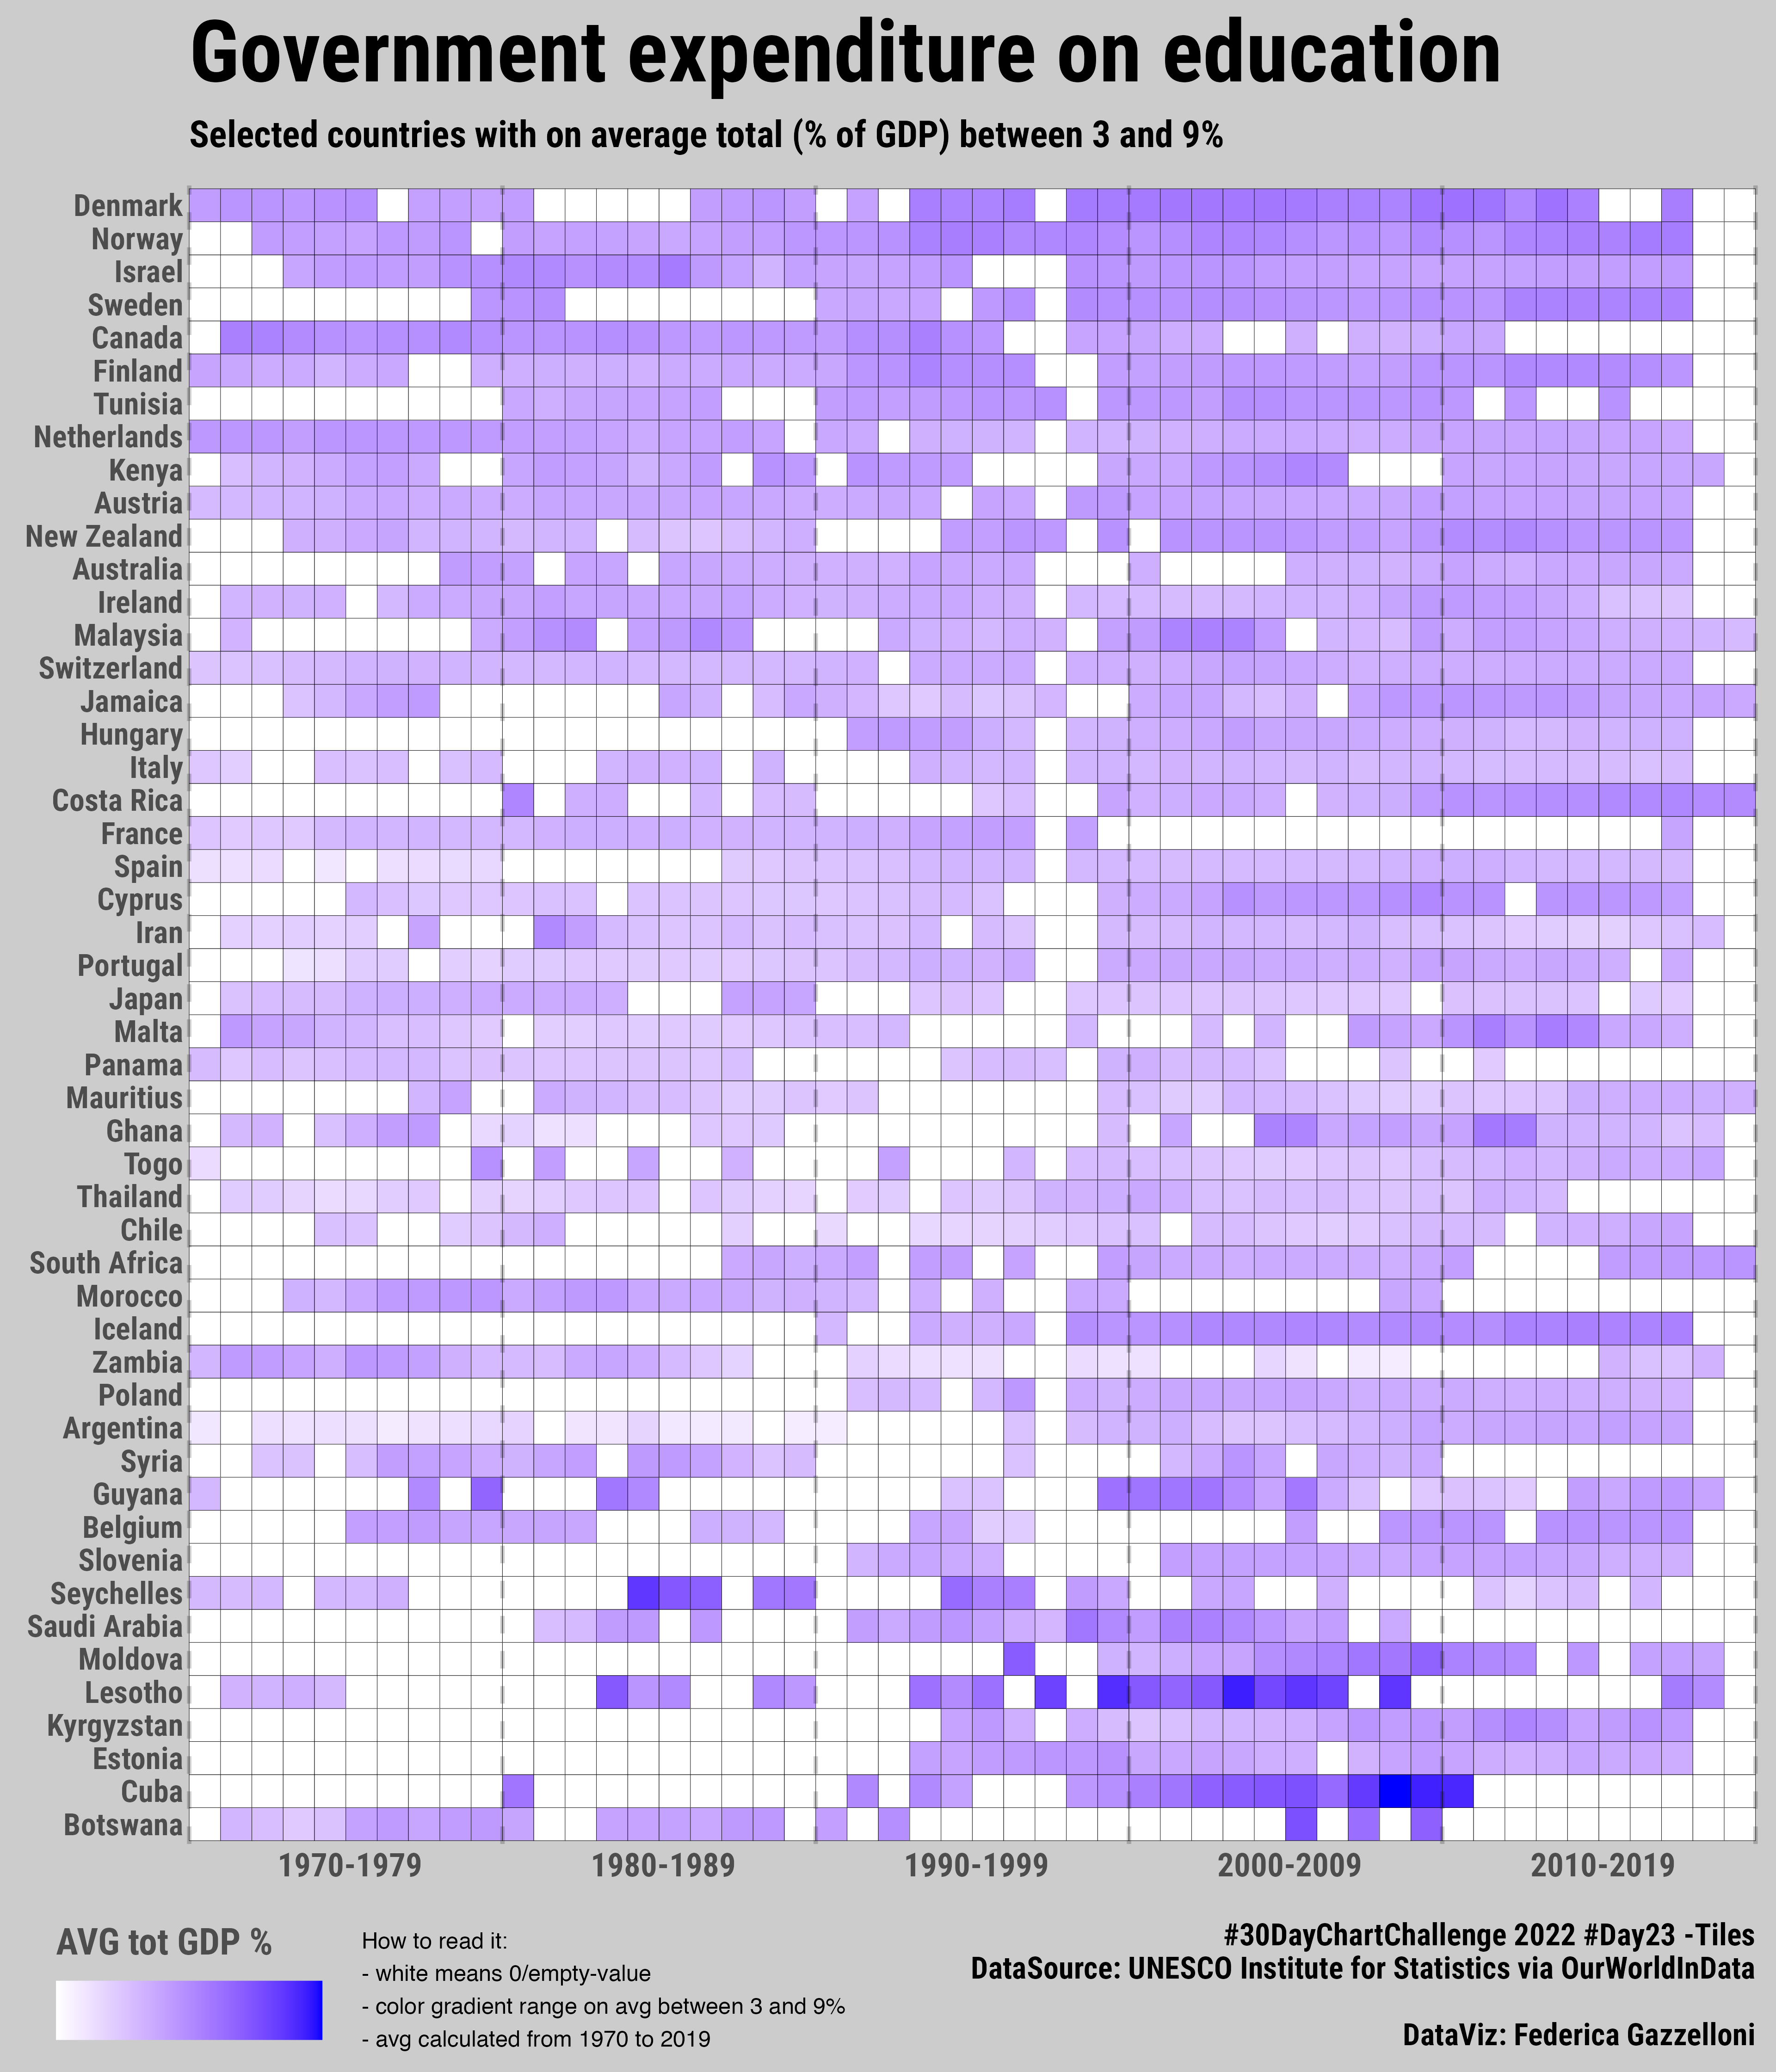
A tiled comparison of government education spending as a share of GDP across selected countries.
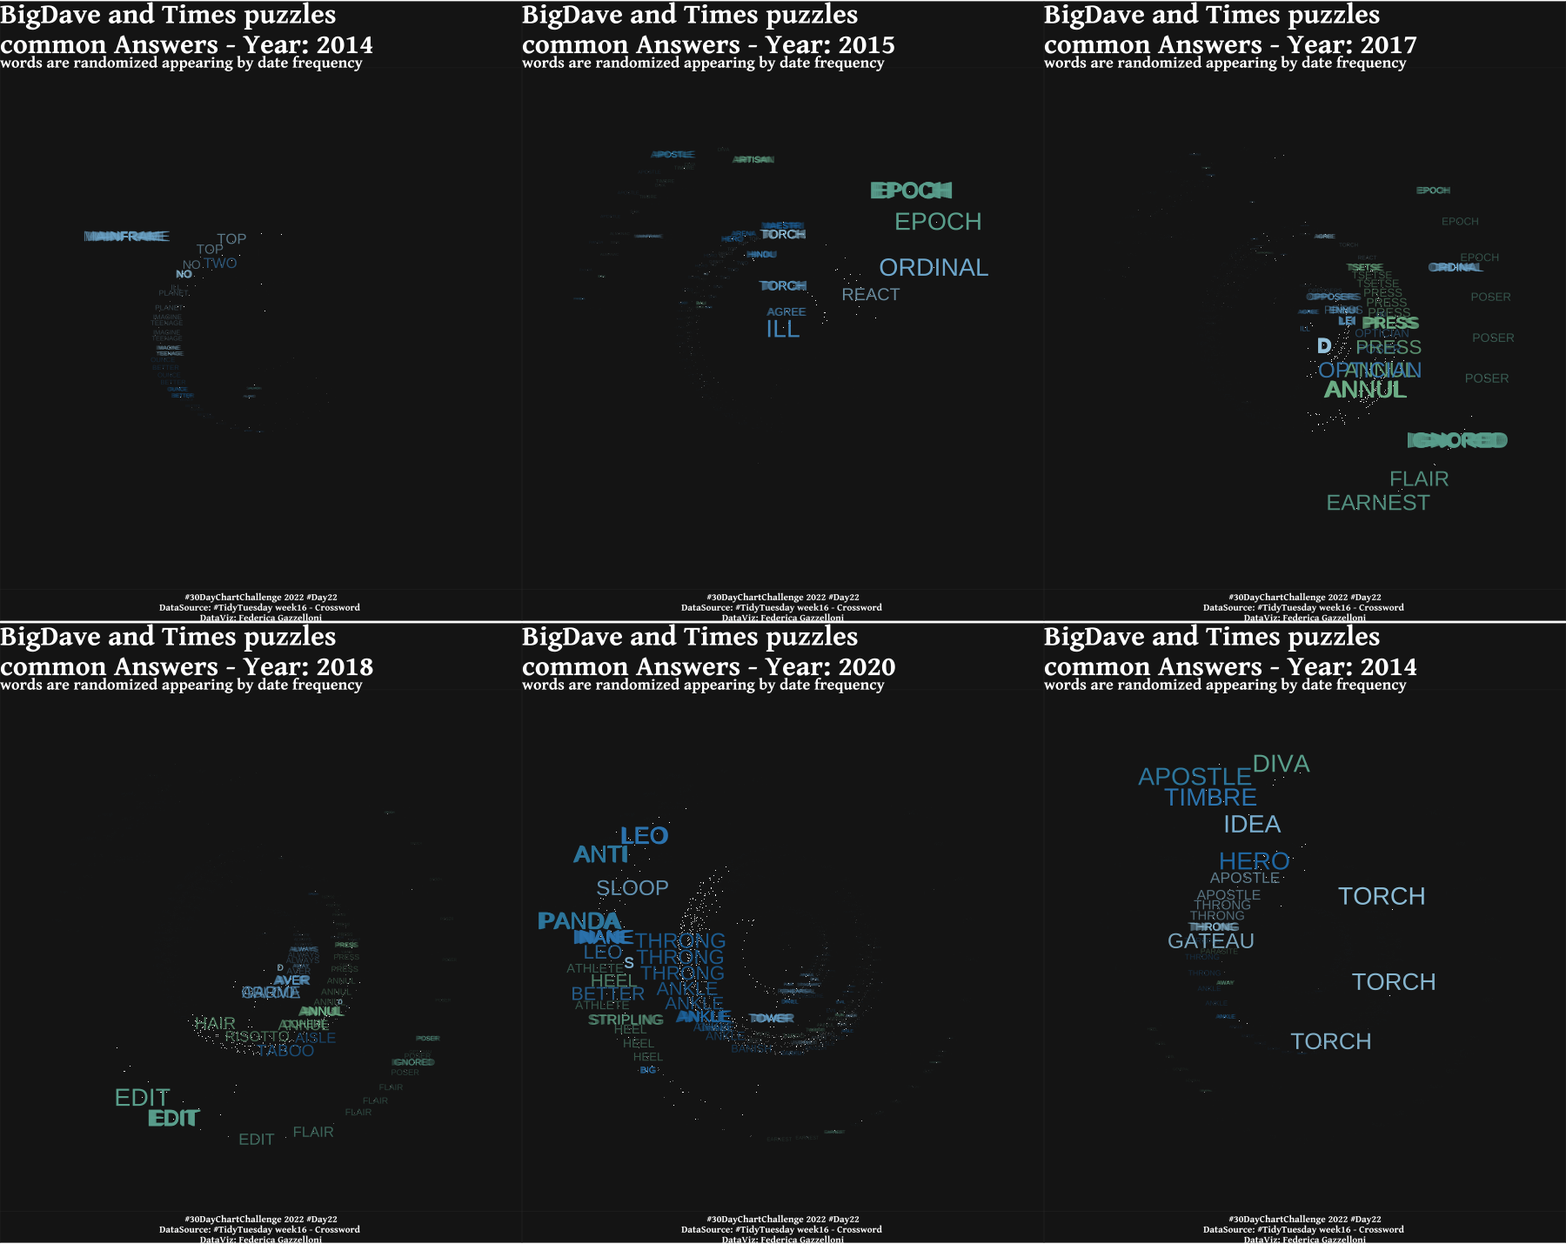
An animation comparing answers to Big Dave and Times crossword puzzles, with words randomized by year.
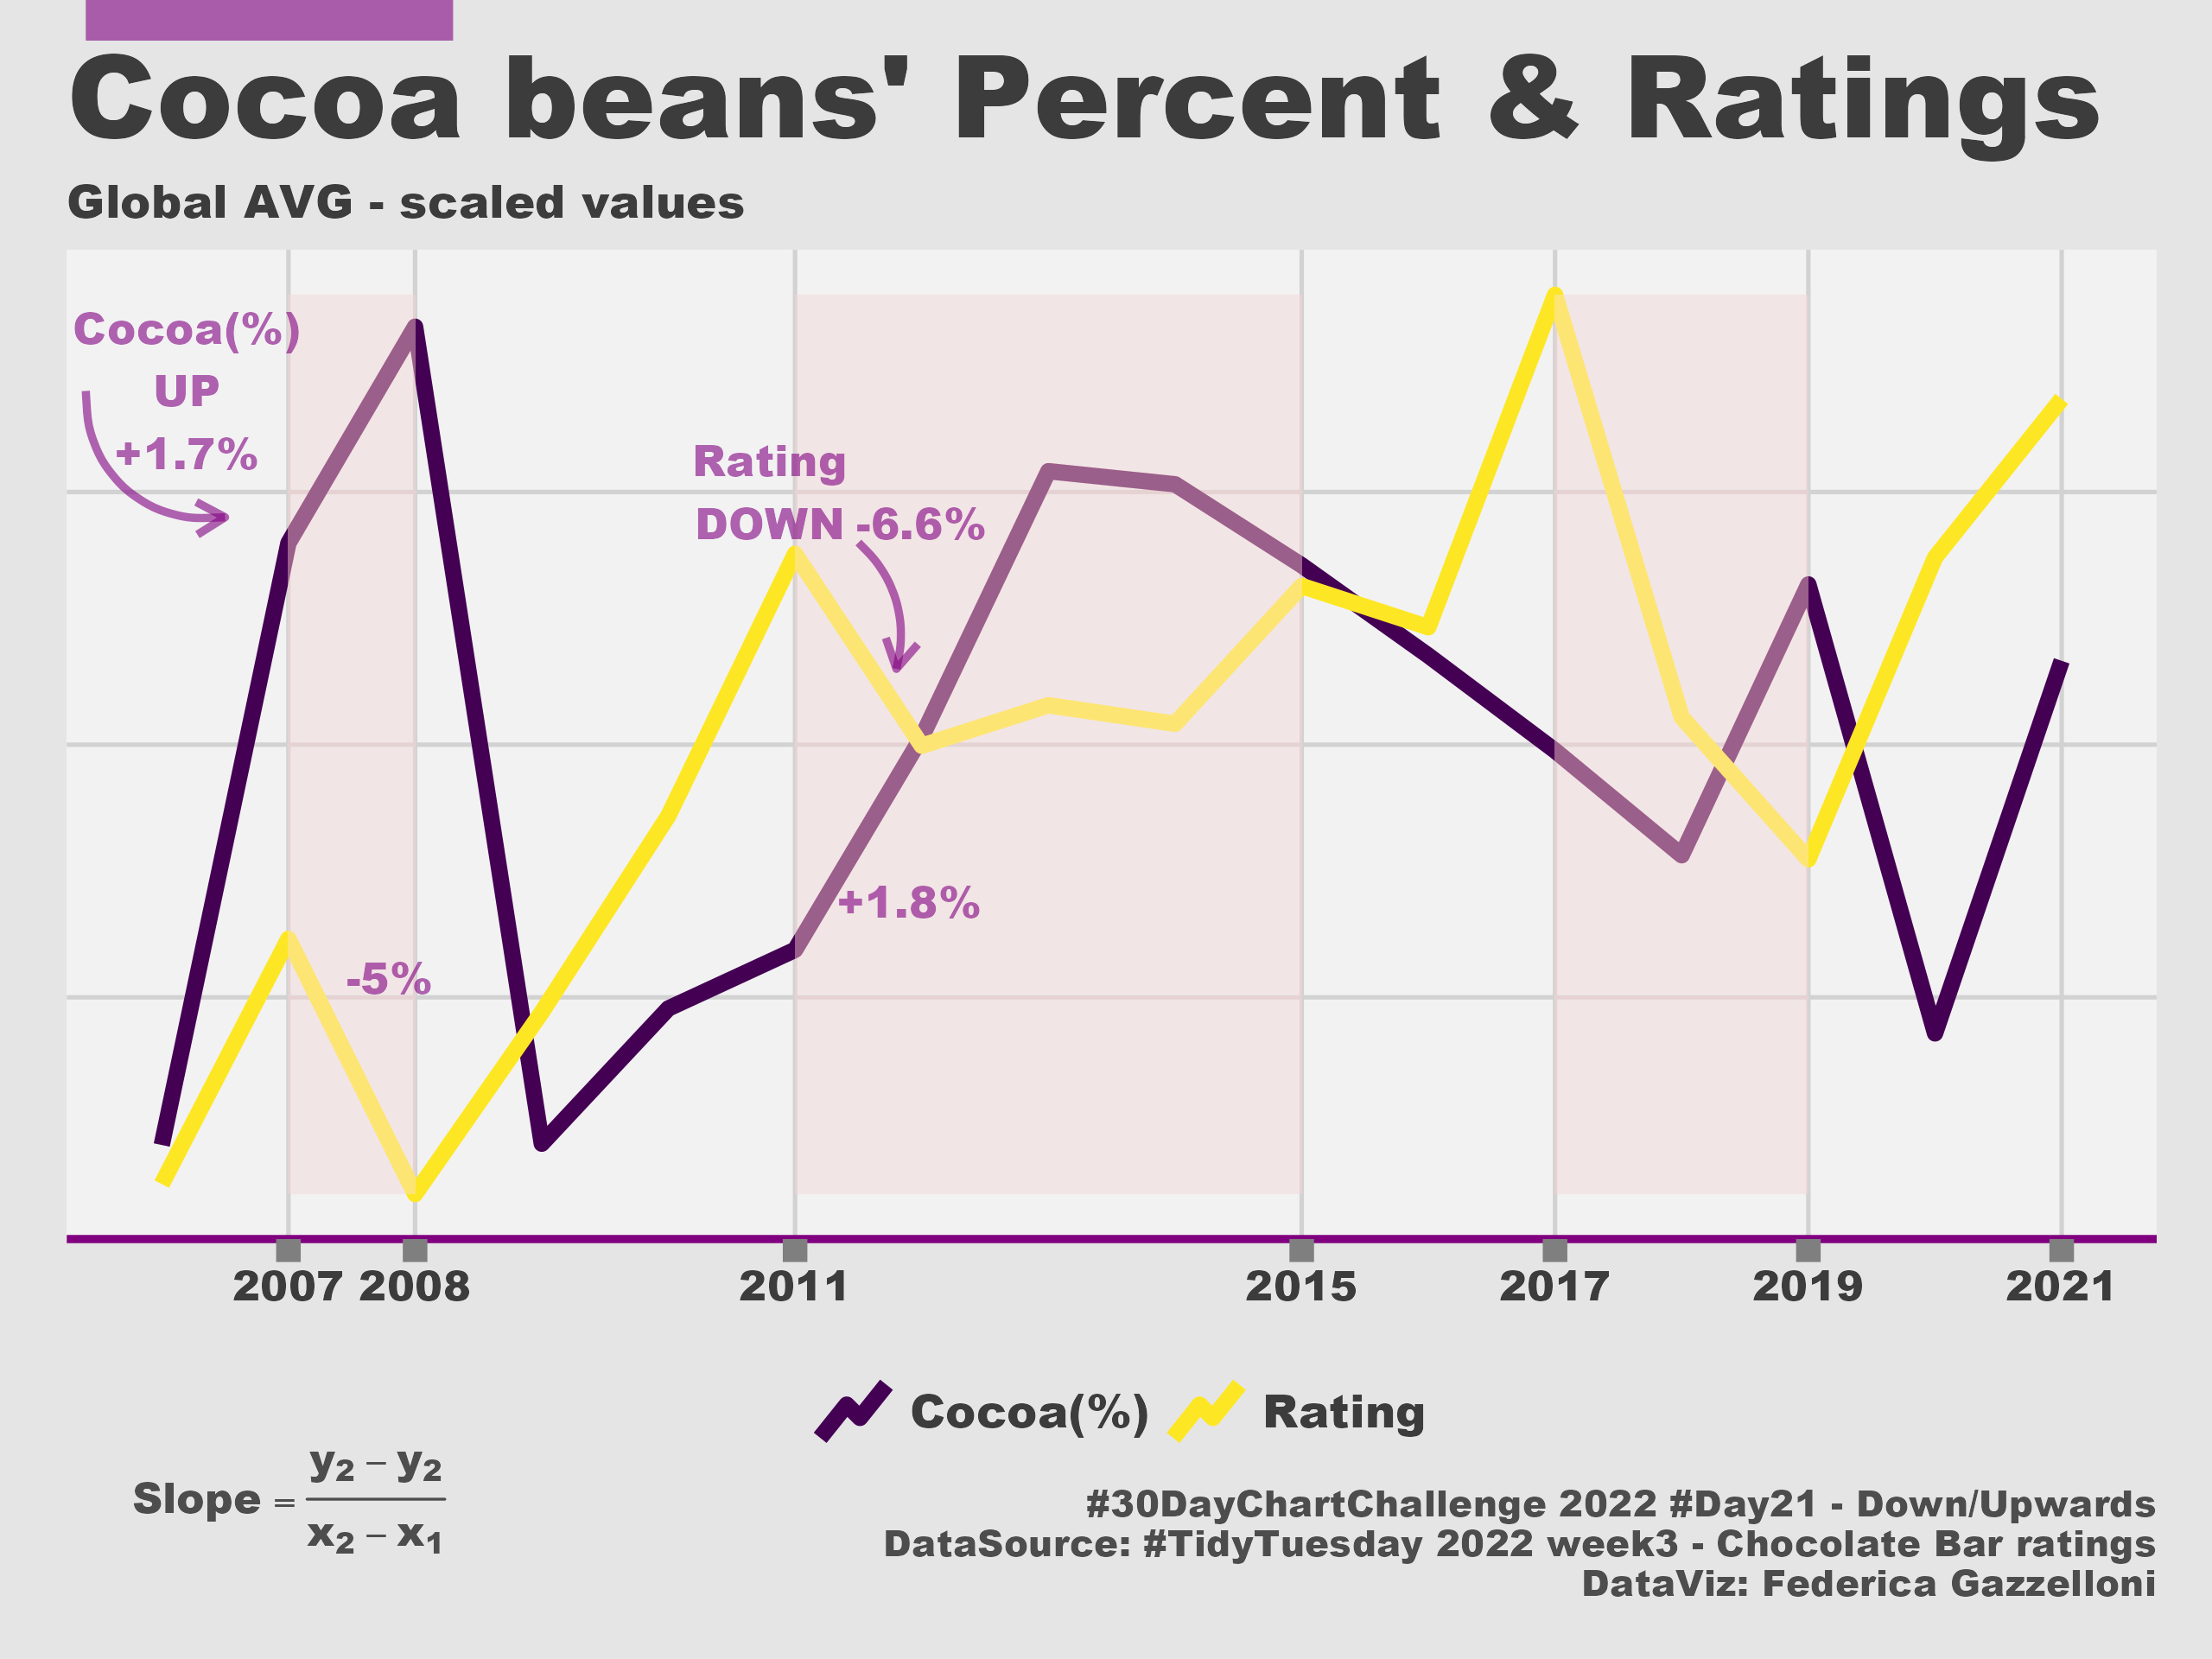
A comparison of global cocoa-bean prices and ratings, showing values moving upward and downward.
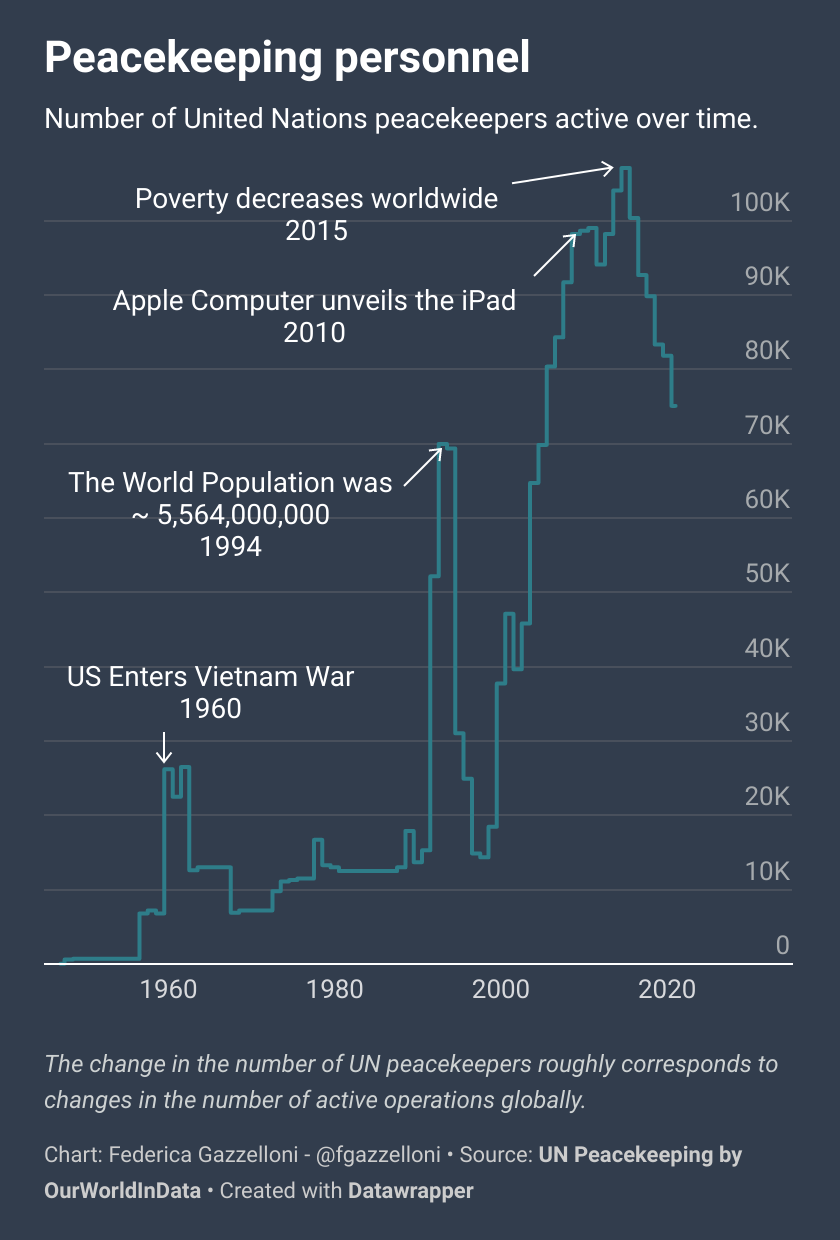
A visualization exploring the size of United Nations peacekeeping forces as a new-tool data challenge.
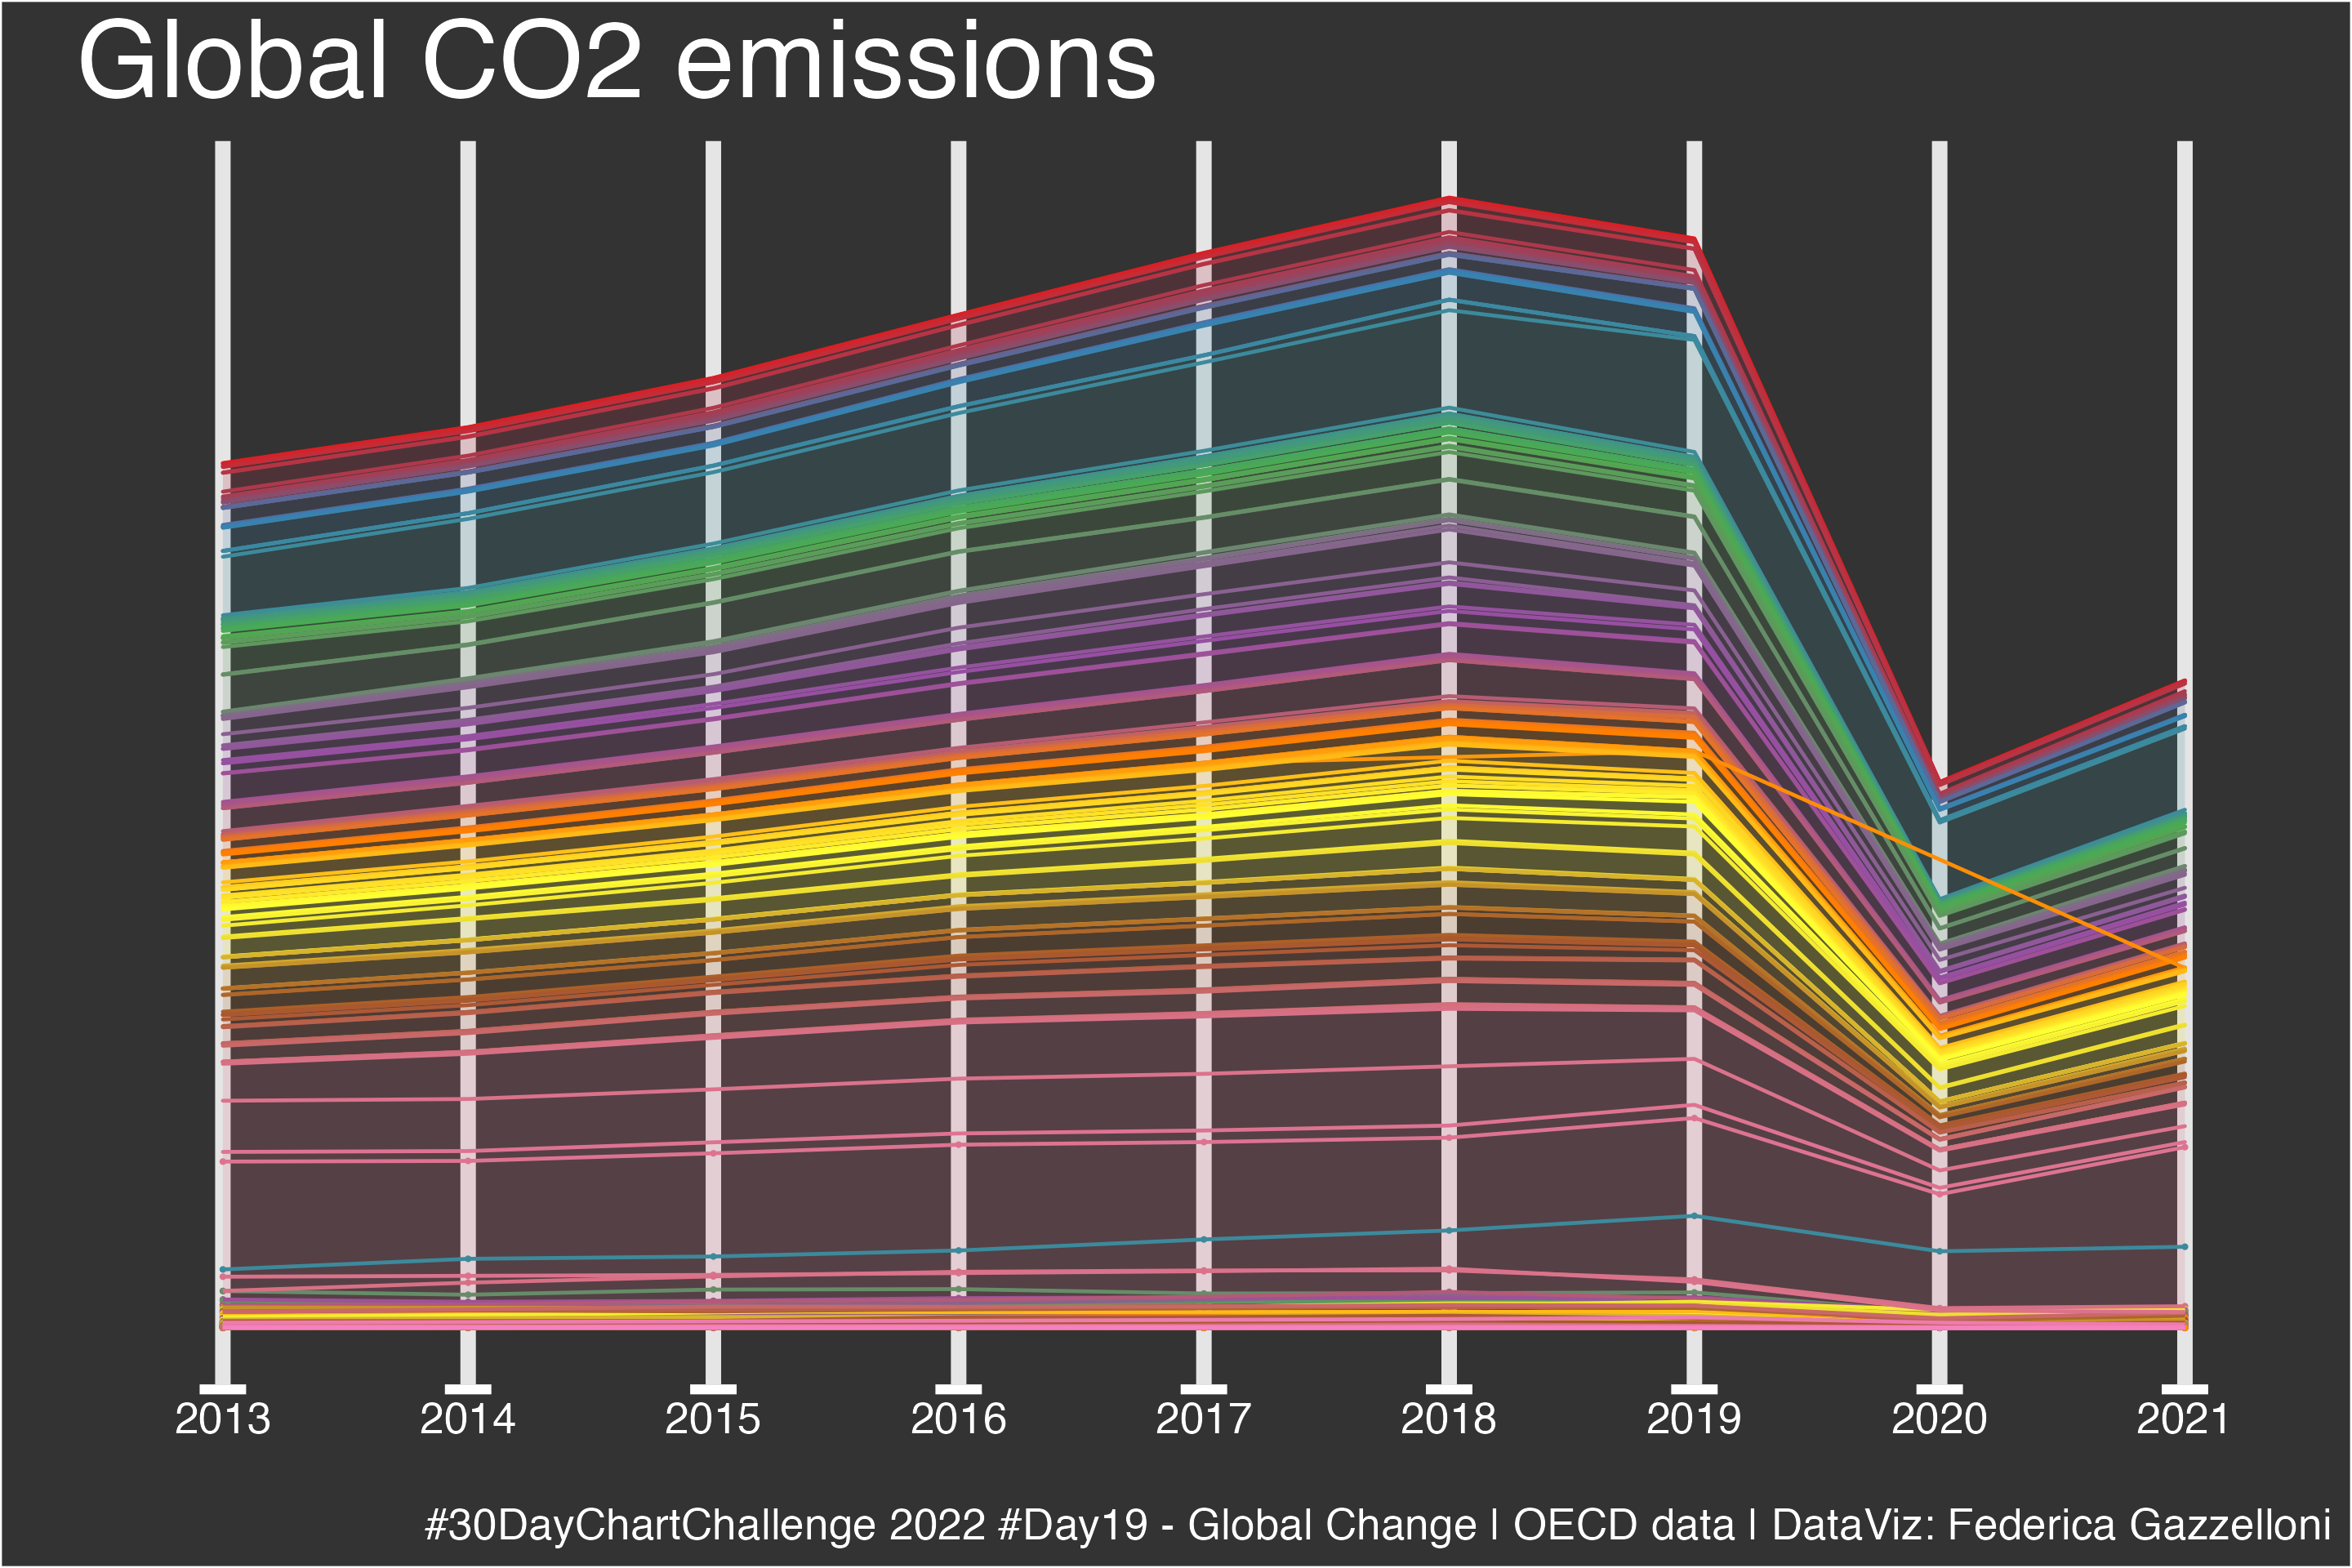
A global trend chart of carbon dioxide emissions using OECD data.
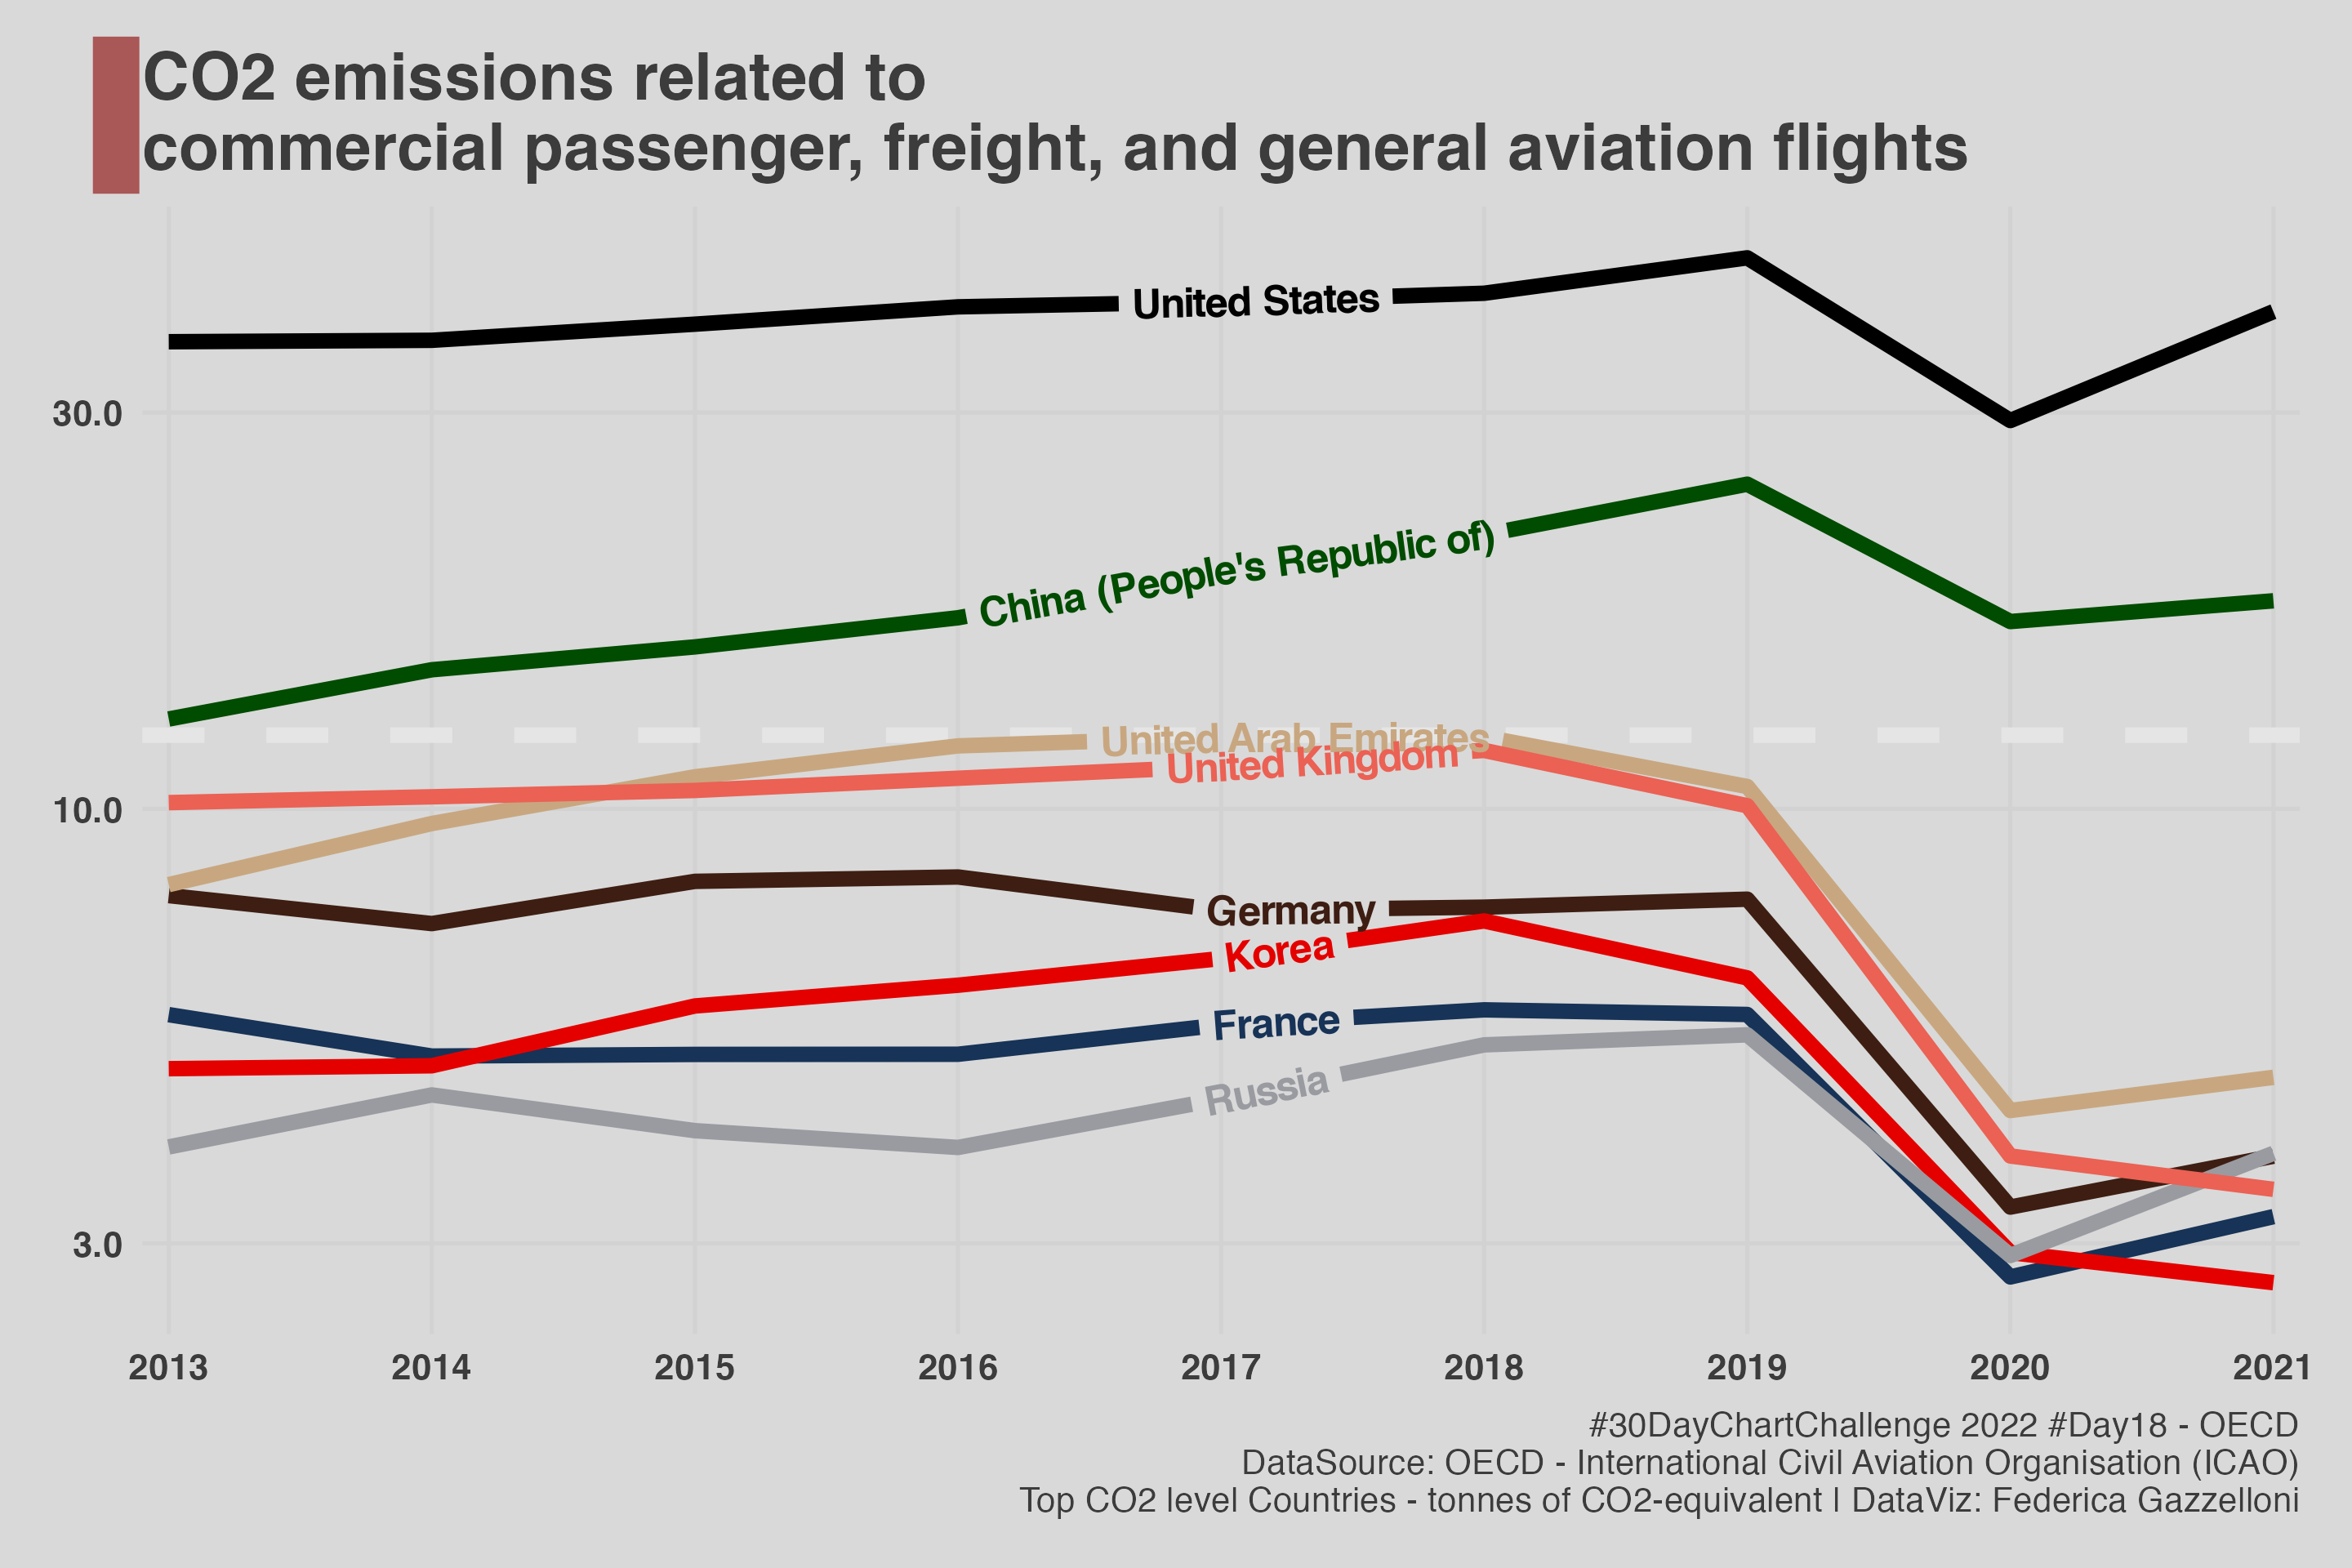
A chart of aviation-related CO2 emissions from commercial passenger, freight, and general aviation flights.
A network visualization of bird assemblages at Australian bird baths using the TidyTuesday dataset.
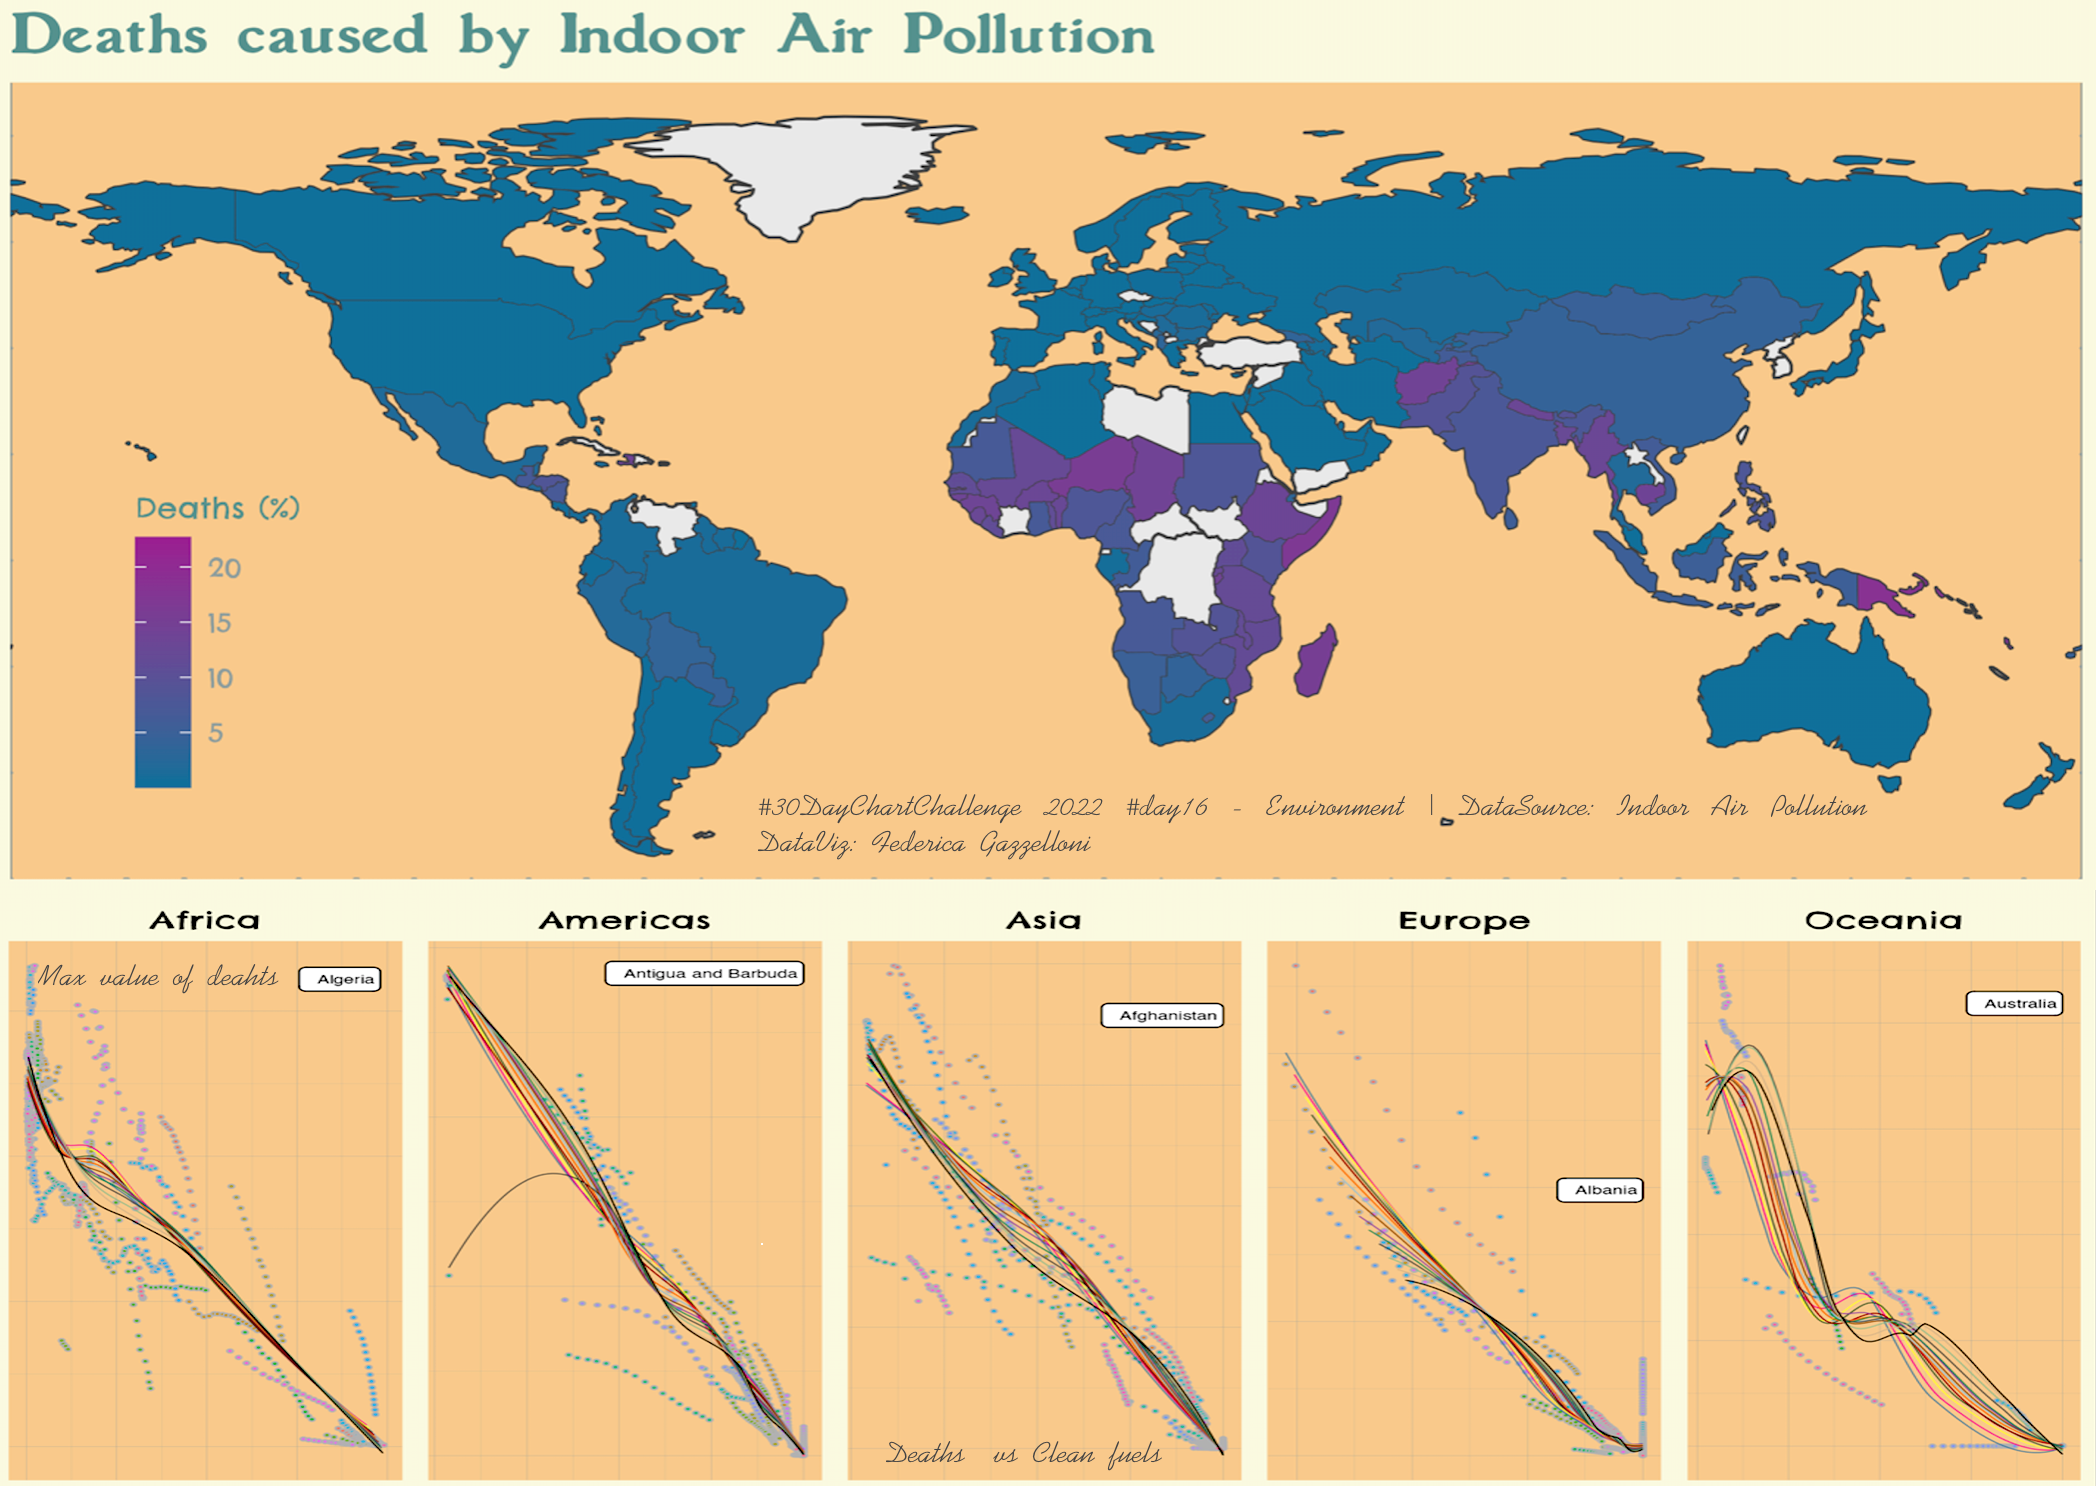
A chart relating household air-pollution deaths to access to clean cooking fuels and GDP per capita.
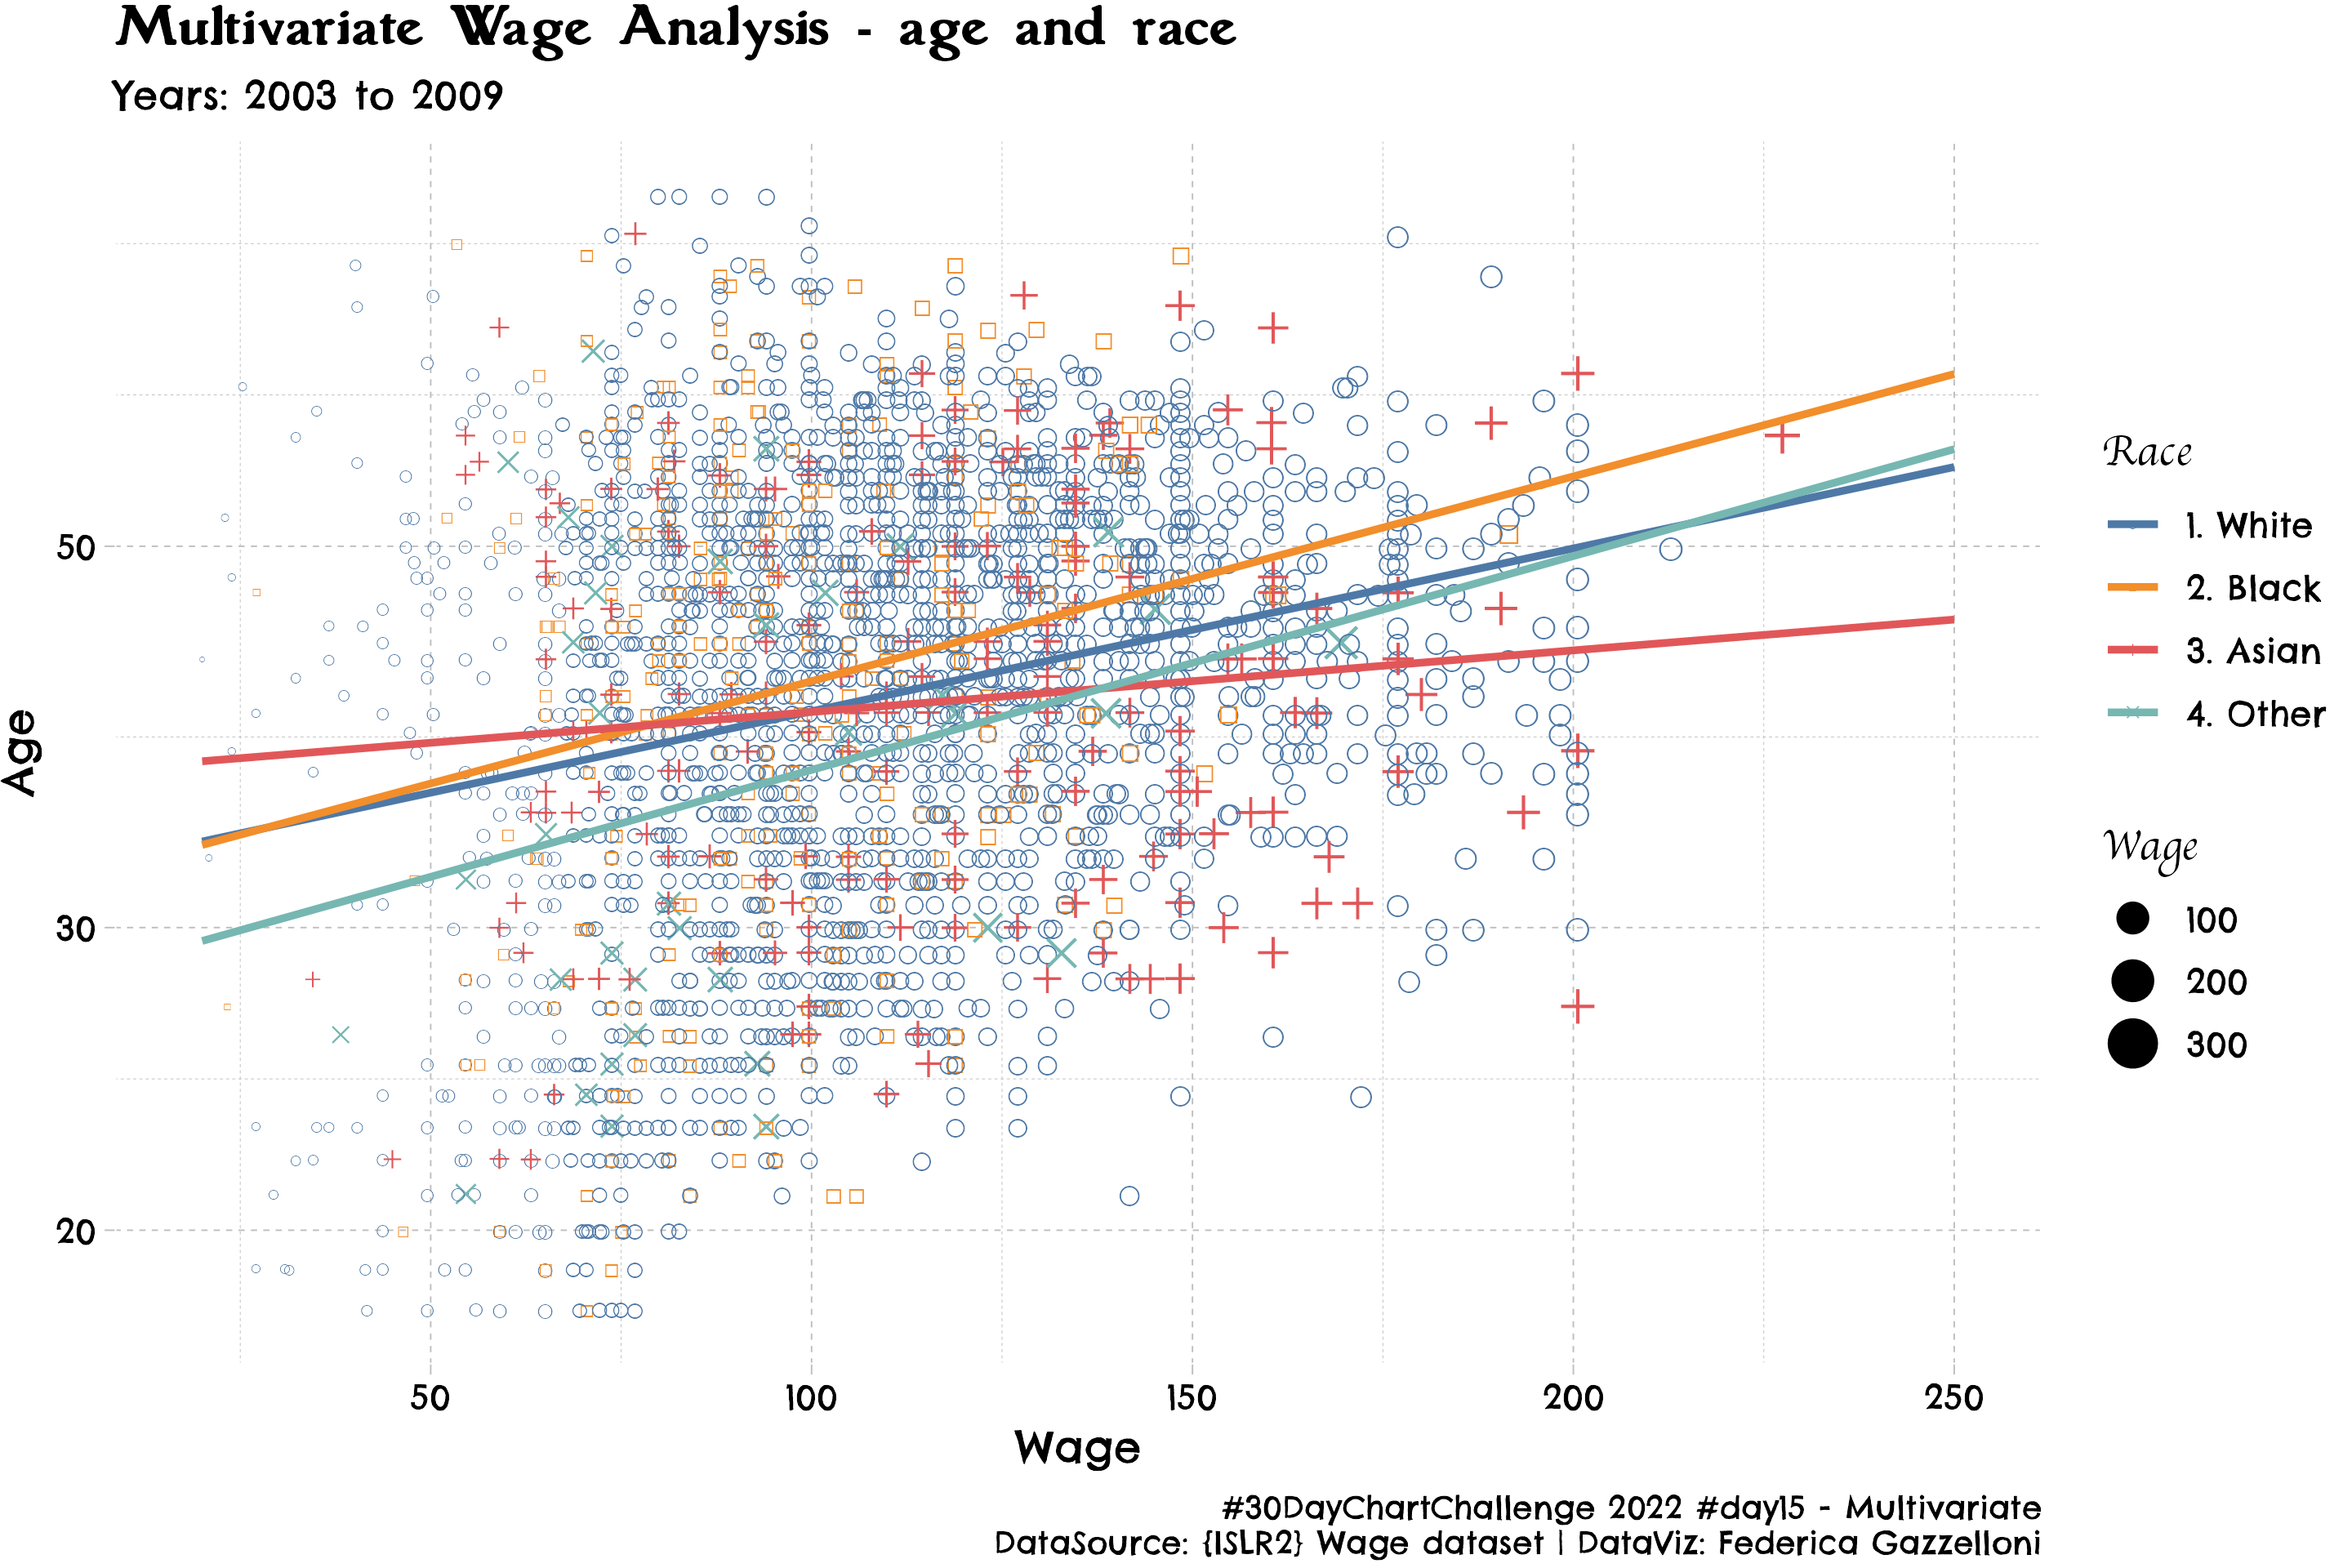
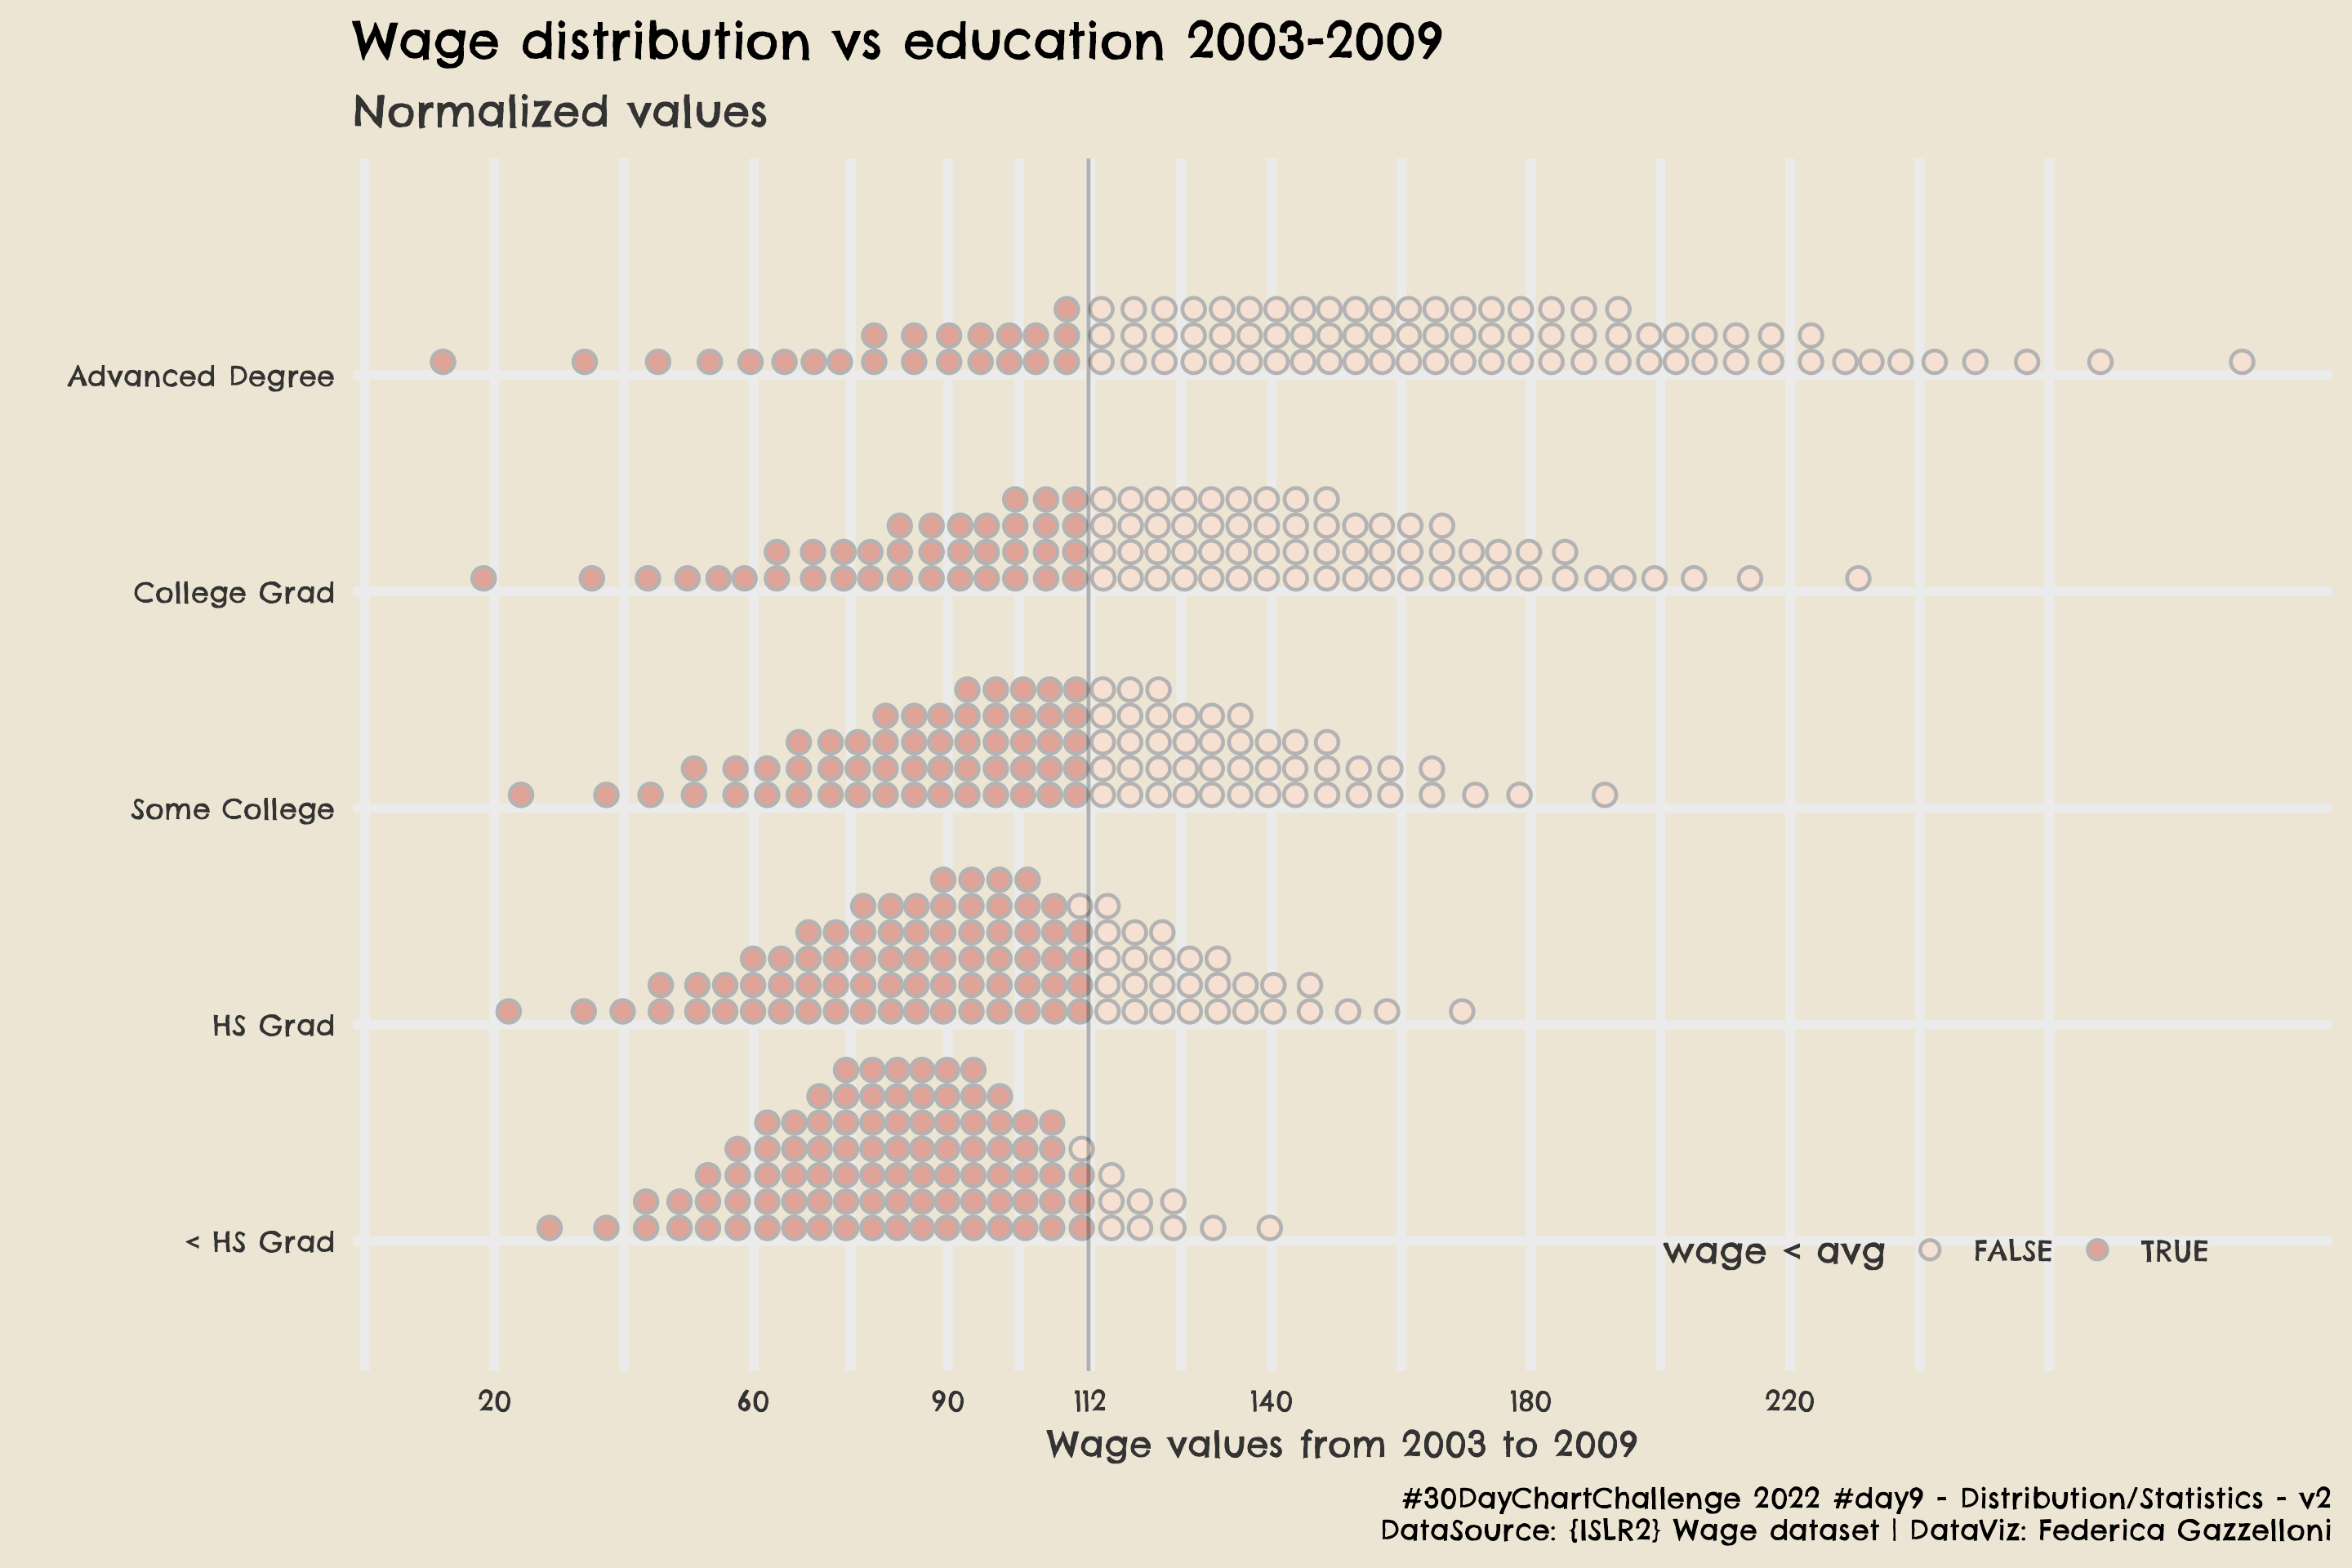
A multivariate view of wage distributions by education in the Mid-Atlantic from 2003 to 2009.
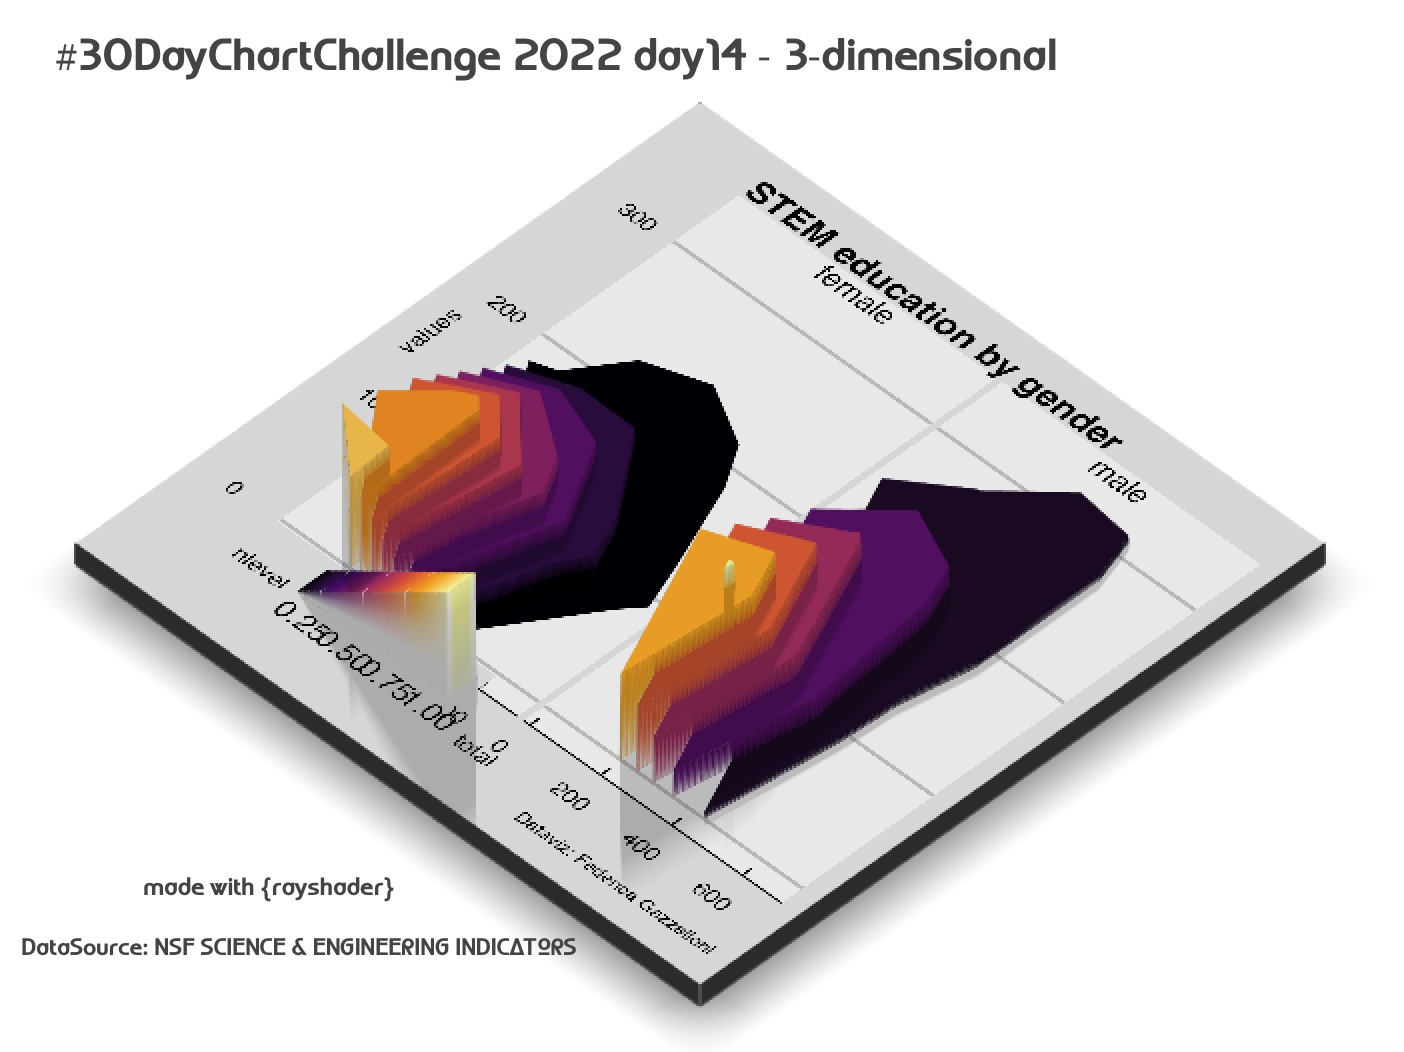
A 3D comparison of STEM education by gender using 2019 employment data for scientists and engineers.
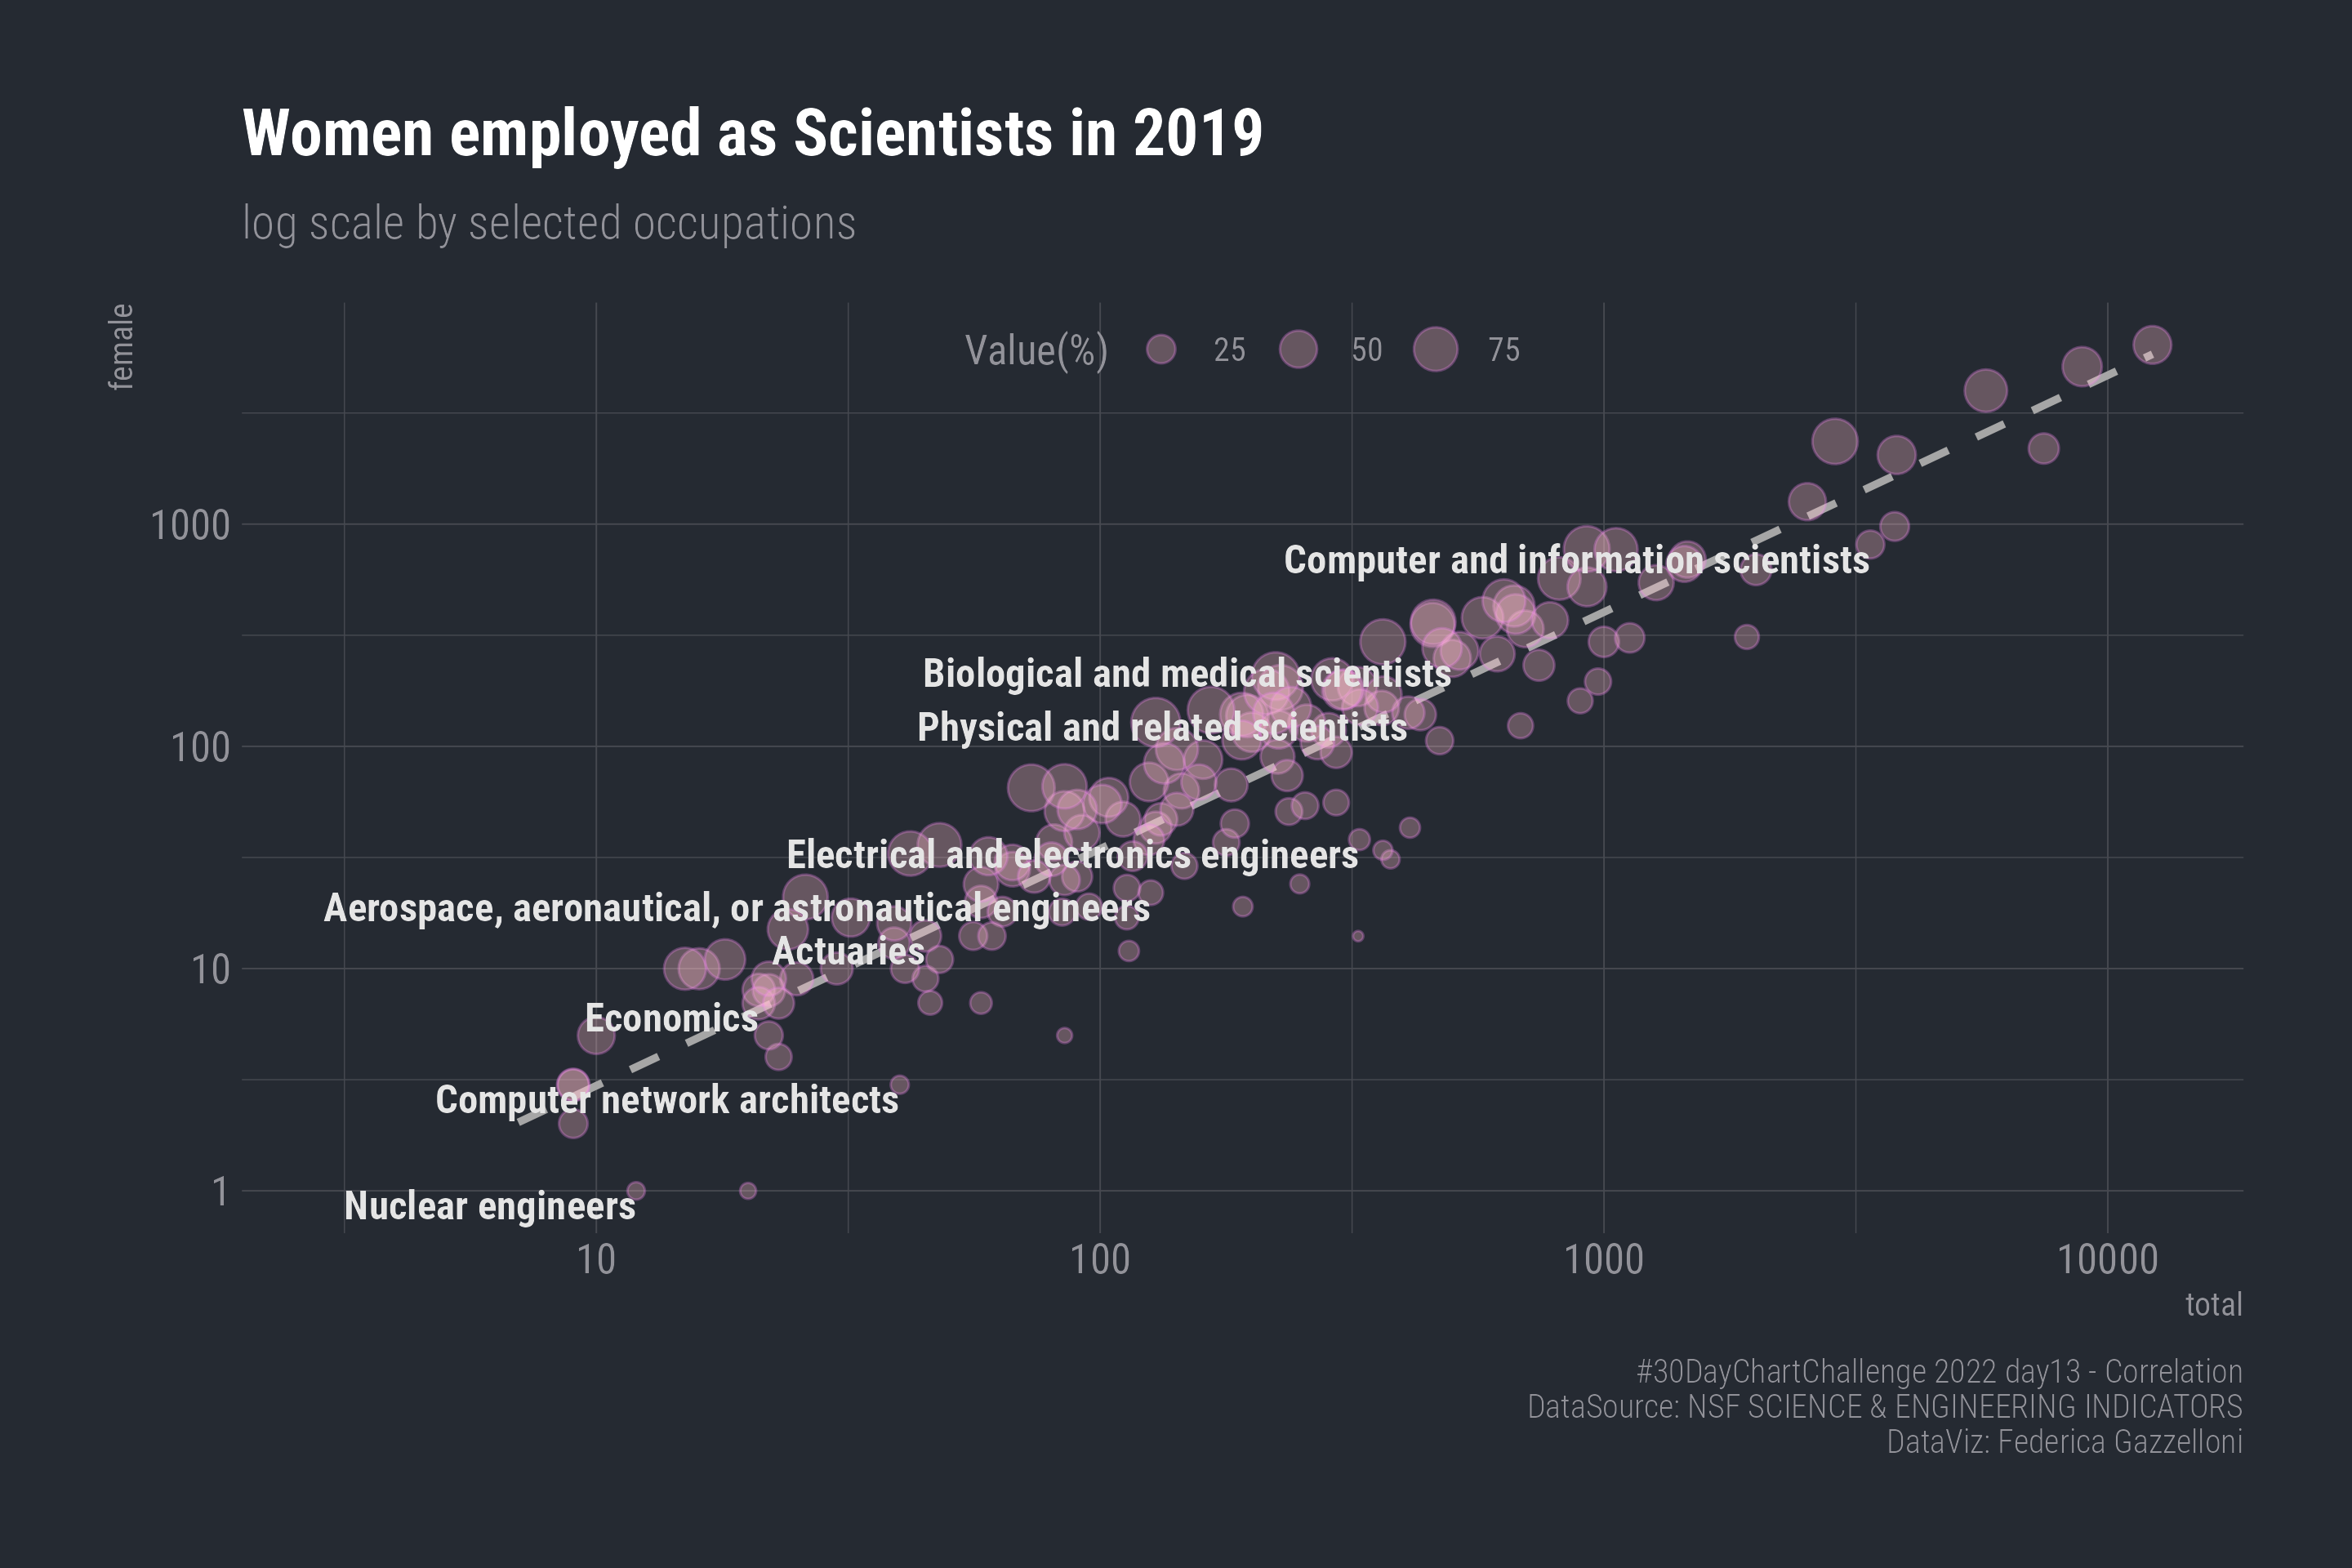
A log-scale comparison of women employed as scientists across selected occupations in 2019.
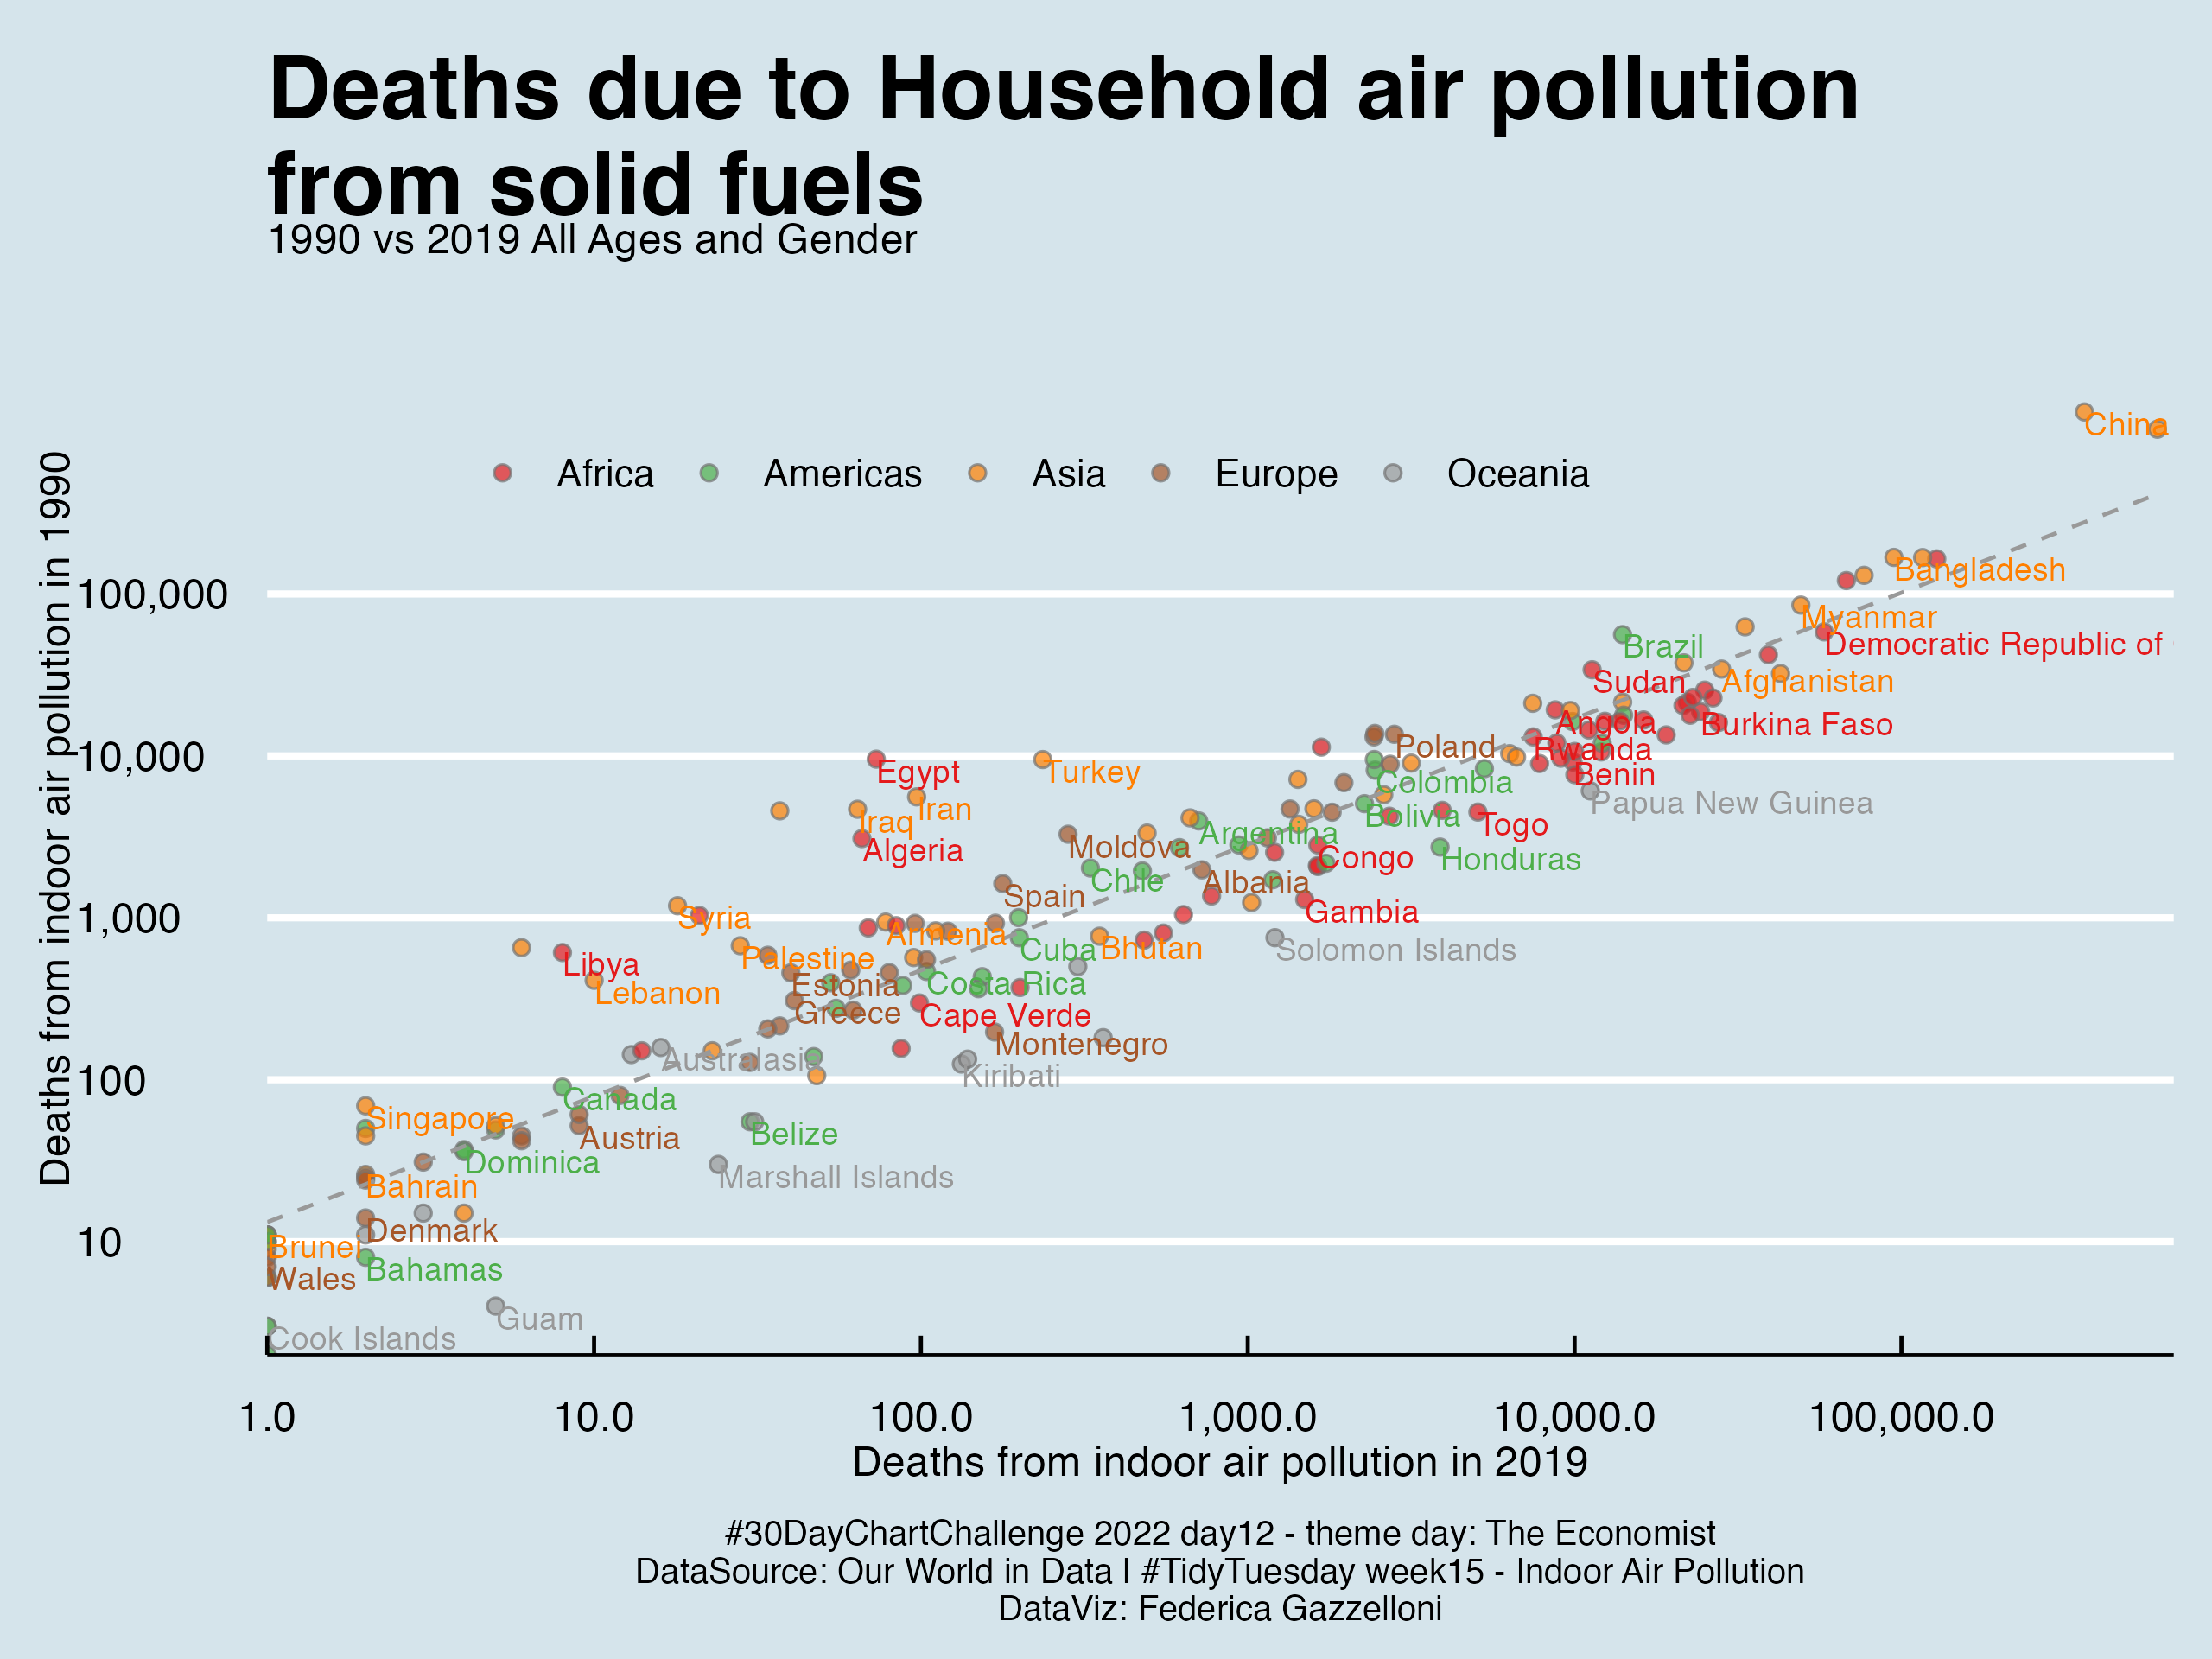
A comparison of deaths linked to household air pollution from solid fuels in 1990 and 2019.
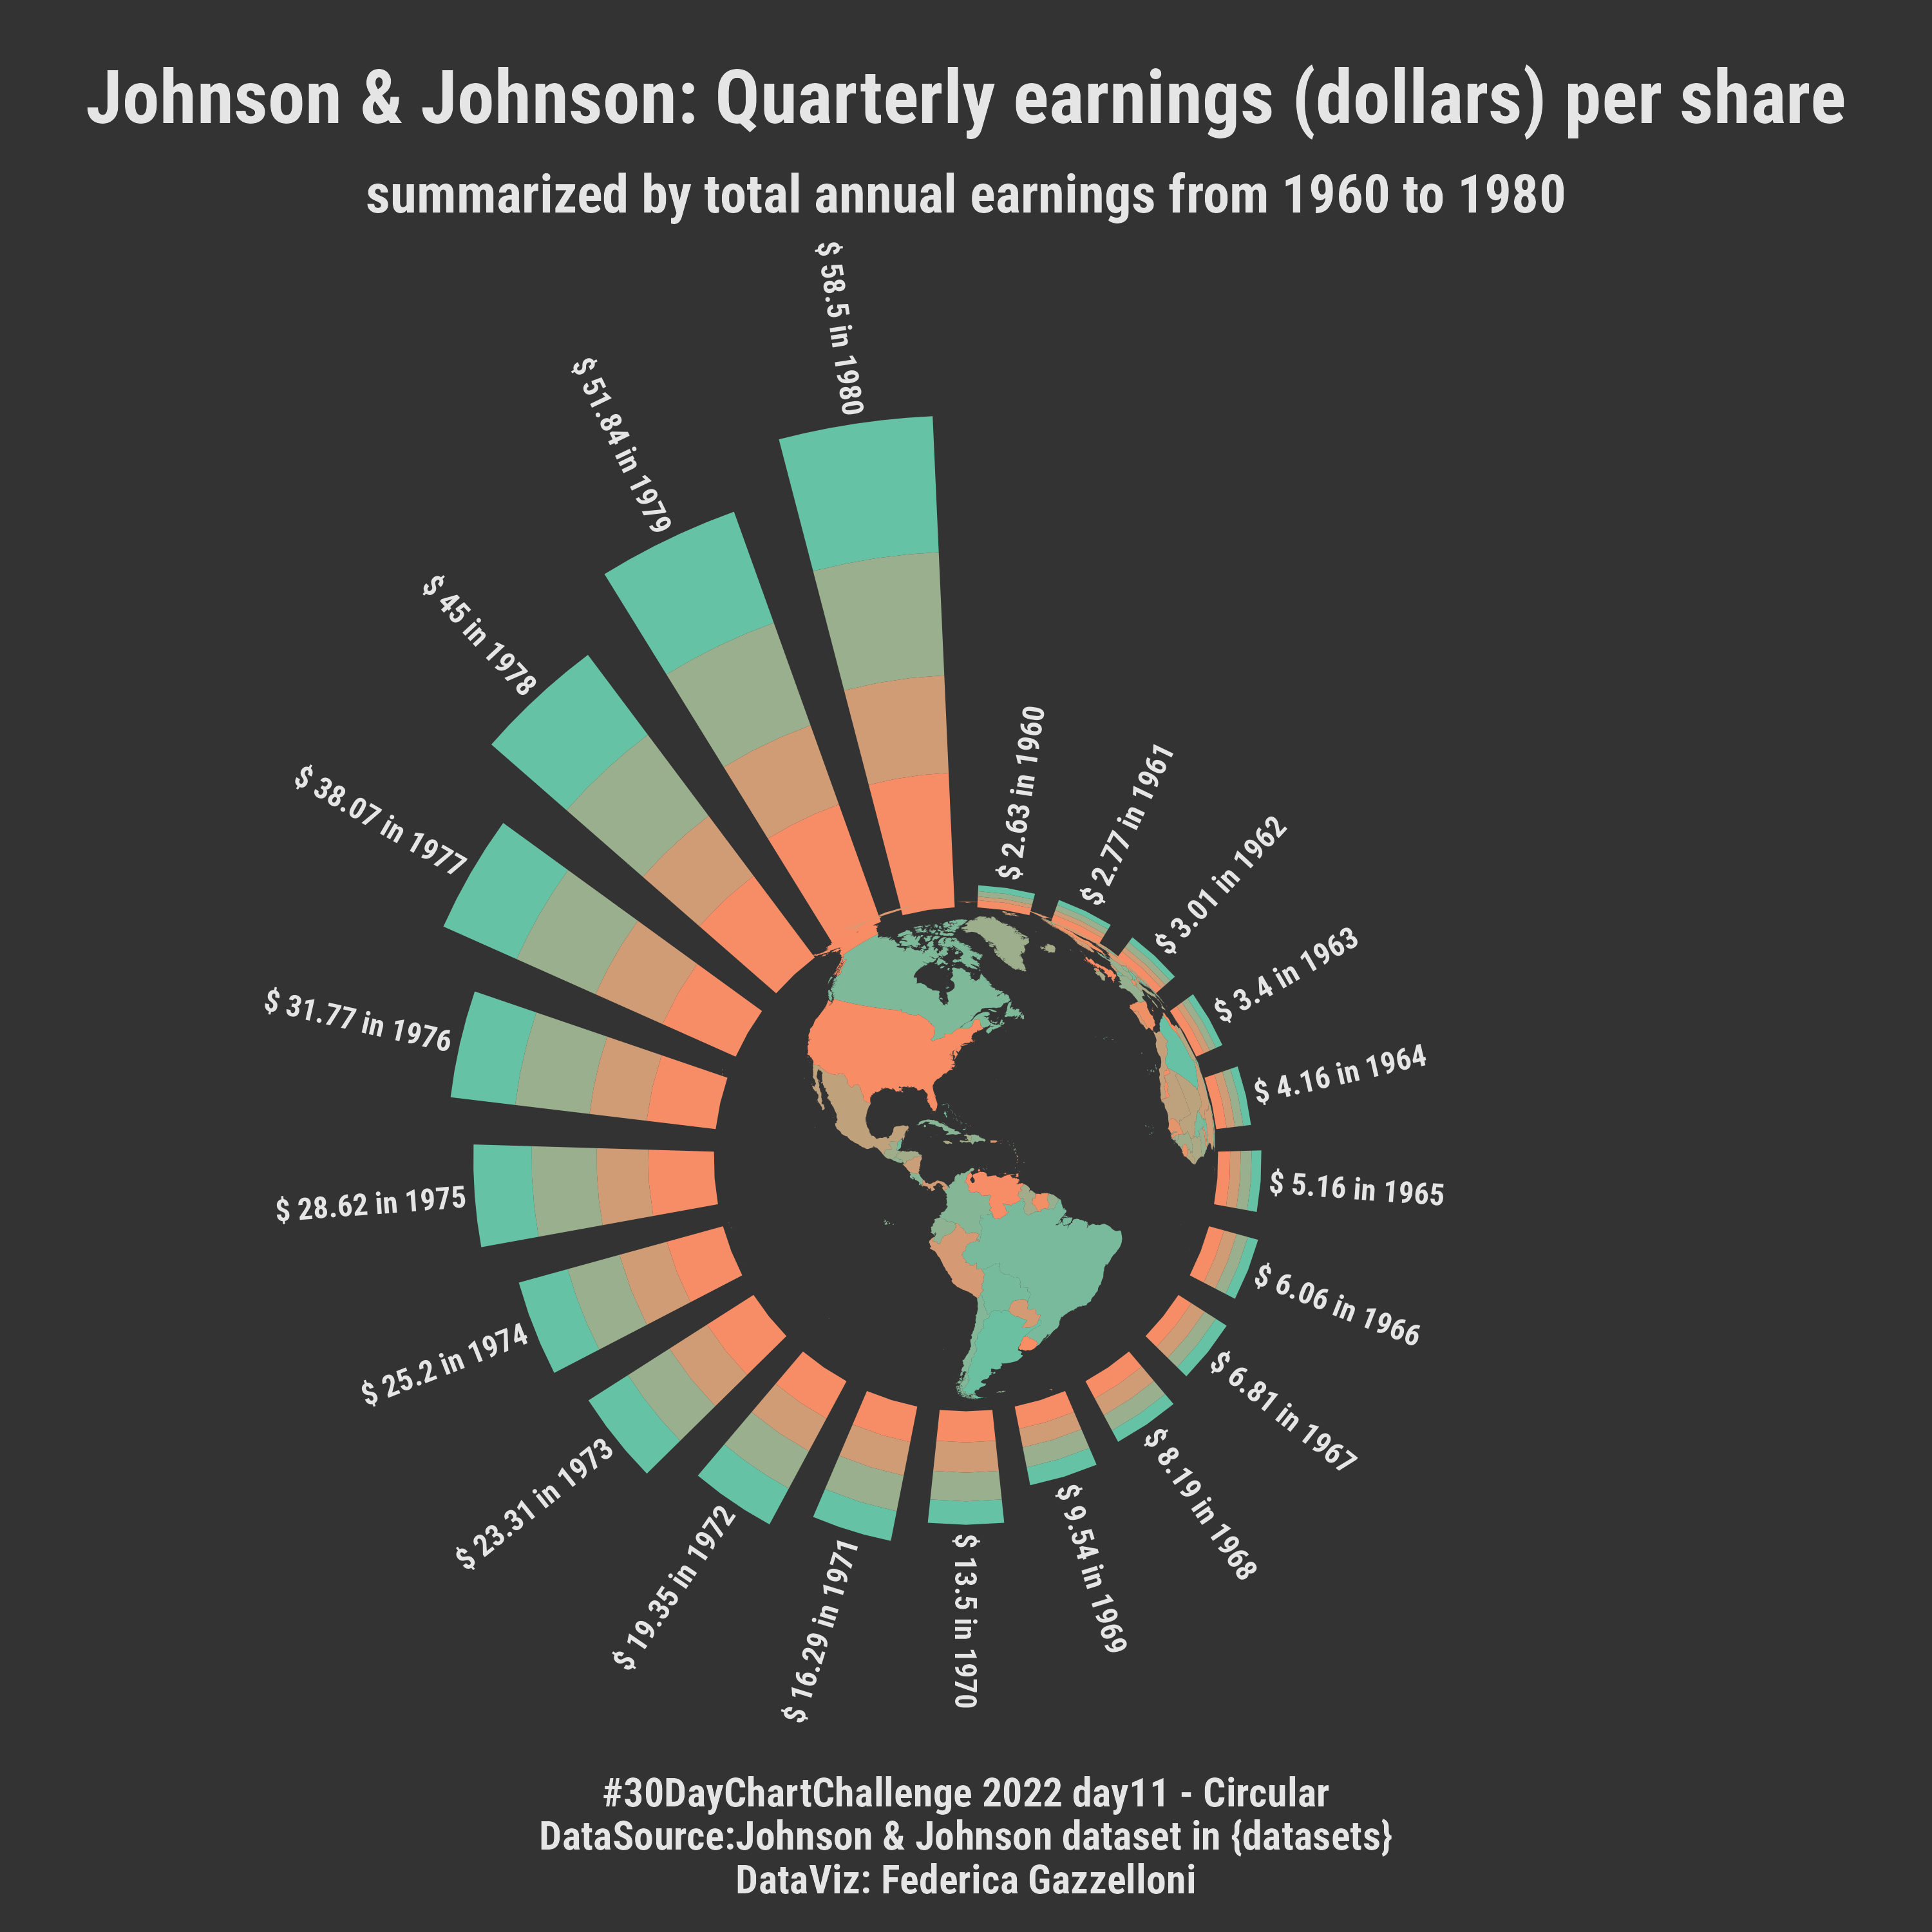
A circular bar chart of Johnson & Johnson quarterly earnings per share, with annual totals arranged around a world map.
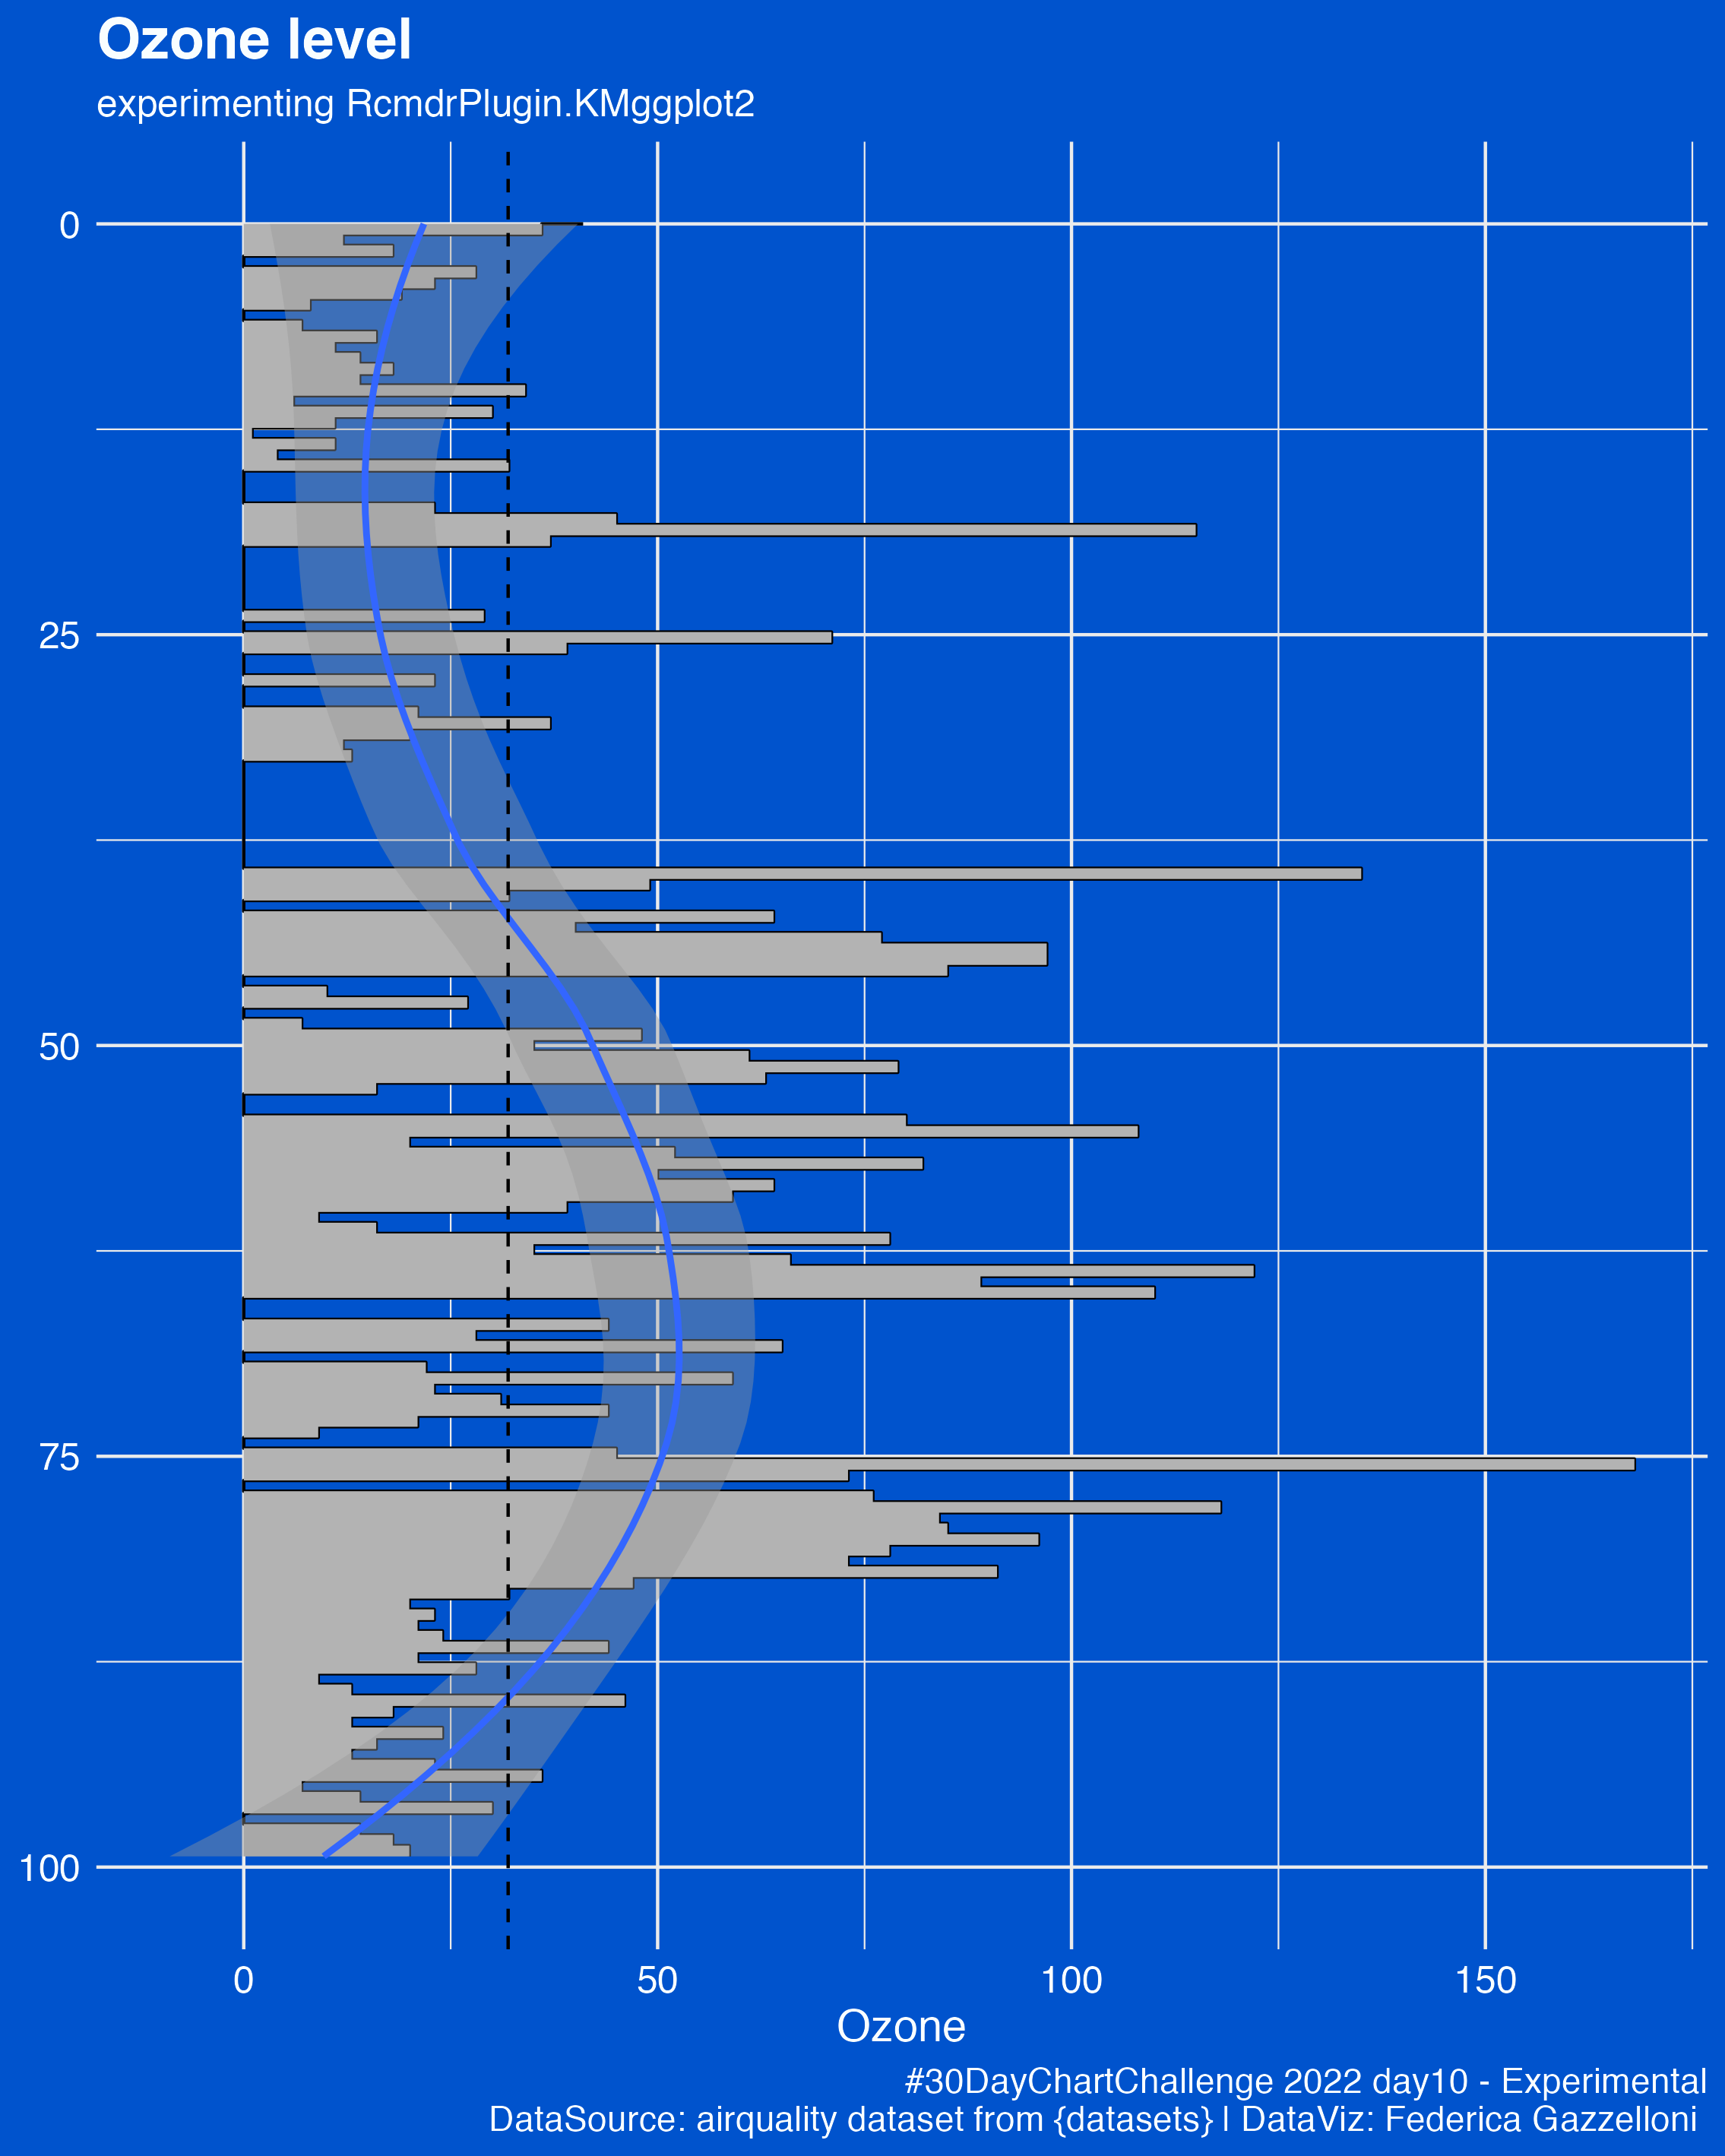
An experimental chart of ozone levels using the airquality dataset and RcmdrPlugin.KMggplot2.
A normalized comparison of wage distributions by education from 2003 to 2009 using the ISLR2 Wage dataset.
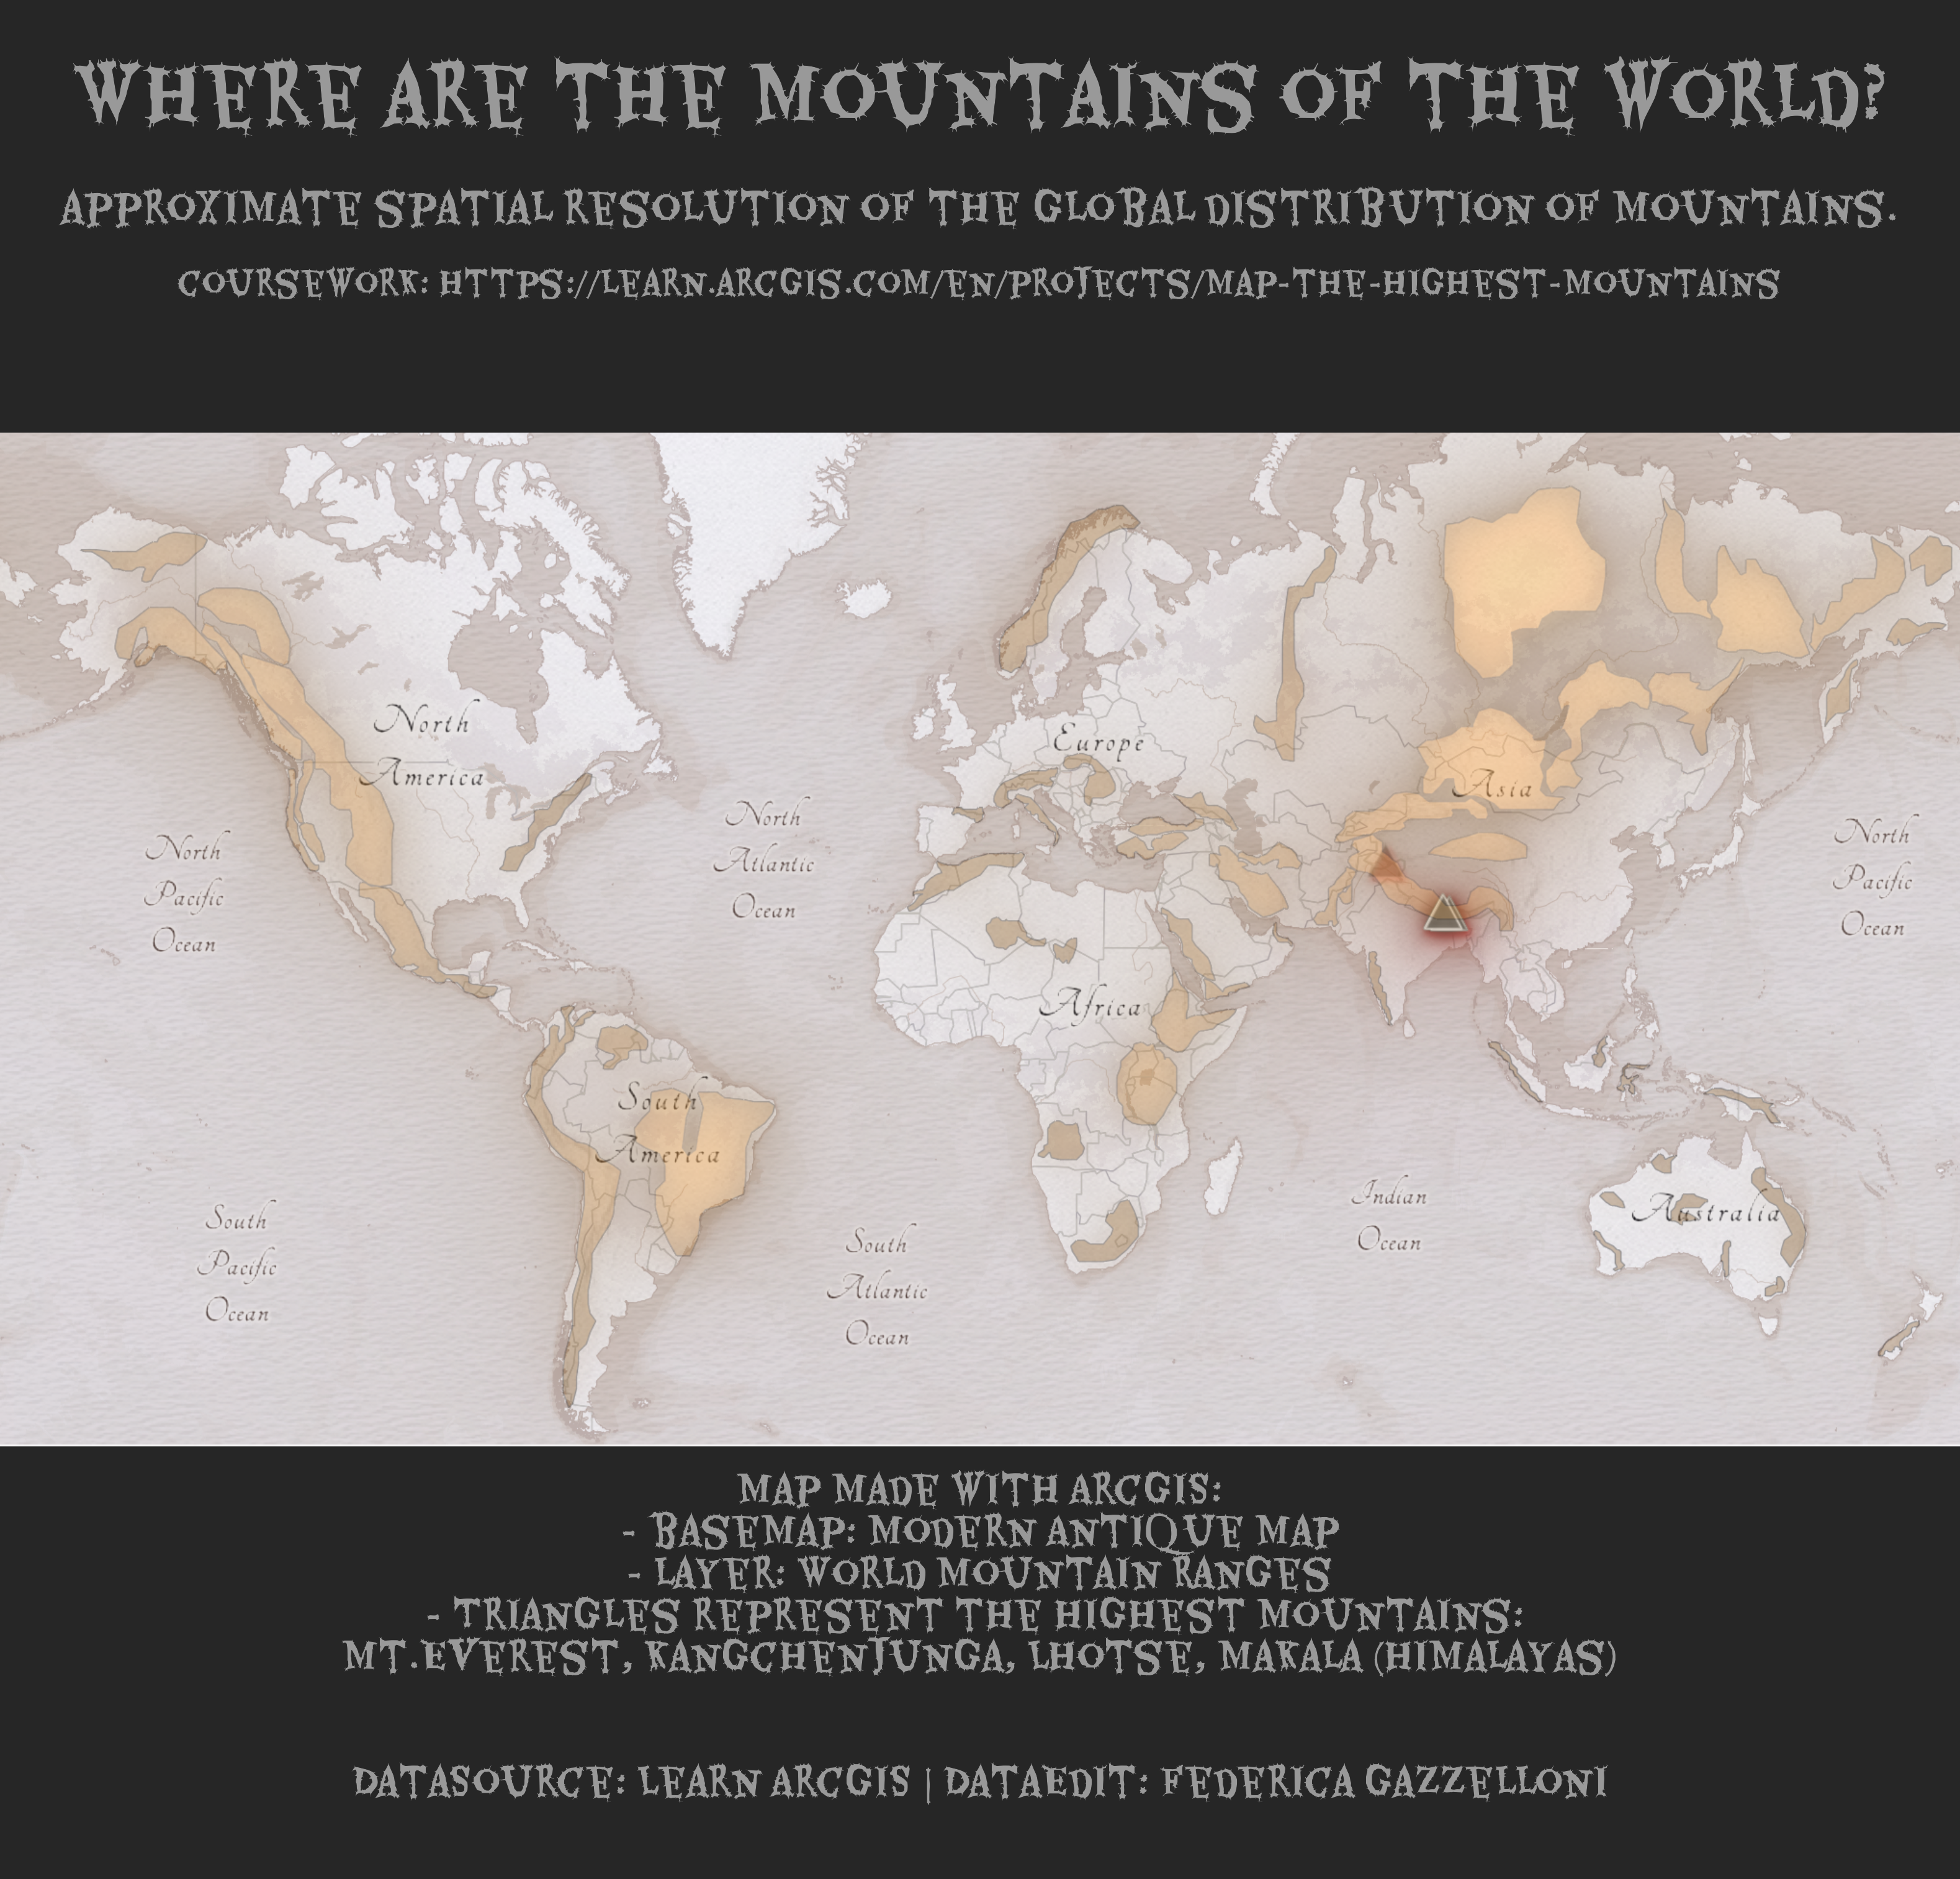
A world map locating the highest mountain peaks, including Everest and other Himalayan summits.
Physical: this could be anything related to physical activity, physical space, physical distance, physical health, etc.
Data day
Slope
Flora: IRIS dataset petal length and width
Historical: Visualizations that use historical data or have a historical theme.
Pictogram: The dataset used is from Statista and it contains information about accidental deaths in Sweden in 2020, by
Part to whole: The dataset used is from the TidyTuesday project and it contains information about college sports participation in the US from 2015 to 2019.