TidyTuesday 2021
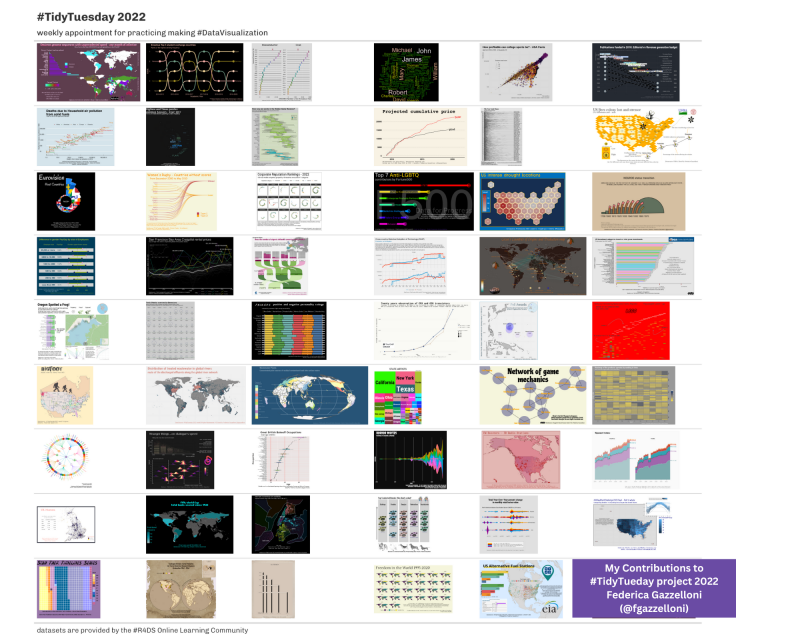
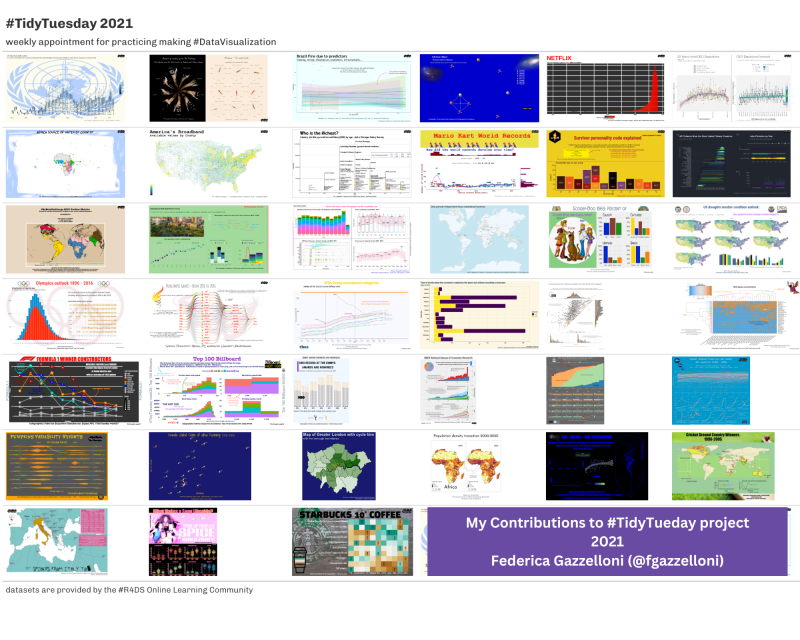
A collage and index of weekly data visualizations created with the 2021 TidyTuesday datasets.
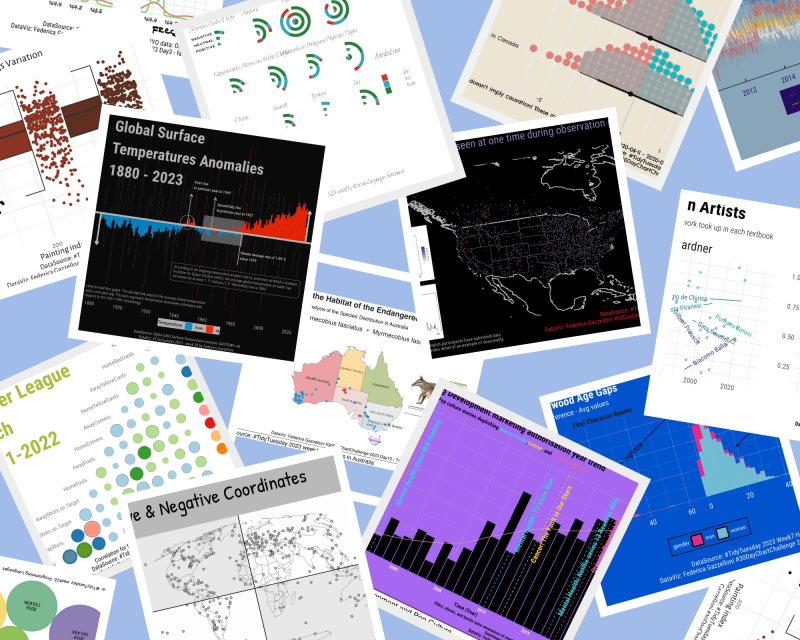
Here, I share a collection of Data Visualizations that I’ve made using R. The project is called #TidyTuesday and it is taken every week on Tuesday. Each week a new set of data is released which will brings a new chart, revealing different aspects of our world through data visualization. It’s a creative journey that transforms numbers and information into eye-catching maps.
Explore this collection with me as we dive into different types of data that tell unique stories.