library(tidyverse)
library(igraph)
library(ggraph)
library(RColorBrewer)
theme_set(silgelib::theme_roboto())Overview
For the first day of the #30DayChartChallenge 2022 the theme is “Part to whole”.
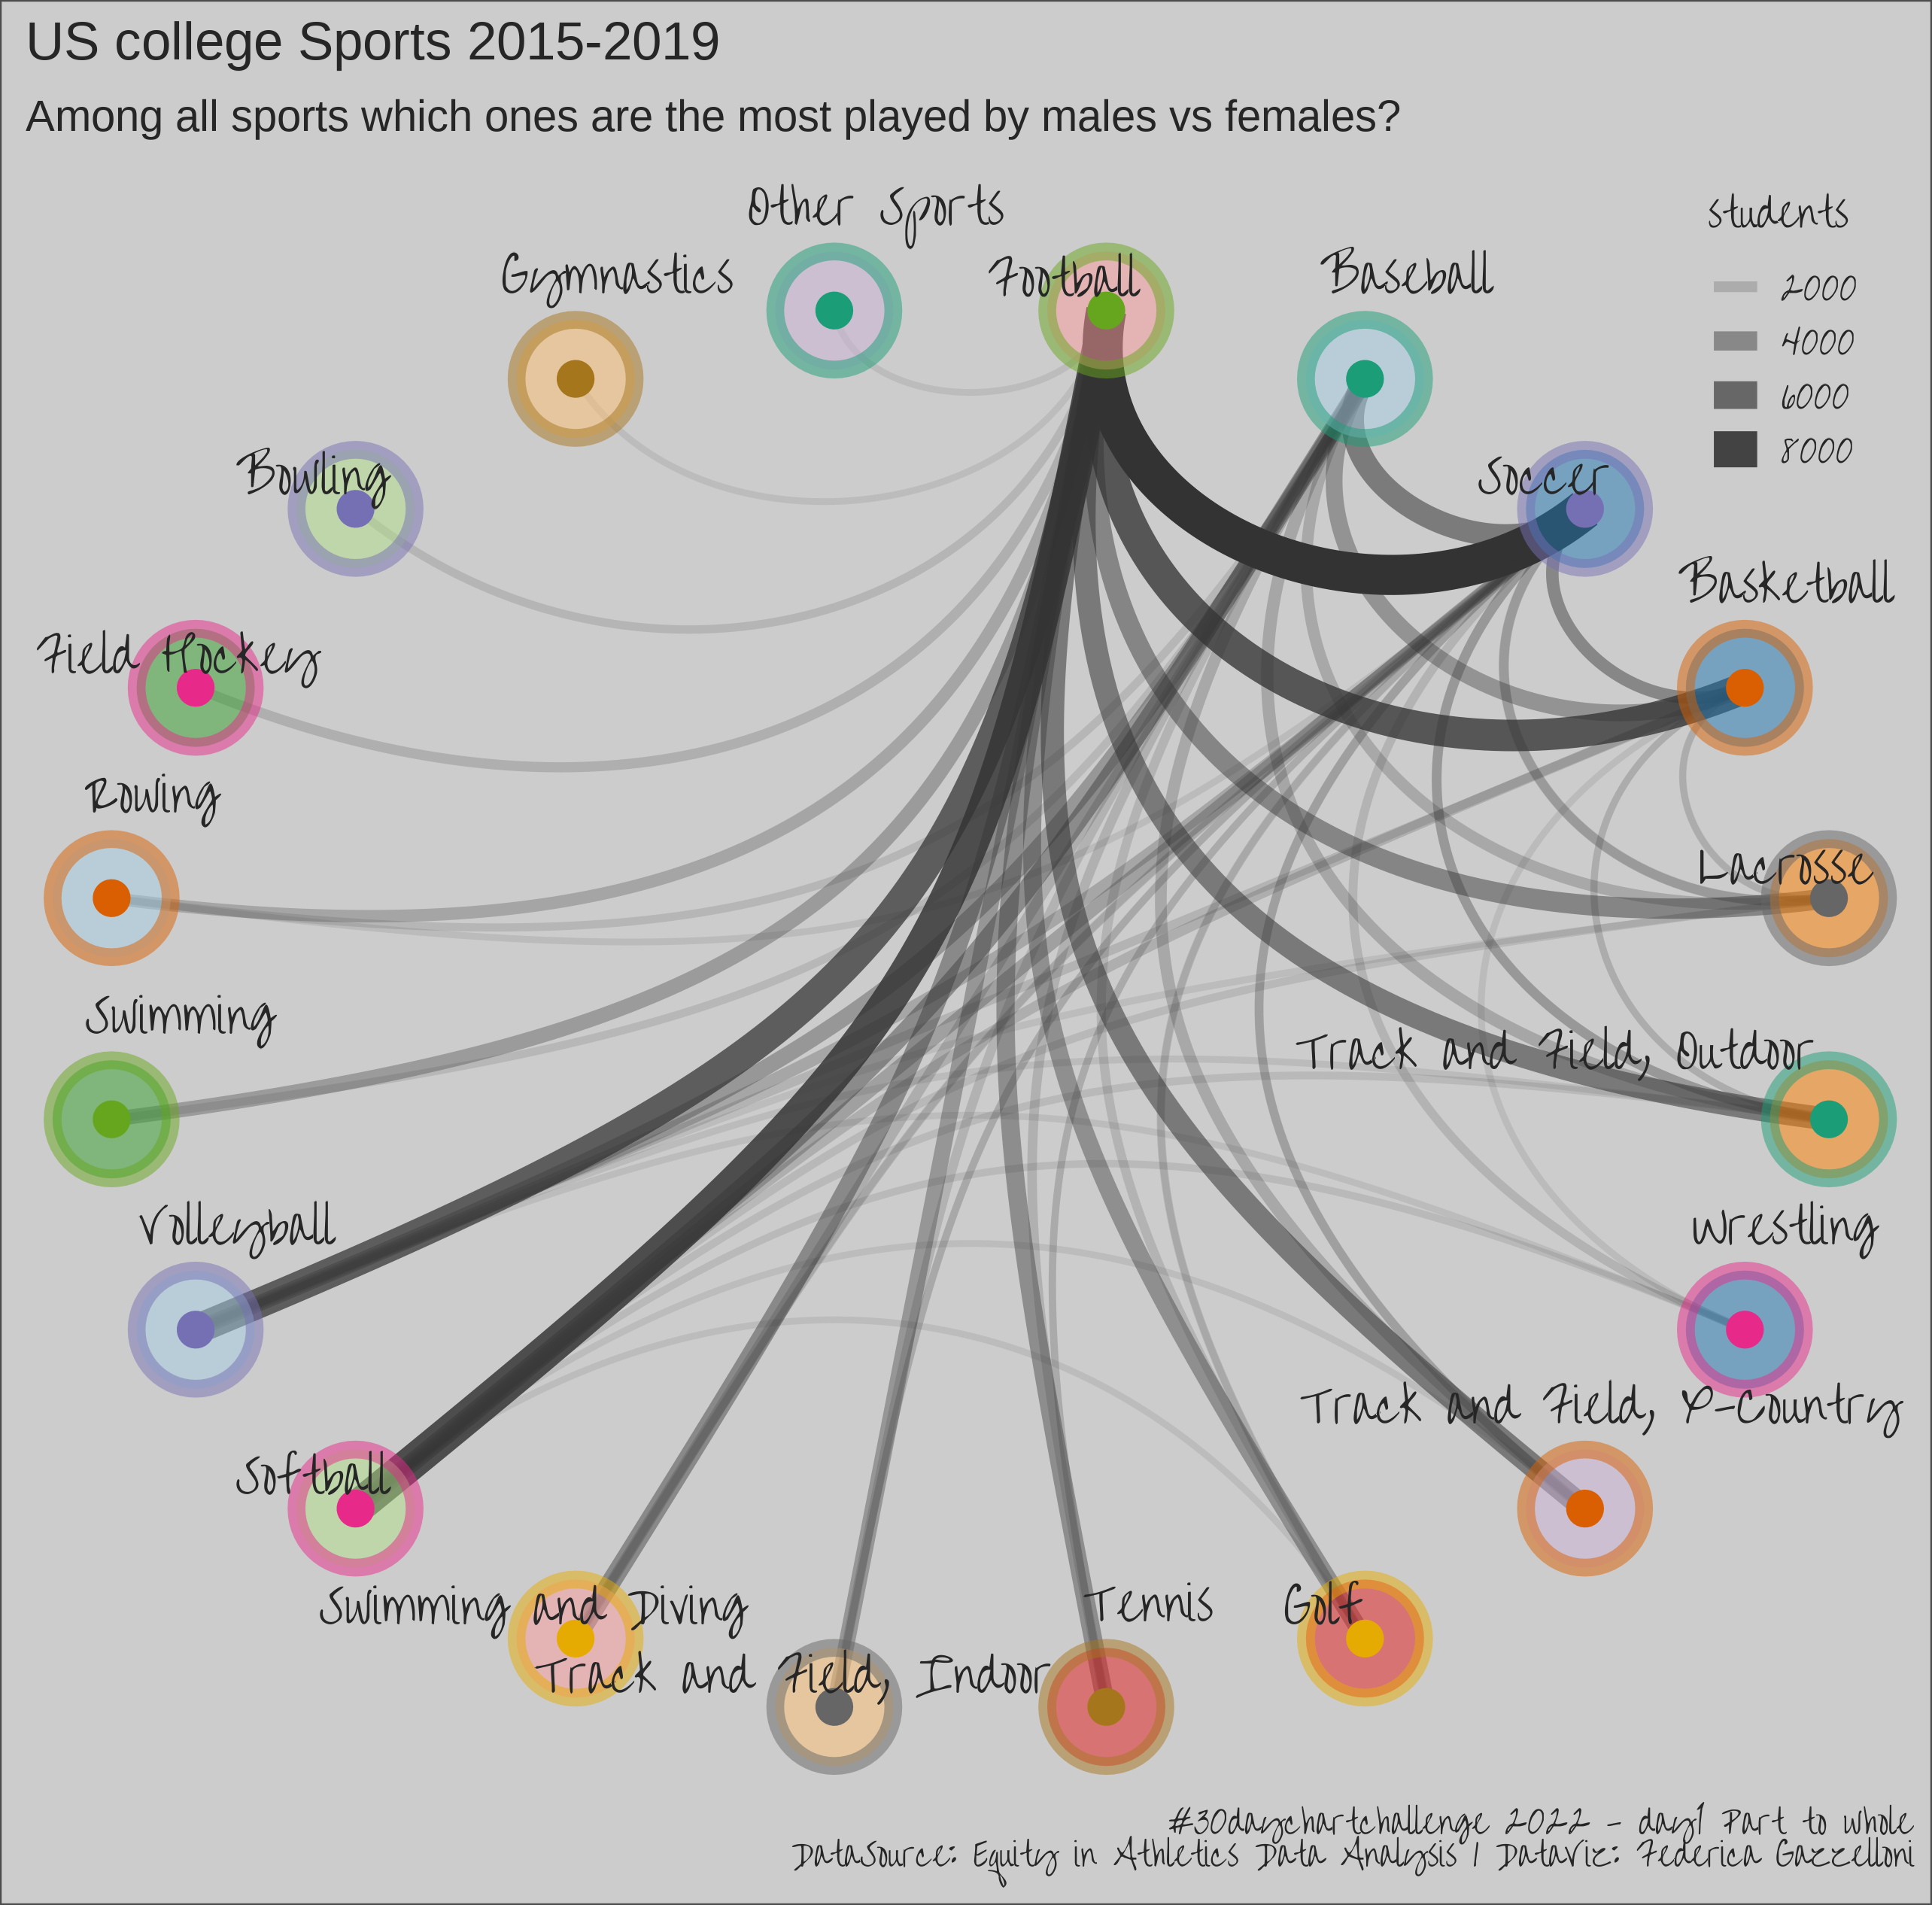
sports <- readr::read_csv('https://raw.githubusercontent.com/rfordatascience/tidytuesday/master/data/2022/2022-03-29/sports.csv')

sports <- sports %>%
  filter(!sports=="All Track Combined")

men <- sports %>%
  select(year,state_cd,men_sports=sports,partic_men) %>%
  drop_na()

women <- sports %>%
  select(year,state_cd,women_sports=sports,partic_women) %>%
  drop_na()
df <- men %>%
left_join(women,by=c("year","state_cd")) %>%
distinct()
df1 <- df %>%
mutate(students=partic_men+partic_women) %>%
count(men_sports,women_sports,
wt= students,
name="students",
sort=T) %>%
mutate(students=students/1000) %>%
filter(students>1000) %>%
graph_from_data_frame(directed = FALSE)Set the Fonts
library(showtext)
library(sysfonts)
library(extrafont)

showtext::showtext_auto()
showtext::showtext_opts(dpi=320)
font_add_google(name="Over the Rainbow",family="overtherainbow")set.seed(0104)
df1 %>%
ggraph(layout = "linear", circular = TRUE) +
geom_edge_arc(aes(edge_alpha = students,
edge_width = students),
color = "grey20") +
geom_node_point(aes(fill=name,color=name),
size=15,
stroke=4,
shape=21,
alpha=0.5,
show.legend = F) +
geom_node_point(aes(color=name),size=5,show.legend = F) +
geom_node_text(mapping = aes(label = name),
position = position_nudge(y = 0.1),
#position = position_dodge(width = 0),
#position = position_jitter(seed = 111),
repel = TRUE,
color="grey15",
size=5,
family = "overtherainbow",
fontface="bold")+
scale_colour_manual(values= rep( brewer.pal(8,"Dark2") , 30)) +
scale_fill_manual(values= rep(brewer.pal(9,"Paired") , 30)) +
labs(title="US college Sports 2015-2019",
subtitle="Among all sports which ones are the most played by males vs females?",
caption="#30daychartchallenge 2022 - day1 Part to whole\nDataSource: Equity in Athletics Data Analysis | DataViz: Federica Gazzelloni")+
theme(text=element_text(color="grey15",size=12,family="overtherainbow"),
plot.background = element_rect(color="grey30",fill="grey80"),
legend.position = c(0.93,0.9))ggsave("day1_part_to_whole.png",width = 8.56, height = 8.44)