library(tidyverse)Overview
Today for day 5 of the #30DayChartChallenge2022 the theme is “Slope”.
I decided to use the Digital Publications dataset from Project Oasis to compare the editorial budget vs revenue generation budget of the publications founded in 2010. The slope chart shows how much budget is allocated to editorial activities compared to revenue generation activities for each publication. Each publication is represented by a line connecting two points: one for the editorial budget and another for the revenue generation budget. The logos of the publications are added to enhance visual appeal and provide context.
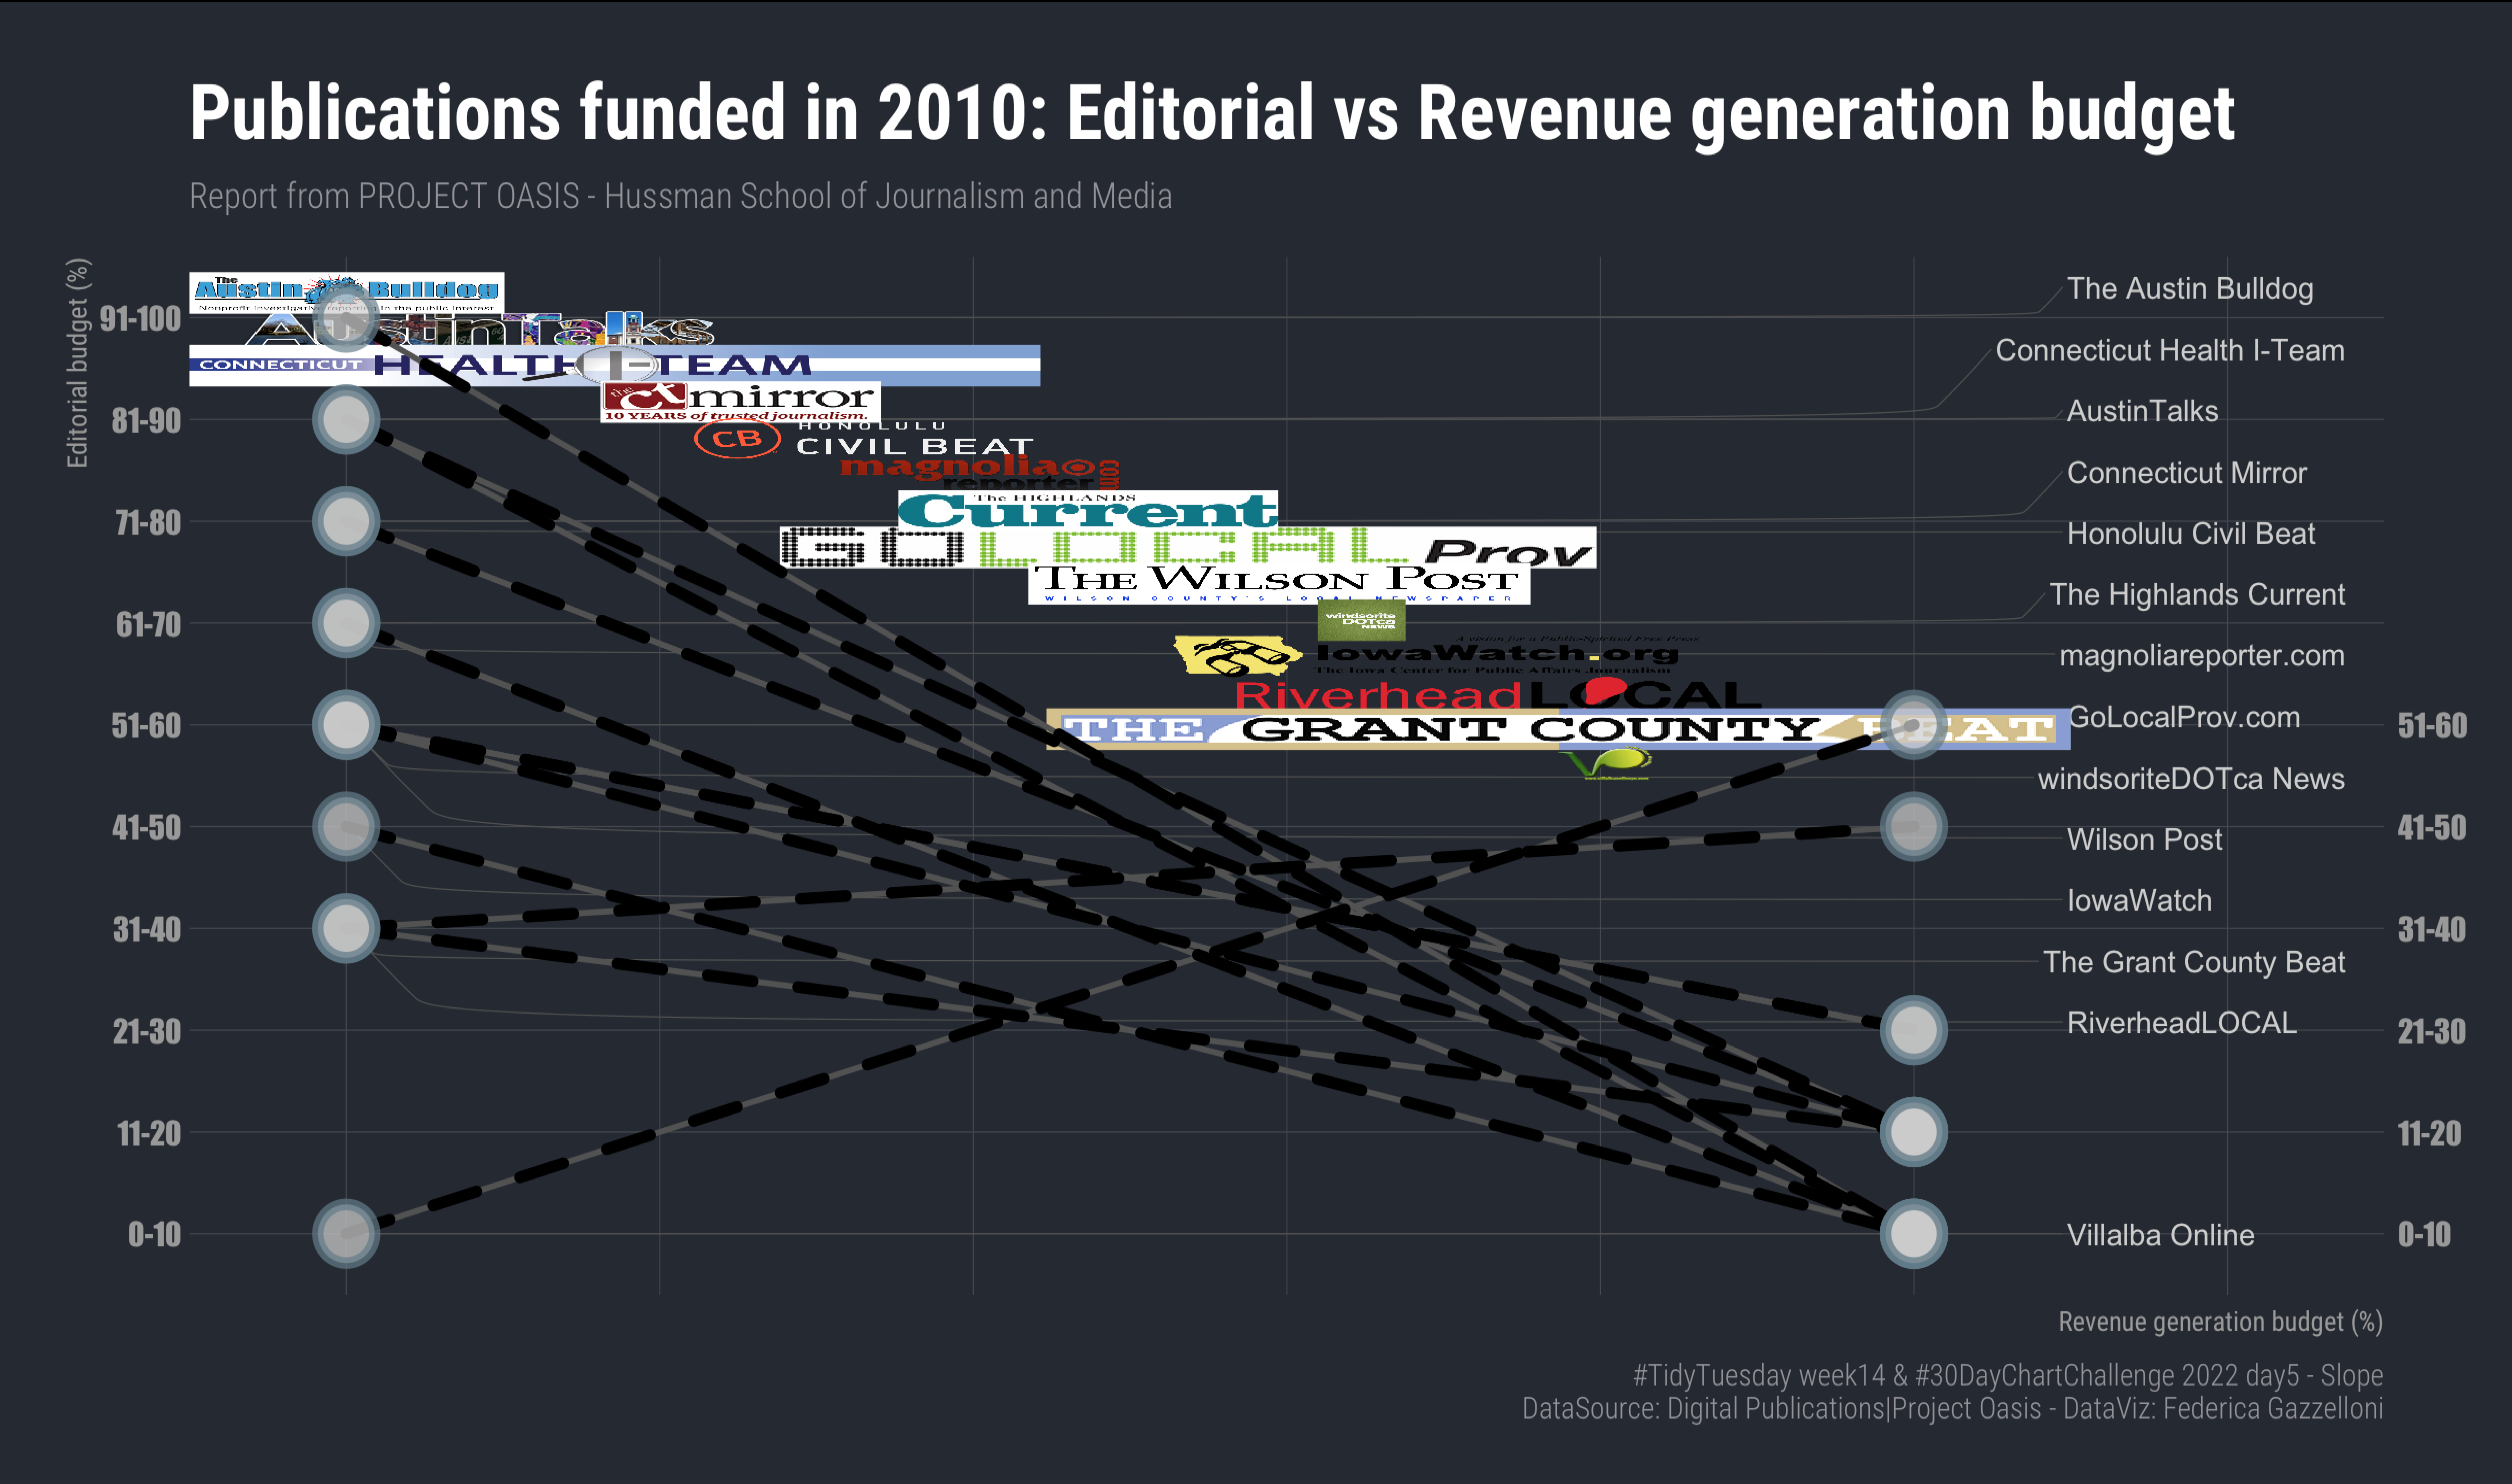
#load data
news_orgs <- readr::read_csv('https://raw.githubusercontent.com/rfordatascience/tidytuesday/master/data/2022/2022-04-05/news_orgs.csv')

#news_orgs %>% head(50)%>% View

#news_orgs%>% count(year_founded)library(extrafont)
loadfonts()
library(showtext)
#sysfonts::font_add_google("Public Sans","publicsans")df <- news_orgs %>%
select(publication_name,year_founded,budget_percent_editorial,budget_percent_revenue_generation) %>%
drop_na() %>%
arrange(budget_percent_editorial) %>% #count(year_founded) %>% View
filter(!budget_percent_editorial==budget_percent_revenue_generation,
year_founded==2010)
df2 <- df %>%
arrange(desc(budget_percent_editorial)) %>%
mutate(photo=gsub(" ","",publication_name),.after=publication_name,
photo=tolower(photo),
photo=paste0("data/2022/w14_digital_pub/",photo,".png"))library(hrbrthemes)
library(ggbump)
library(ggh4x)
library(ggimage)df2 %>%
ggplot(aes(x=0,xend=1,
y=budget_percent_editorial,yend=budget_percent_revenue_generation,
group=factor(publication_name))) +
ggrepel::geom_text_repel(aes(x=0,label=publication_name),
color="grey80",
direction = "y", hjust = "left",
min.segment.length = 0,
nudge_x = 1.1,
box.padding = 0.5,
nudge_y = 0,
segment.color="grey32",
segment.curvature = -0.1,
segment.ncp = 3,
segment.angle = 20,
segment.size = 0.2)+
geom_image(aes(x=rev(seq(0,1.2,0.08571429)),
y=seq(1,10,0.6785714),
image=rev(photo)),
alpha=0.6,size=0.04,
nudge_y = 0.1,by="height")+
geom_segment(size=1) +
geom_point(size=8,shape=21,stroke=3)+
geom_point(aes(x=1,y=budget_percent_revenue_generation),size=8,shape=21,stroke=3) +
labs(title="Publications funded in 2010: Editorial vs Revenue generation budget",
subtitle="Report from PROJECT OASIS - Hussman School of Journalism and Media",
caption="#TidyTuesday week14 & #30DayChartChallenge 2022 day5 - Slope
DataSource: Digital Publications|Project Oasis - DataViz: Federica Gazzelloni",
x="Revenue generation budget (%)",
y="Editorial budget (%)") +
guides(y.sec = guide_axis_manual(labels = c("0-10","11-20","21-30","31-40","41-50","51-60","","","","")))+
scale_x_continuous(expand = c(0,0),limits=c(-0.1,1.3))+
hrbrthemes::theme_ft_rc()+
theme(text = element_text(),
axis.text.x = element_blank(),
plot.title = element_text(size=28),
plot.caption = element_text(size=11),
axis.title.x = element_text(size=10),
axis.title.y = element_text(size=10))ggsave("w14_digital_publications.png",
width = 12, height = 8,
dpi=320)
dev.off()Second version:
library(sigmoid)

z <- rev(seq(0,1.2,0.08571429))
df2 %>%
ggplot(aes(x=0,xend=1,
y=budget_percent_editorial,yend=budget_percent_revenue_generation,
group=factor(publication_name))) +
ggrepel::geom_text_repel(aes(x=0,label=publication_name),
color="grey80",
direction = "y", hjust = "left",
min.segment.length = 0,
nudge_x = 1.11,
box.padding = 0.5,
nudge_y = 0,
segment.color="grey32",
segment.curvature = -0.1,
segment.ncp = 3,
segment.angle = 20,
segment.size = 0.2)+
geom_image(aes(x=sigmoid(z, k=sd(z), x0=mean(z),
method="tanh",
SoftMax = F
),
y=seq(5.5,10.5,0.3571429),
image=rev(photo)),
size=0.04,nudge_y = 0.1,by="height")+
geom_segment(size=1,lineend = "round",color="grey32") +
geom_segment(size=2,lineend = "round",linetype="dashed") +
geom_point(size=8,shape=21,stroke=3,fill="grey80",alpha=0.7)+
geom_point(aes(x=1,y=budget_percent_revenue_generation),
size=8,shape=21,stroke=3,fill="grey80",alpha=0.7) +
labs(title="Publications funded in 2010: Editorial vs Revenue generation budget",
subtitle="Report from PROJECT OASIS - Hussman School of Journalism and Media",
caption="#TidyTuesday week14 & #30DayChartChallenge 2022 day5 - Slope
DataSource: Digital Publications|Project Oasis - DataViz: Federica Gazzelloni",
x="Revenue generation budget (%)",
y="Editorial budget (%)") +
guides(y.sec = guide_axis_manual(labels = c("0-10","11-20","21-30","31-40","41-50","51-60","","","","")))+
scale_x_continuous(expand = c(0,0),limits=c(-0.1,1.3))+
hrbrthemes::theme_ft_rc()+
theme(text = element_text(color="grey40",family="Impact"),
axis.text.x = element_blank(),
axis.text.y = element_text(color="grey60"),
plot.title = element_text(size=28),
plot.caption = element_text(size=11),
axis.title.x = element_text(size=10,color="grey60"),
axis.title.y = element_text(size=10,color="grey60"))