library(tidyverse)
theme_set(theme_void())

rose2 <- function(k, size = 1, shift = 0, rotation = 0) {
  tibble(theta = seq(0, 24 * pi, length.out = 1000)) %>%
    mutate(r = size * cos(k * theta + rotation) + shift) %>%
    mutate(x = r * cos(theta),
           y = r * sin(theta))
}

colors <- RColorBrewer::brewer.pal(12,"Paired")

expand_grid(row = 1:5,
            column = 1:10) %>%
  mutate(id = column * max(row) + row) %>%

  # Randomize order of flowers, so they alter which ones are op top
  arrange(runif(nrow(.))) %>%


  # Randomize the parameters for the flowers
  mutate(k = sample(c(2, 3, 4, 5, 7, 3/2, 5/2, 7/2, 4/3, 5/3, 7/3, 7/4, 7/5),
                    nrow(.), replace = TRUE),

         size = rnorm(nrow(.), mean(iris$Petal.Width), sd(iris$Petal.Width)) + 1,
         rotation = runif(nrow(.), min(iris$Petal.Length), max(iris$Petal.Length) * pi),
         shift = runif(nrow(.), 0, mean(iris$Petal.Width)),
         color = sample(colors, nrow(.), replace = TRUE)) %>%

  # Place them evently on a grid, but jitter them a bit to liven it all up
  mutate(center_x = column * 5 + rnorm(nrow(.), 0, 1),
         center_y = row * 5 + rnorm(nrow(.), 0, 1),
         stem_x = column * 5 + runif(nrow(.), -5, 5),
         stem_y = -2 + rnorm(nrow(.), 0, 0.5)) %>%

  # Generate the flowers
  mutate(flower = pmap(list(k = k, size = size,
                            shift = shift,
                            rotation = rotation), rose2)) %>%
  unnest(flower) %>%

  # Now that we have unnest()'ed all points, we have way too many stems. Let's keep only one per flower
  group_by(id) %>%
  mutate(stem_x = ifelse(row_number() == 1, stem_x, NA),
         stem_y = ifelse(row_number() == 1, stem_y, NA)) %>%
  ungroup() %>%

  ggplot(aes(x + center_x, y + center_y, group = id)) +
  geom_curve(aes(x = center_x, y = center_y, xend = stem_x, yend = stem_y), curvature = 0.1, size = 0.2) +
  geom_polygon(aes(fill = color), color = 'black', size = 0.2) +
  coord_equal() +
  scale_fill_identity() +
  labs(title="#30DayChartChallenge 2022 - Day4 - Flora",
       subtitle="IRIS dataset petal length and width",
       caption="Source: Polar rose garden by @hnrklndbrg | DataViz: Federica Gazzelloni")+
  theme(plot.title = element_text(hjust=0.5),
        plot.subtitle = element_text(hjust=0.5),
plot.caption = element_text(hjust=0.5))Overview
For day 4 of the #30DayChartChallenge2022 the theme is “Flora”.
I decided to use the well known IRIS dataset and represent the petal length and width of the three species of iris flowers (setosa, versicolor and virginica) using polar rose curves. Each flower is represented by a rose curve where the petal length influences the rotation and the petal width the size of the flower. The flowers are placed on a grid with some random jitter to make it more lively. Stems are drawn from each flower to the bottom of the plot.
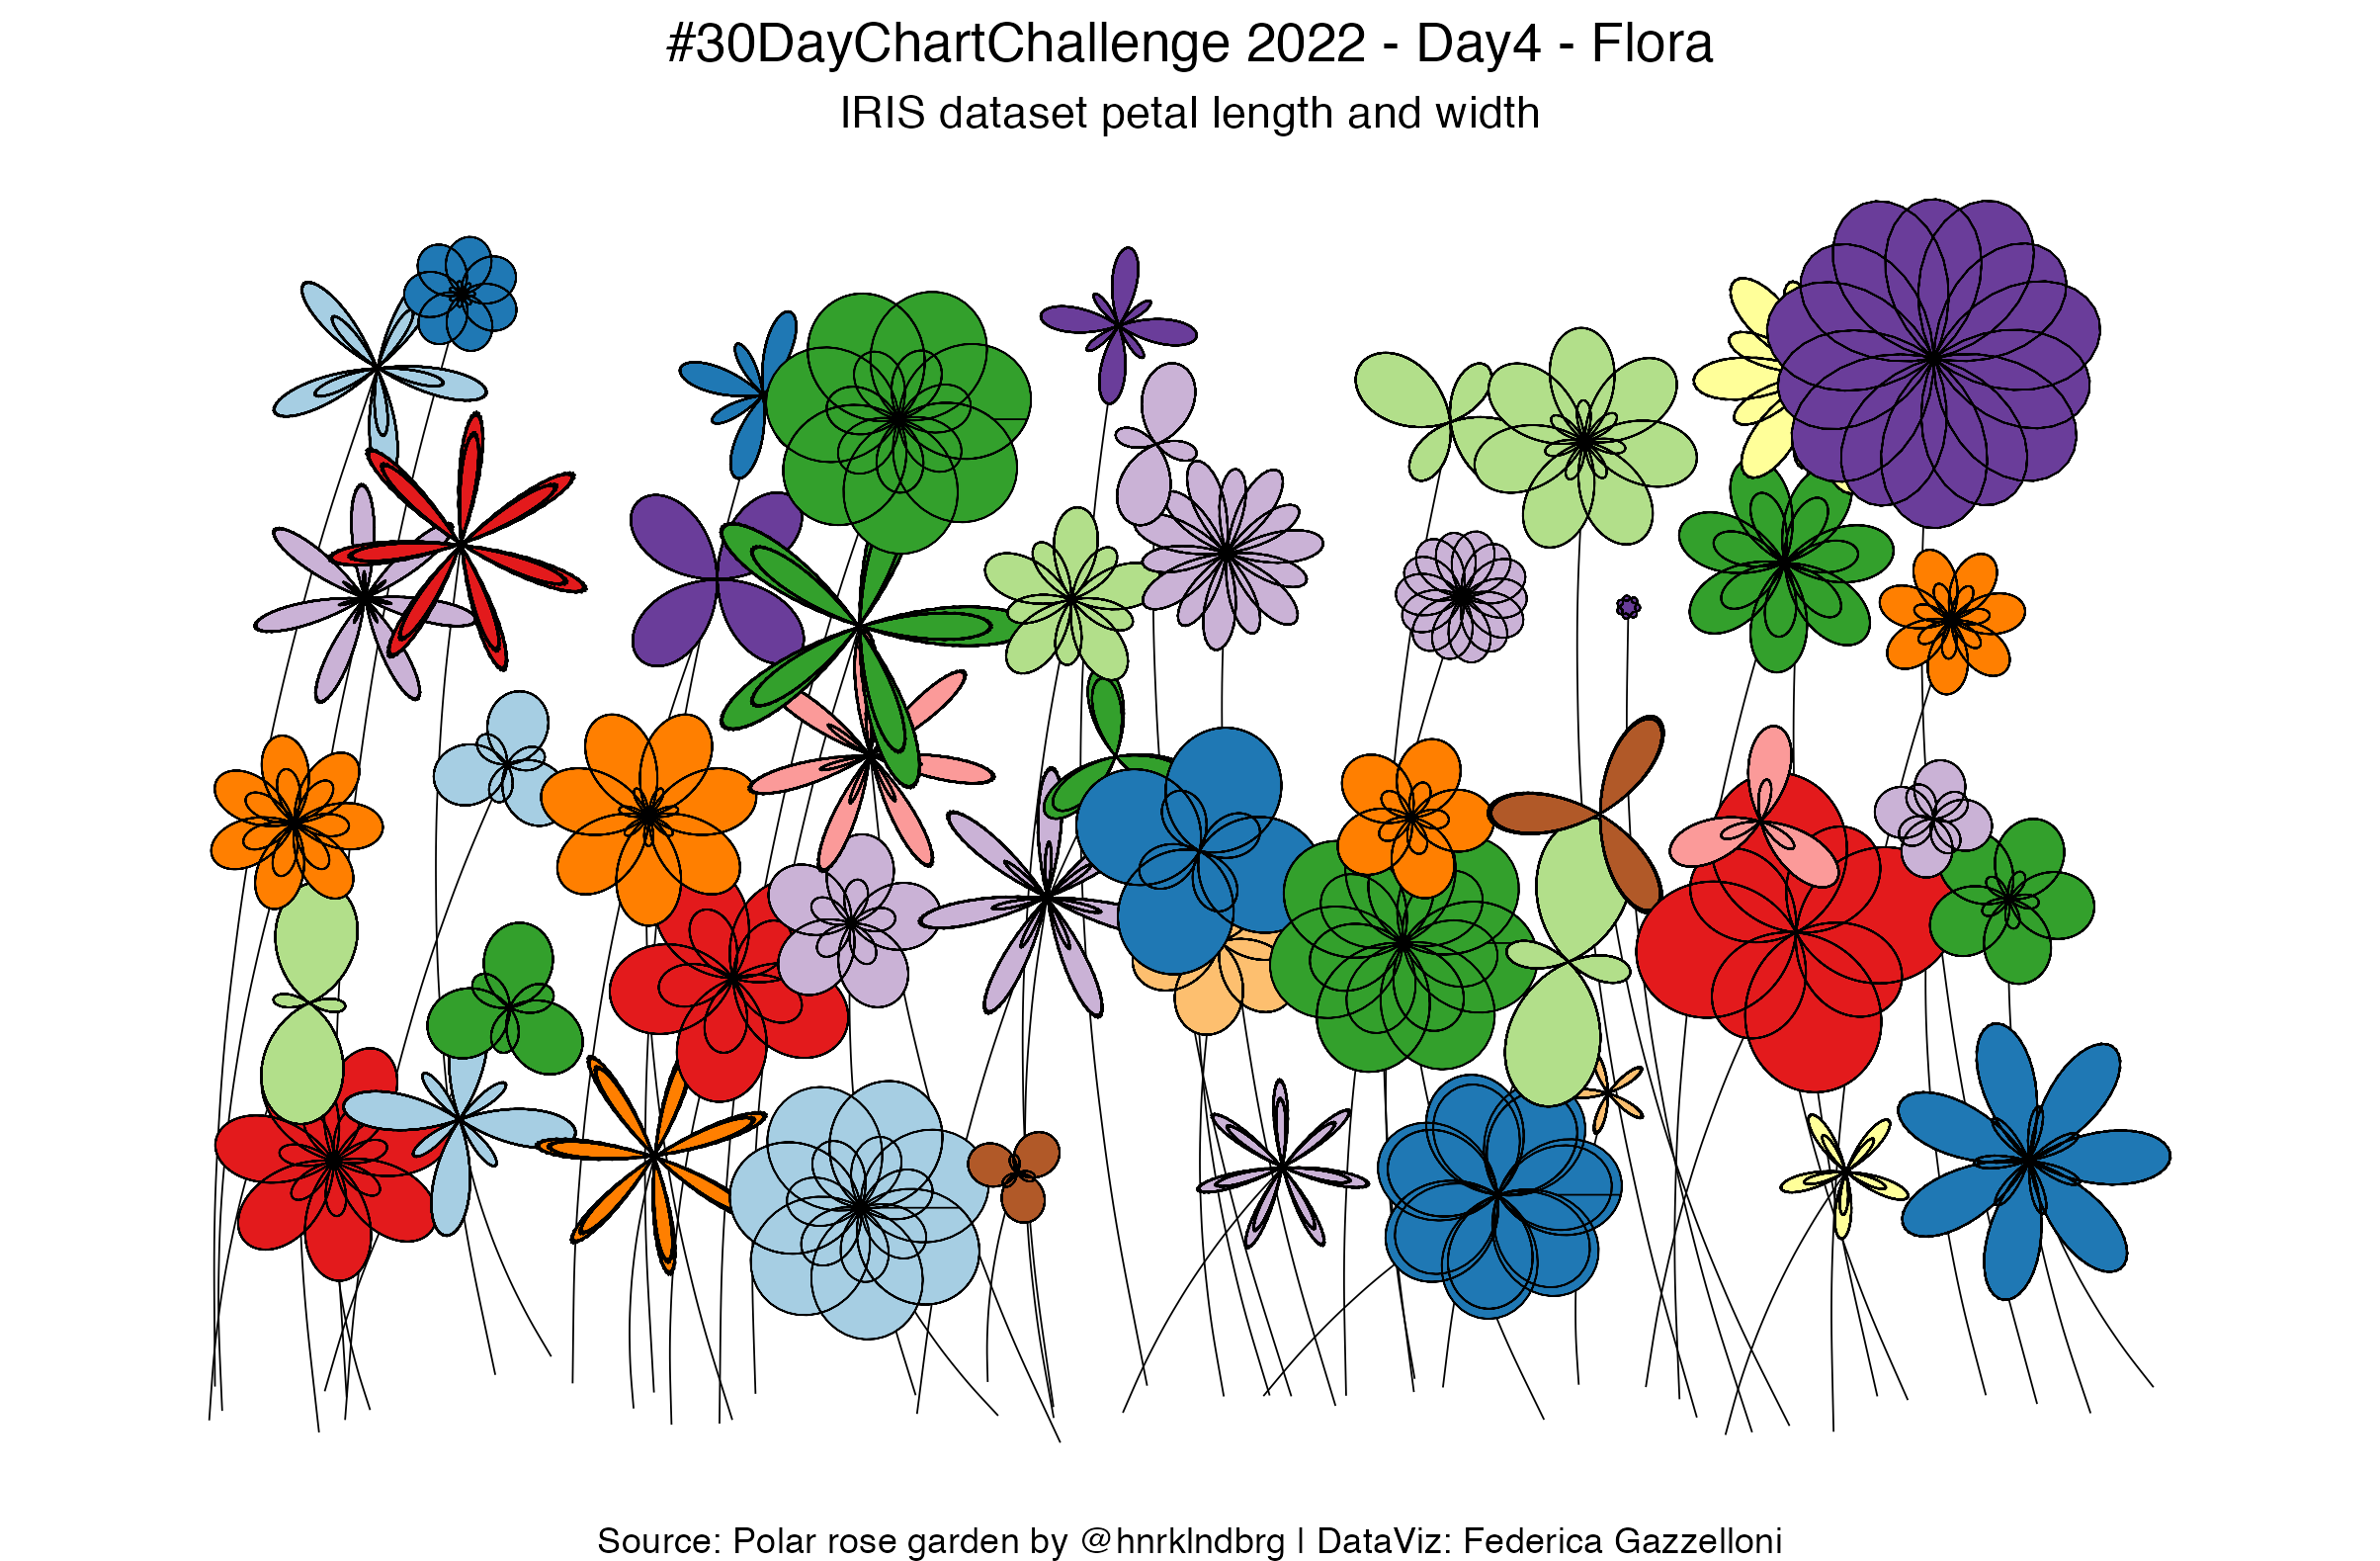
source: https://blog.k2h.se/post/polar-rose-garden/
ggsave("day4_flora.png")