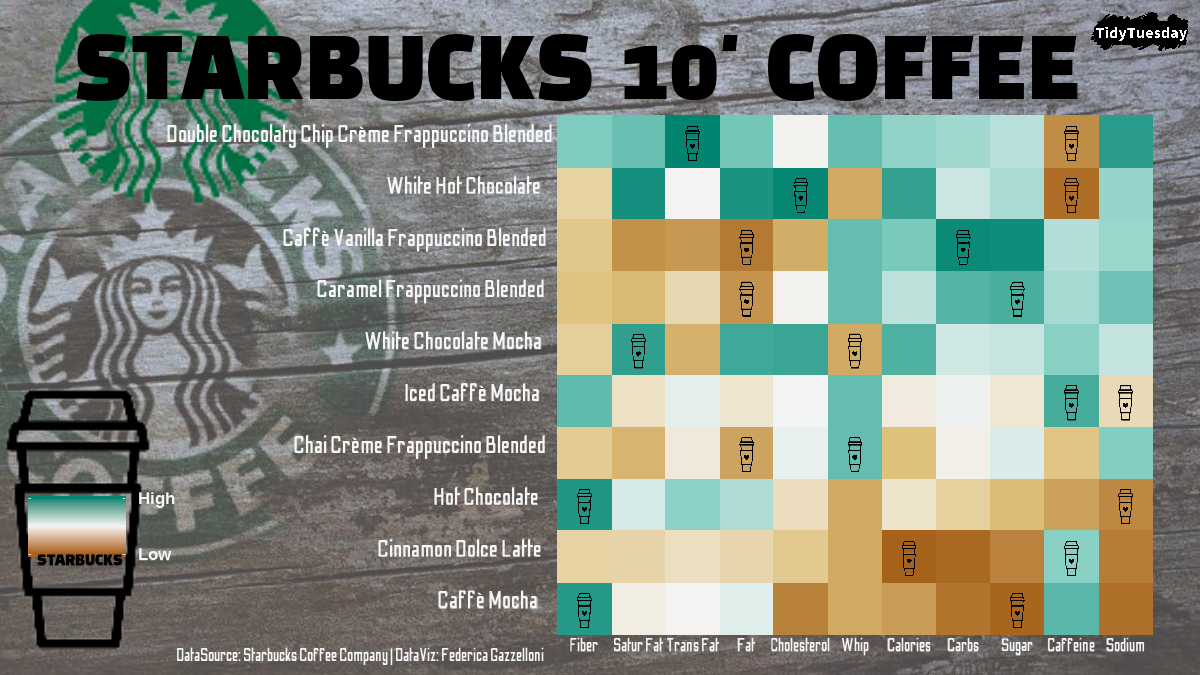
A comparison of Starbucks beverages and their characteristics from the TidyTuesday dataset.
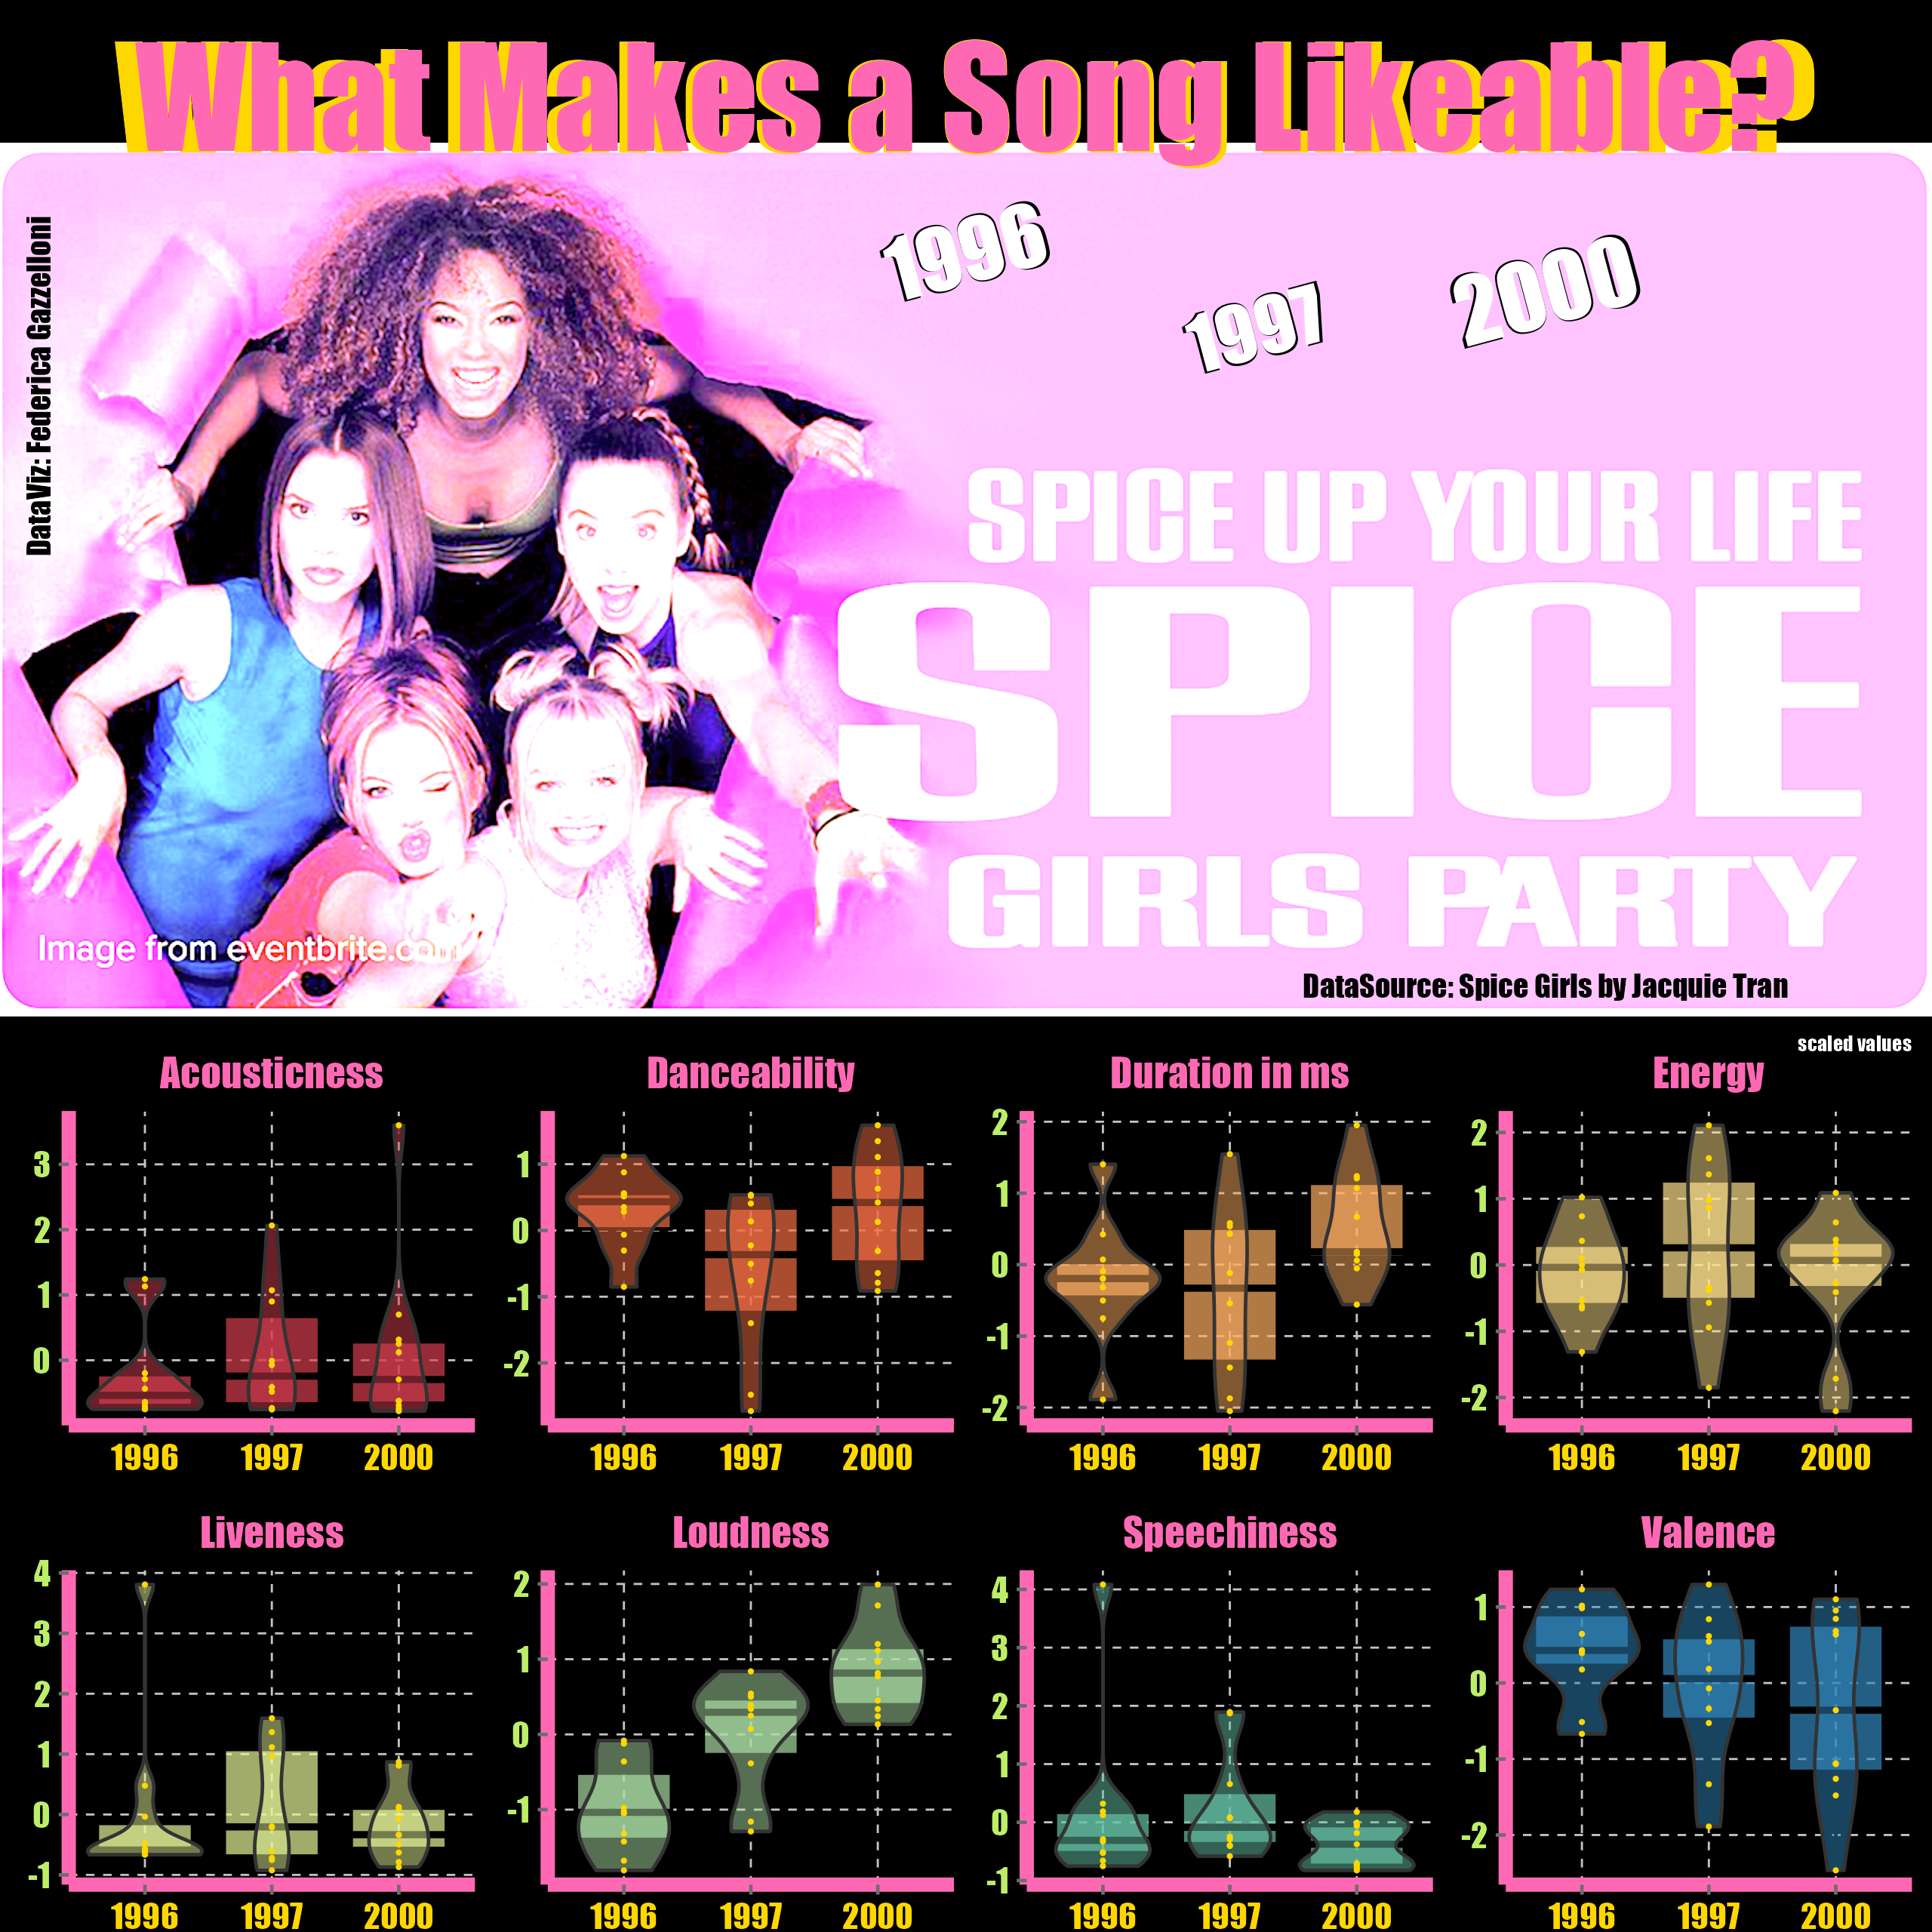
A visualization of Spice Girls songs and music data from the TidyTuesday dataset.
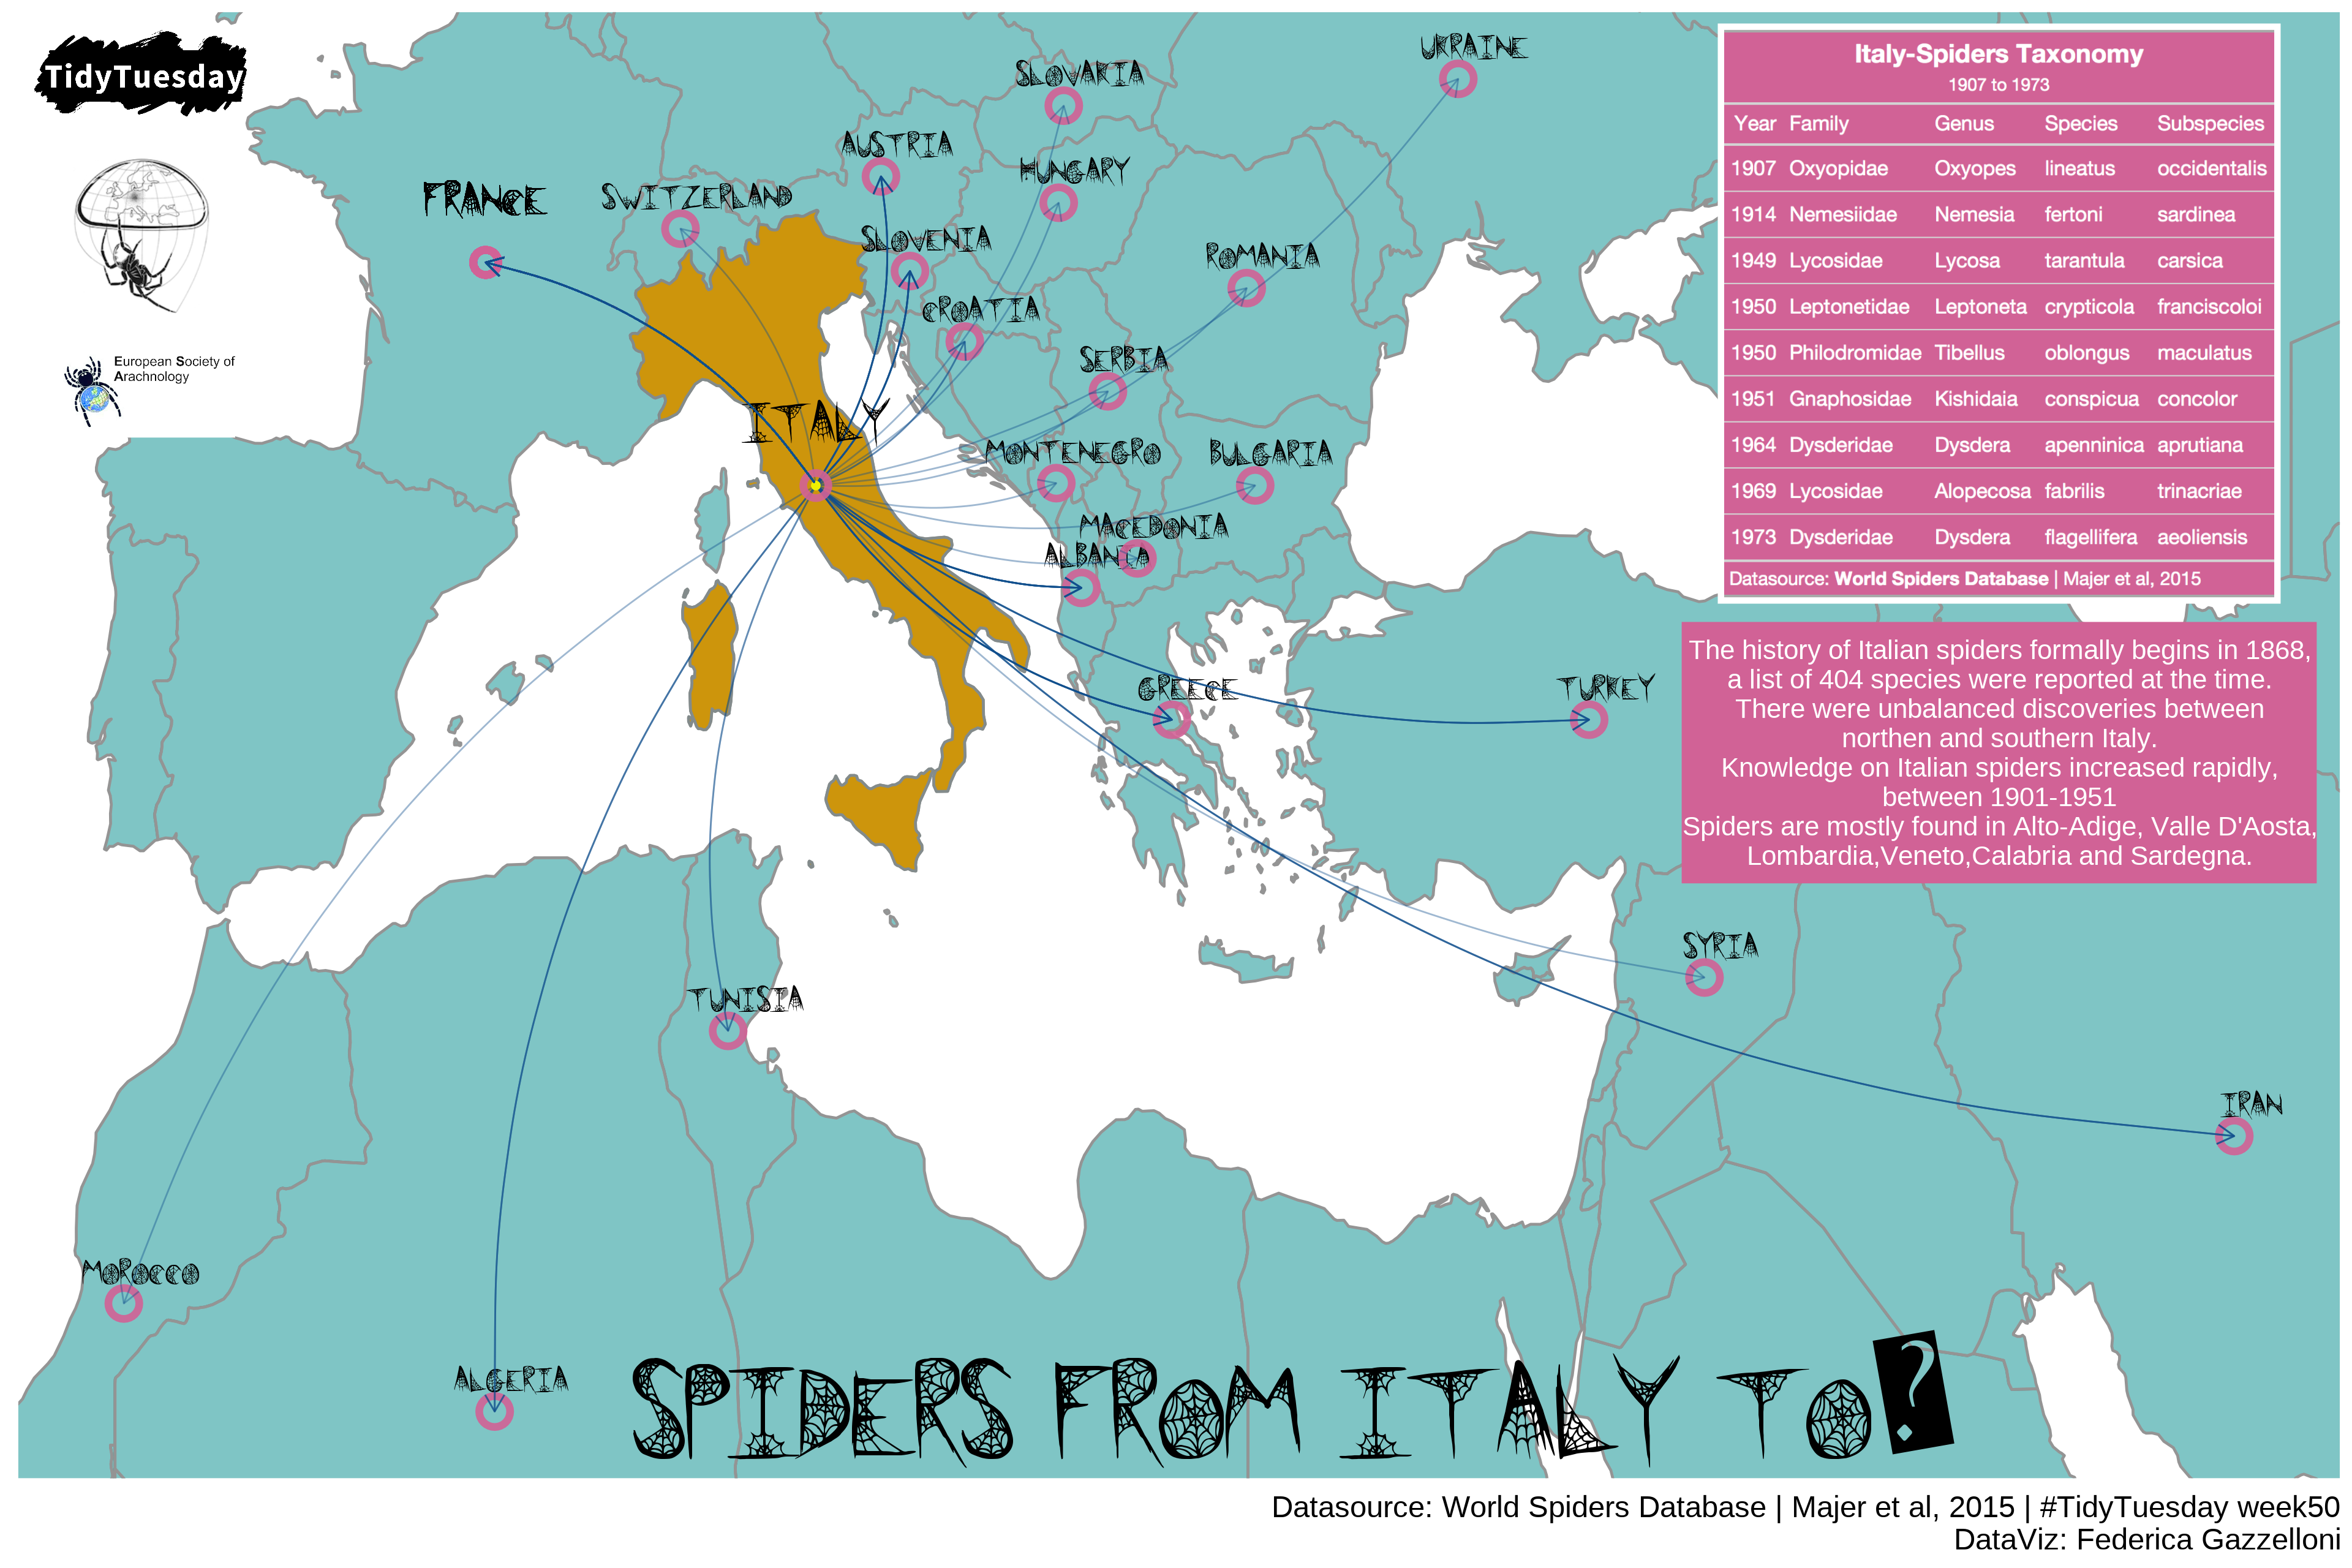
A visualization exploring spider observations and species in the TidyTuesday 2021 Week 50 dataset.
A visualization of World Cup Cricket matches, teams, and results from the TidyTuesday dataset.
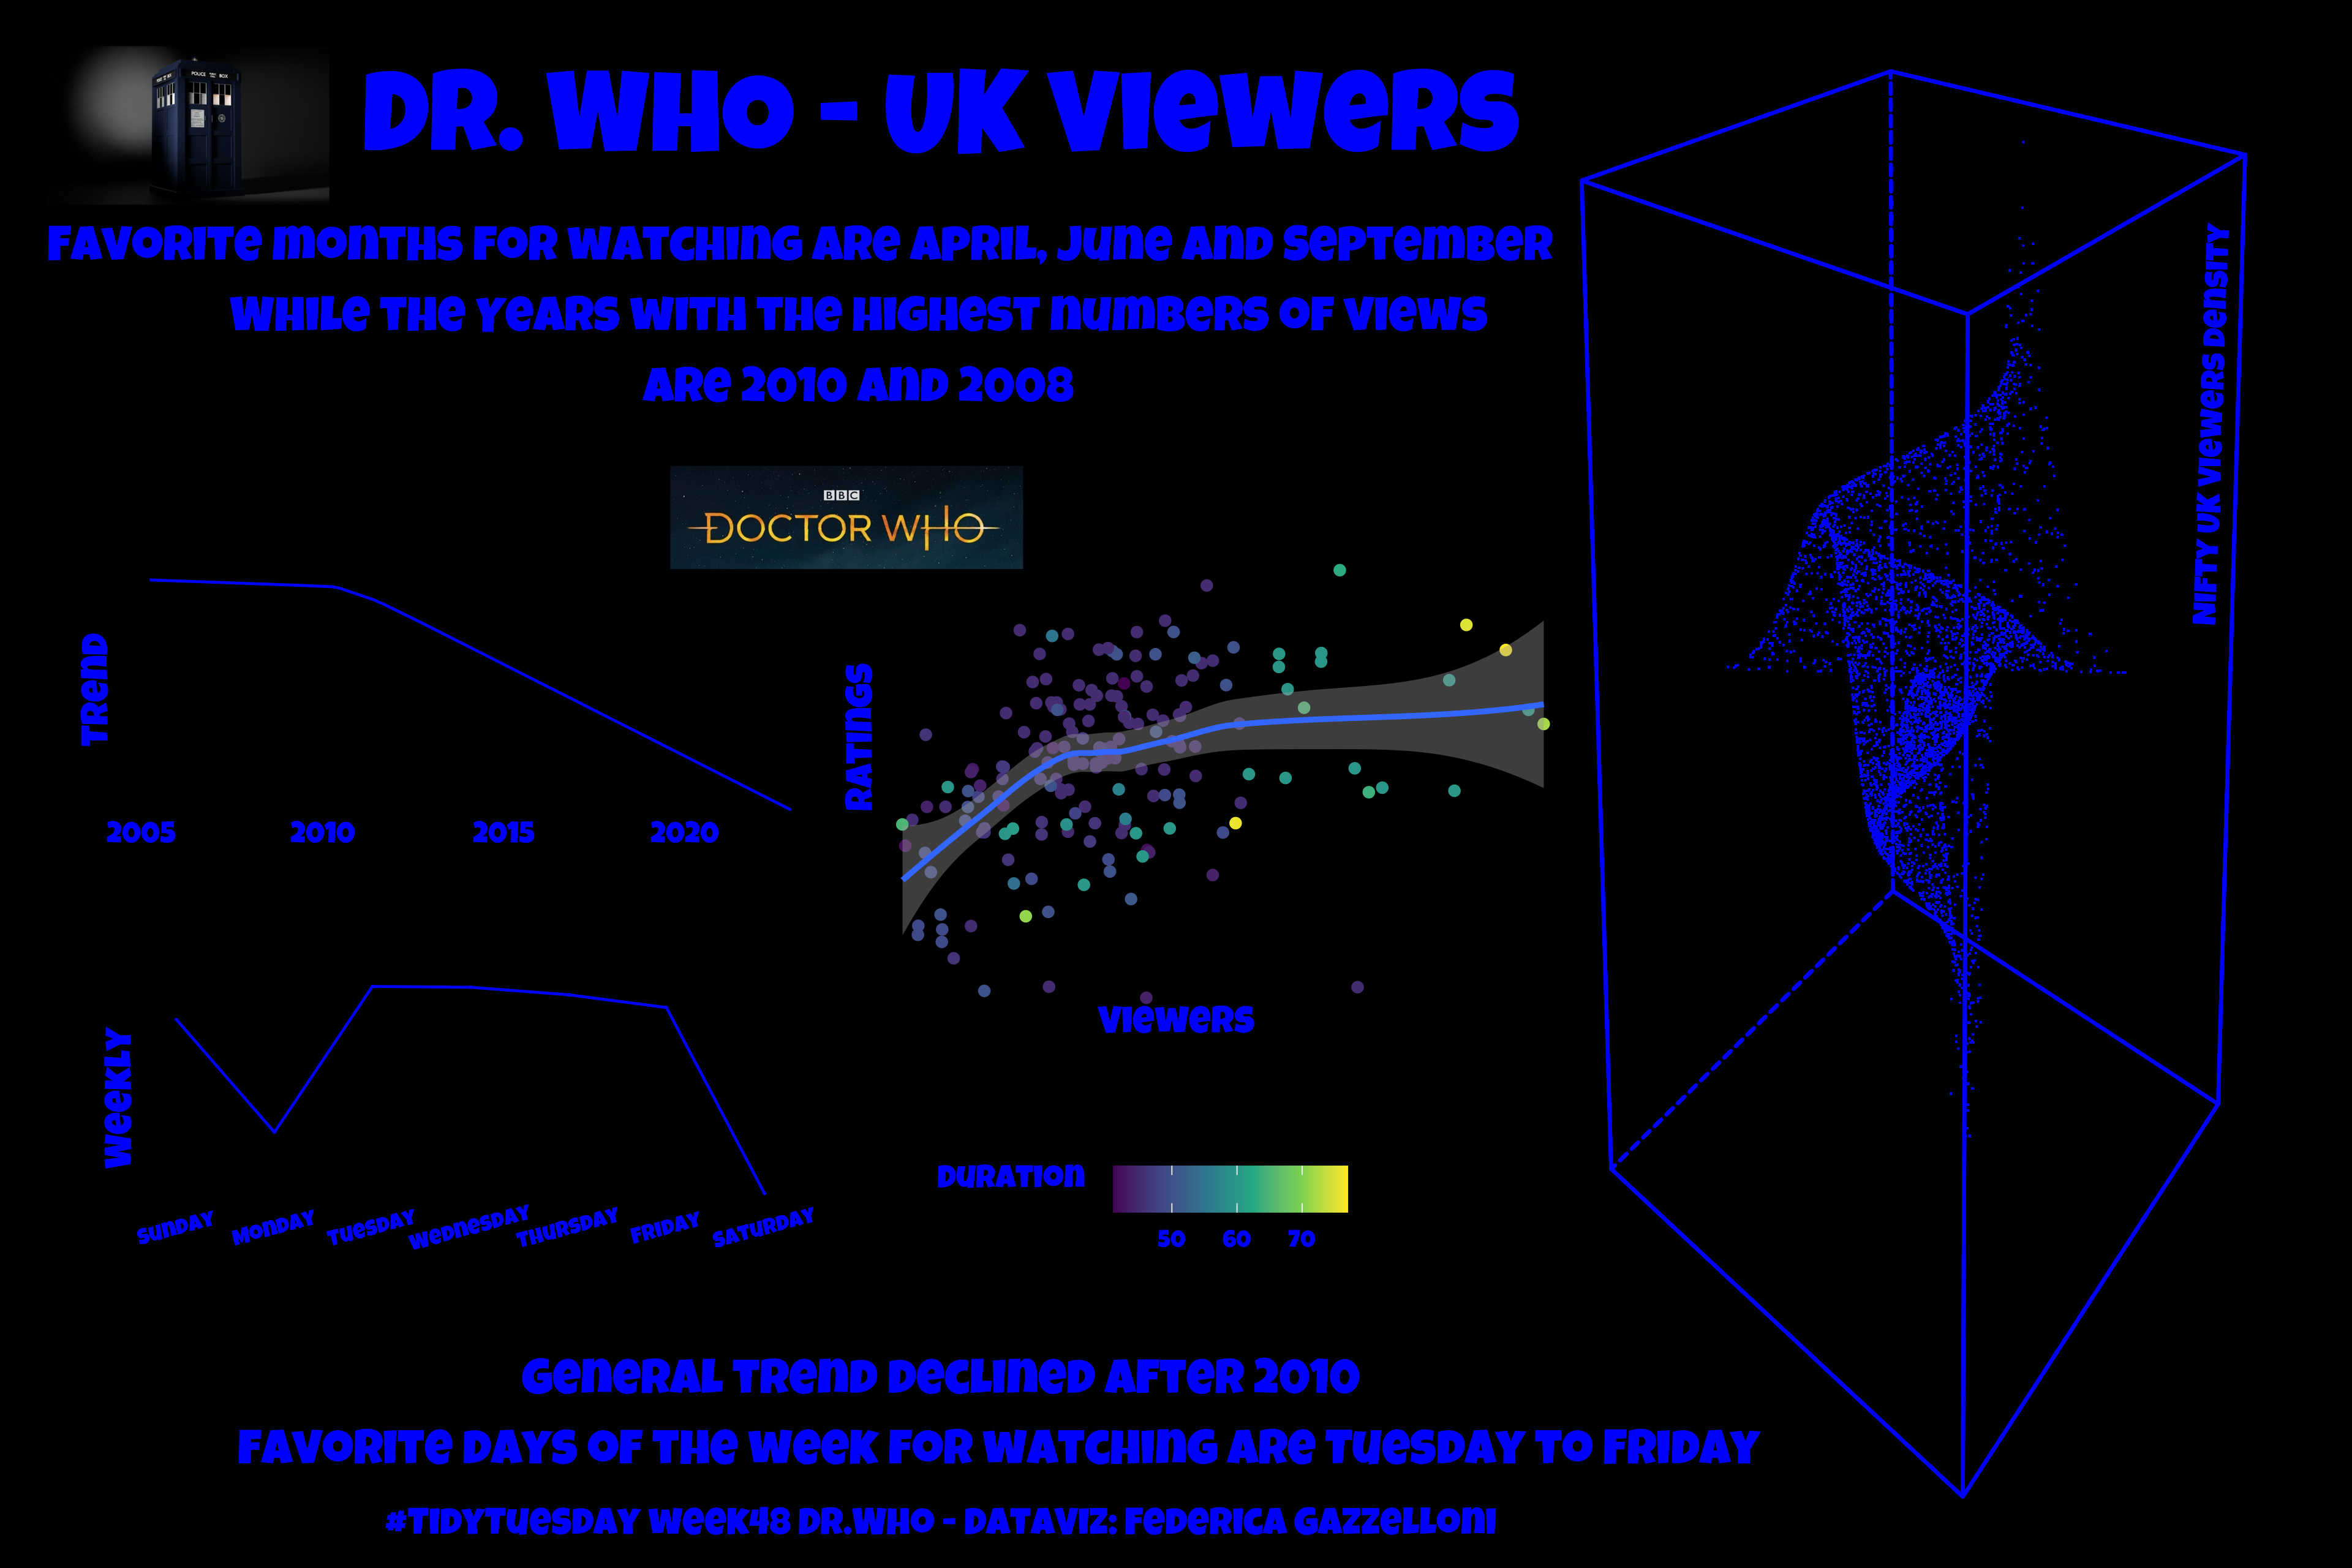
A visualization exploring characters, episodes, or story details in the Doctor Who dataset.
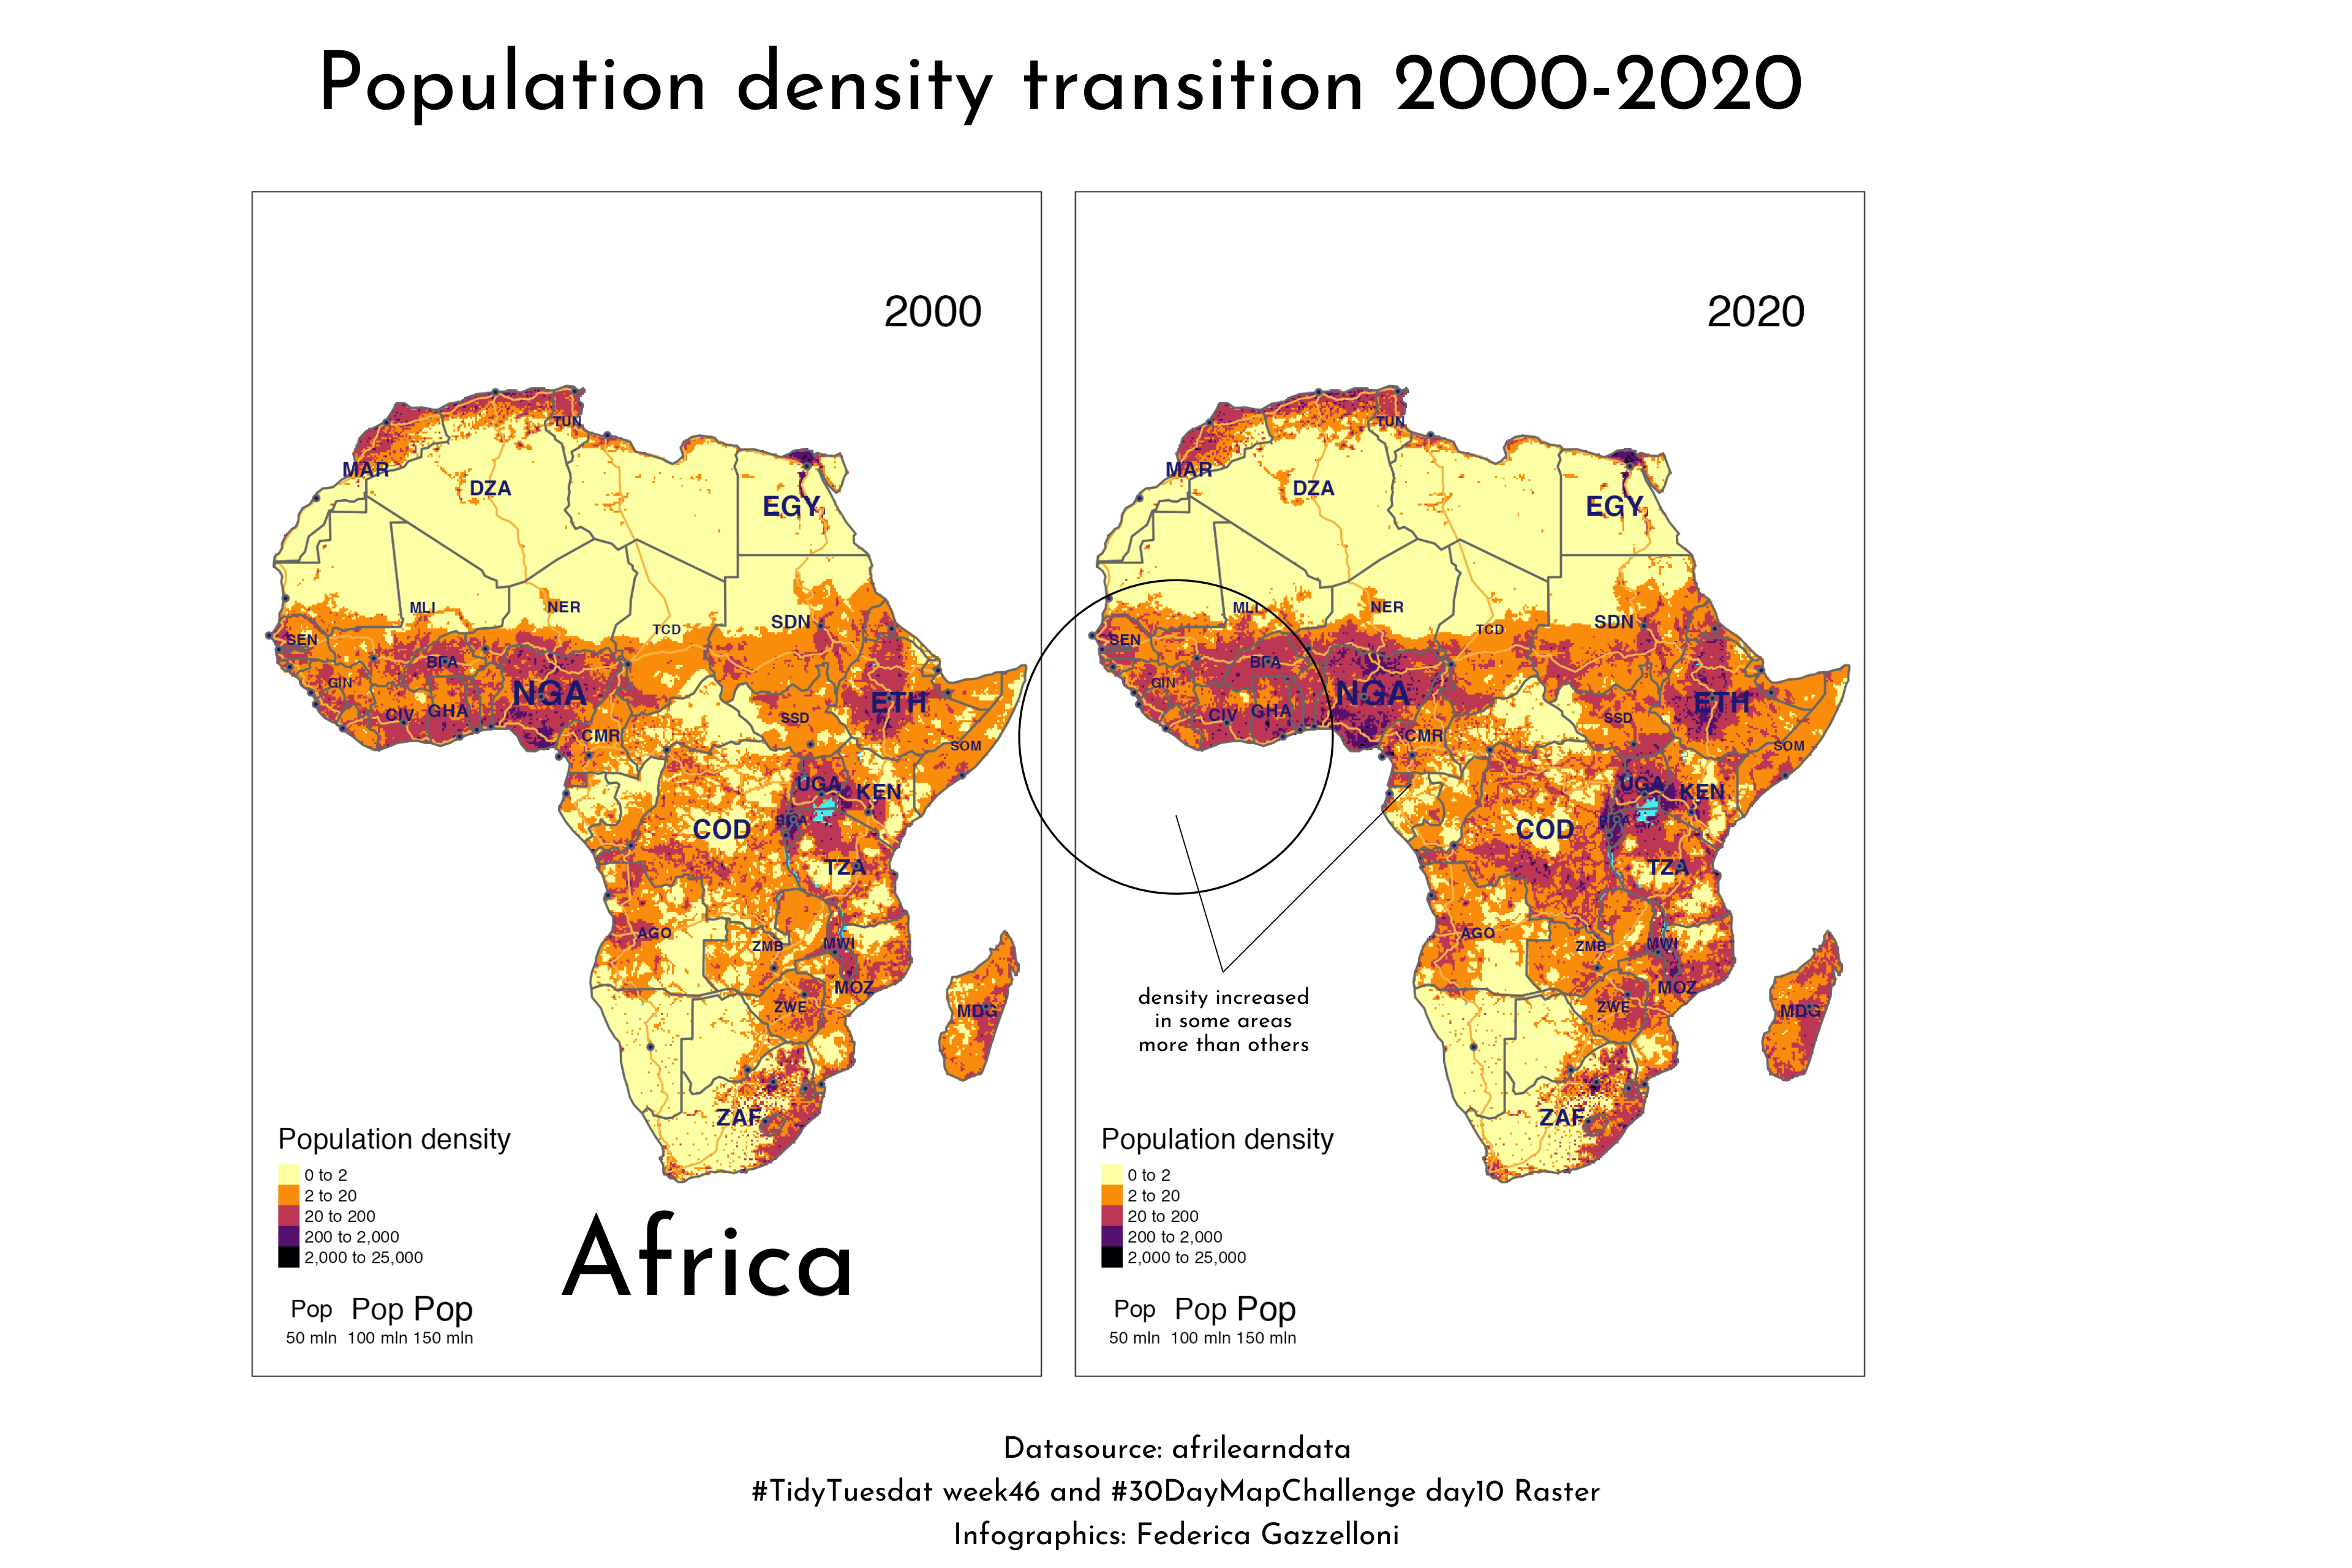
A visualization using afrilearndata to explore population and geographic patterns across Africa.
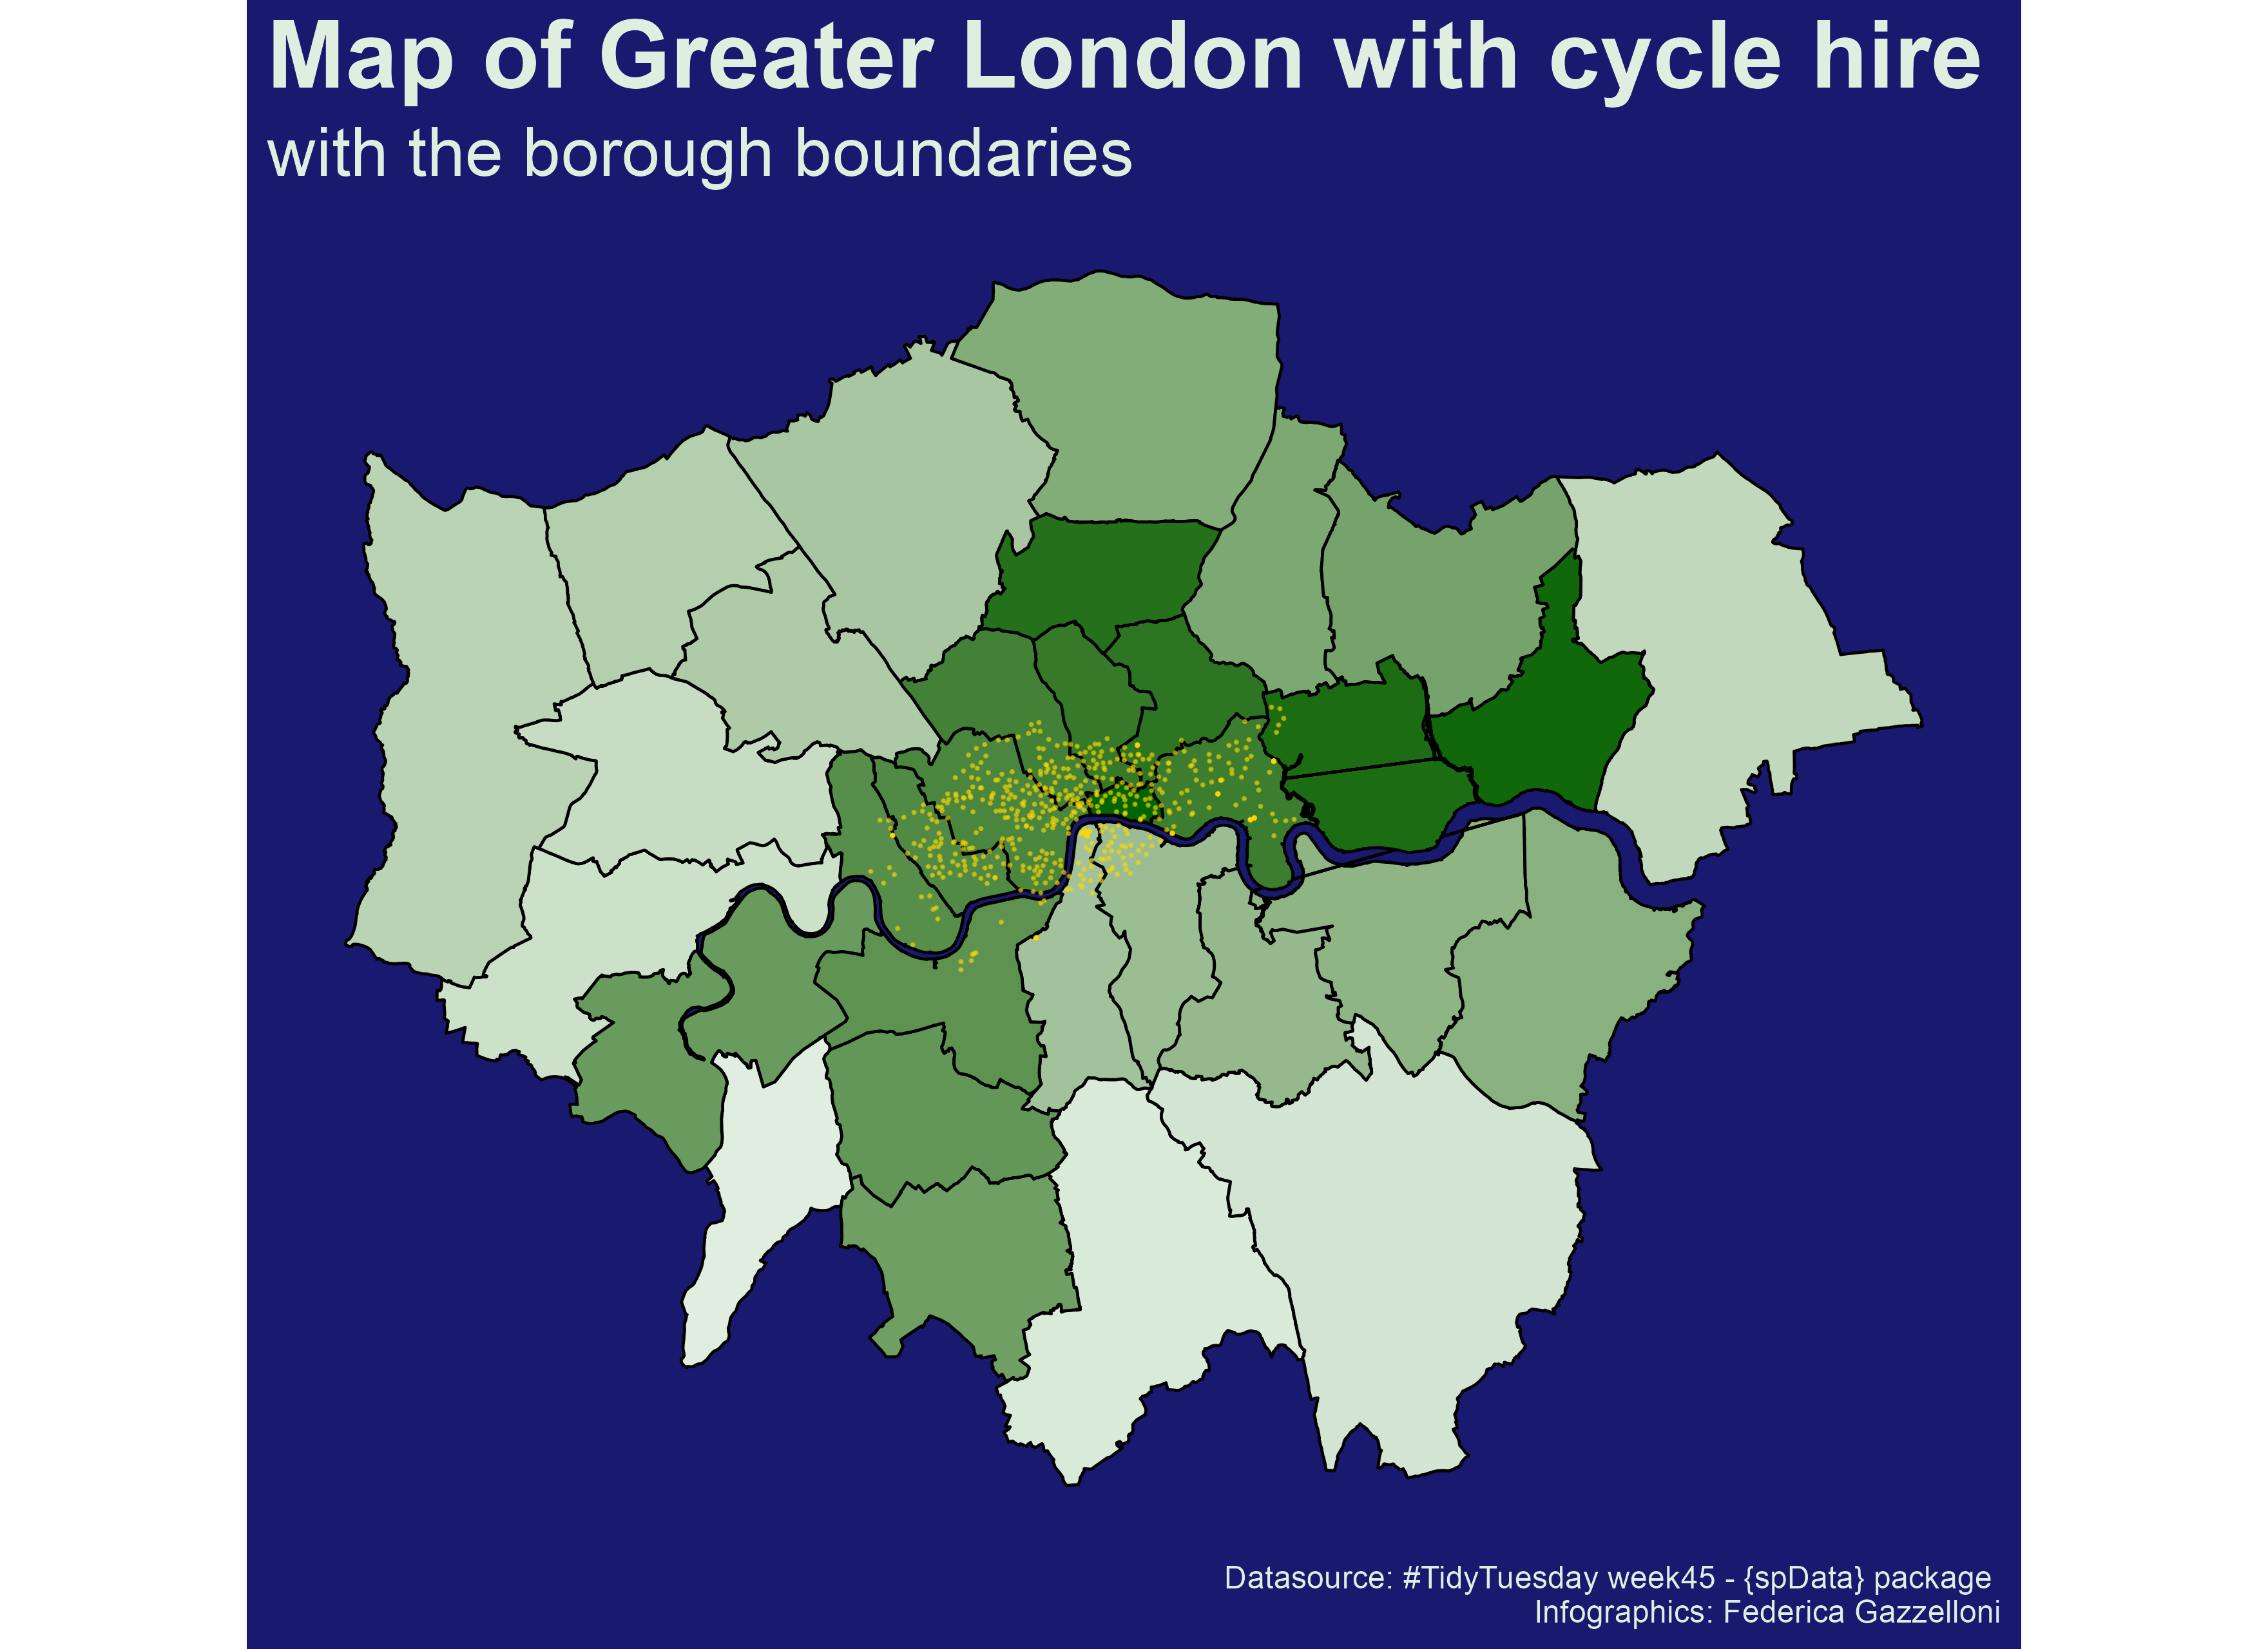
A map-based exploration created in R using open geographic data from the TidyTuesday 2021 Week 45 topic.
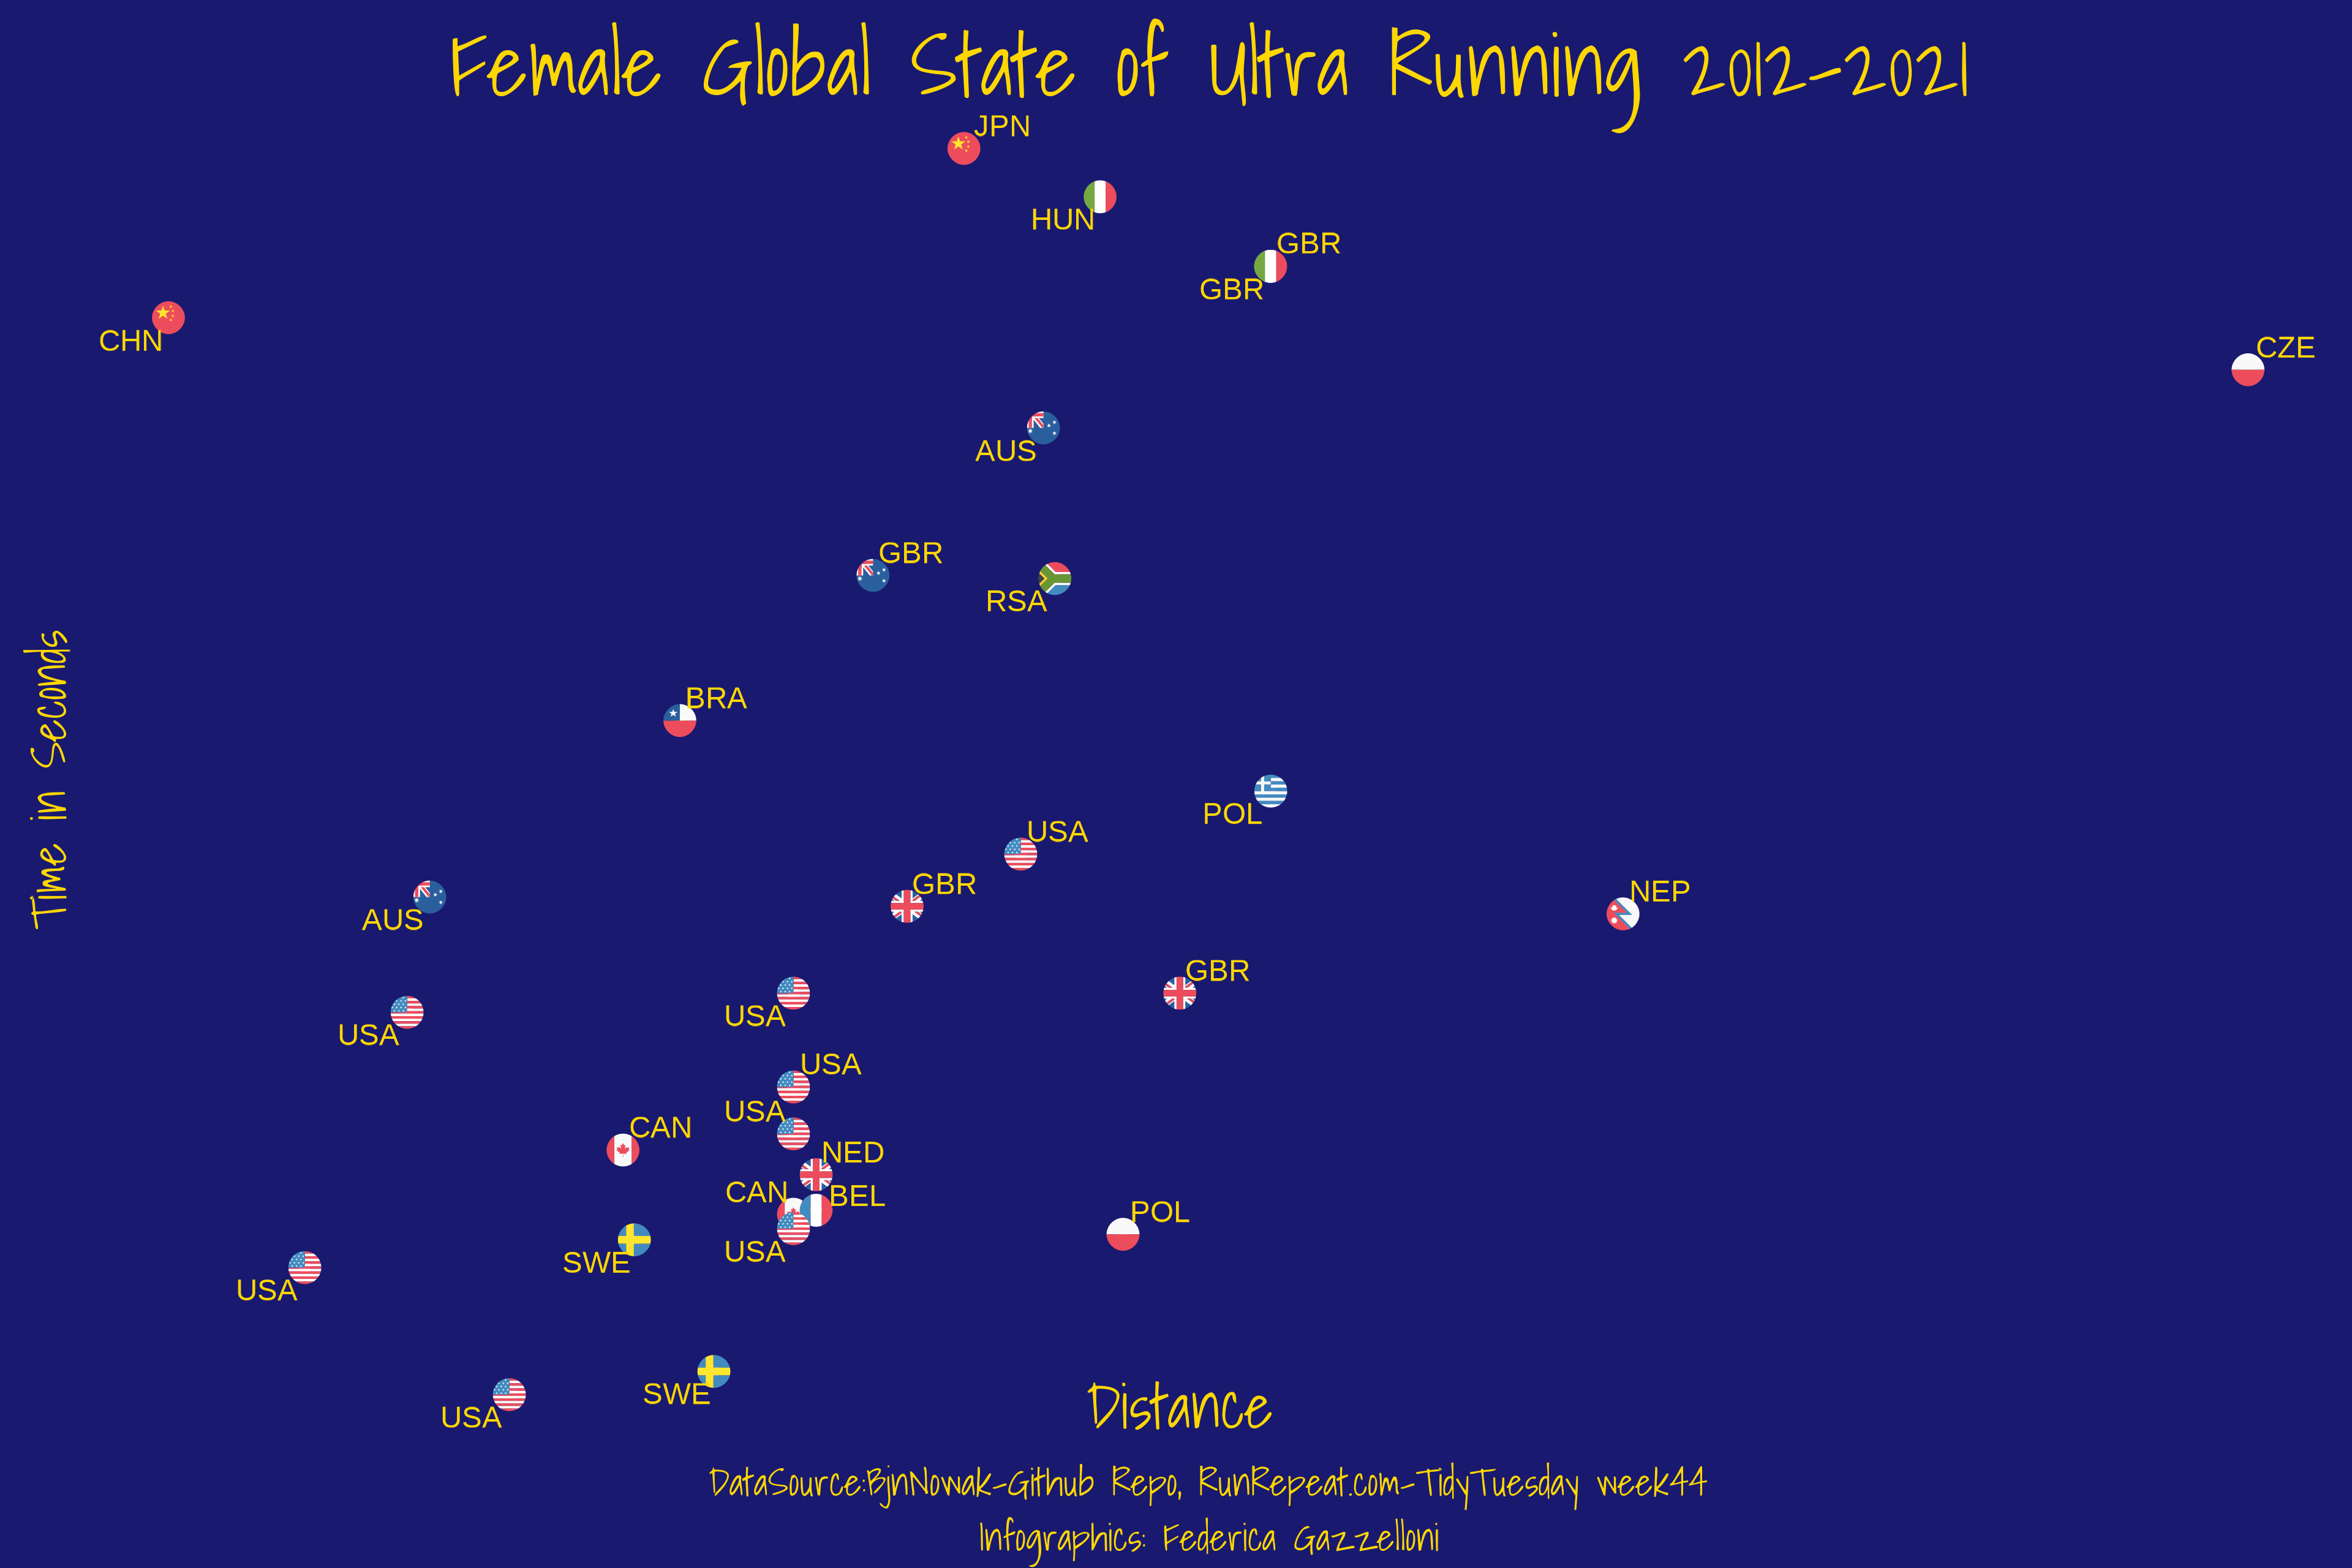
A visualization of ultra-trail running races and athlete results from the TidyTuesday dataset.
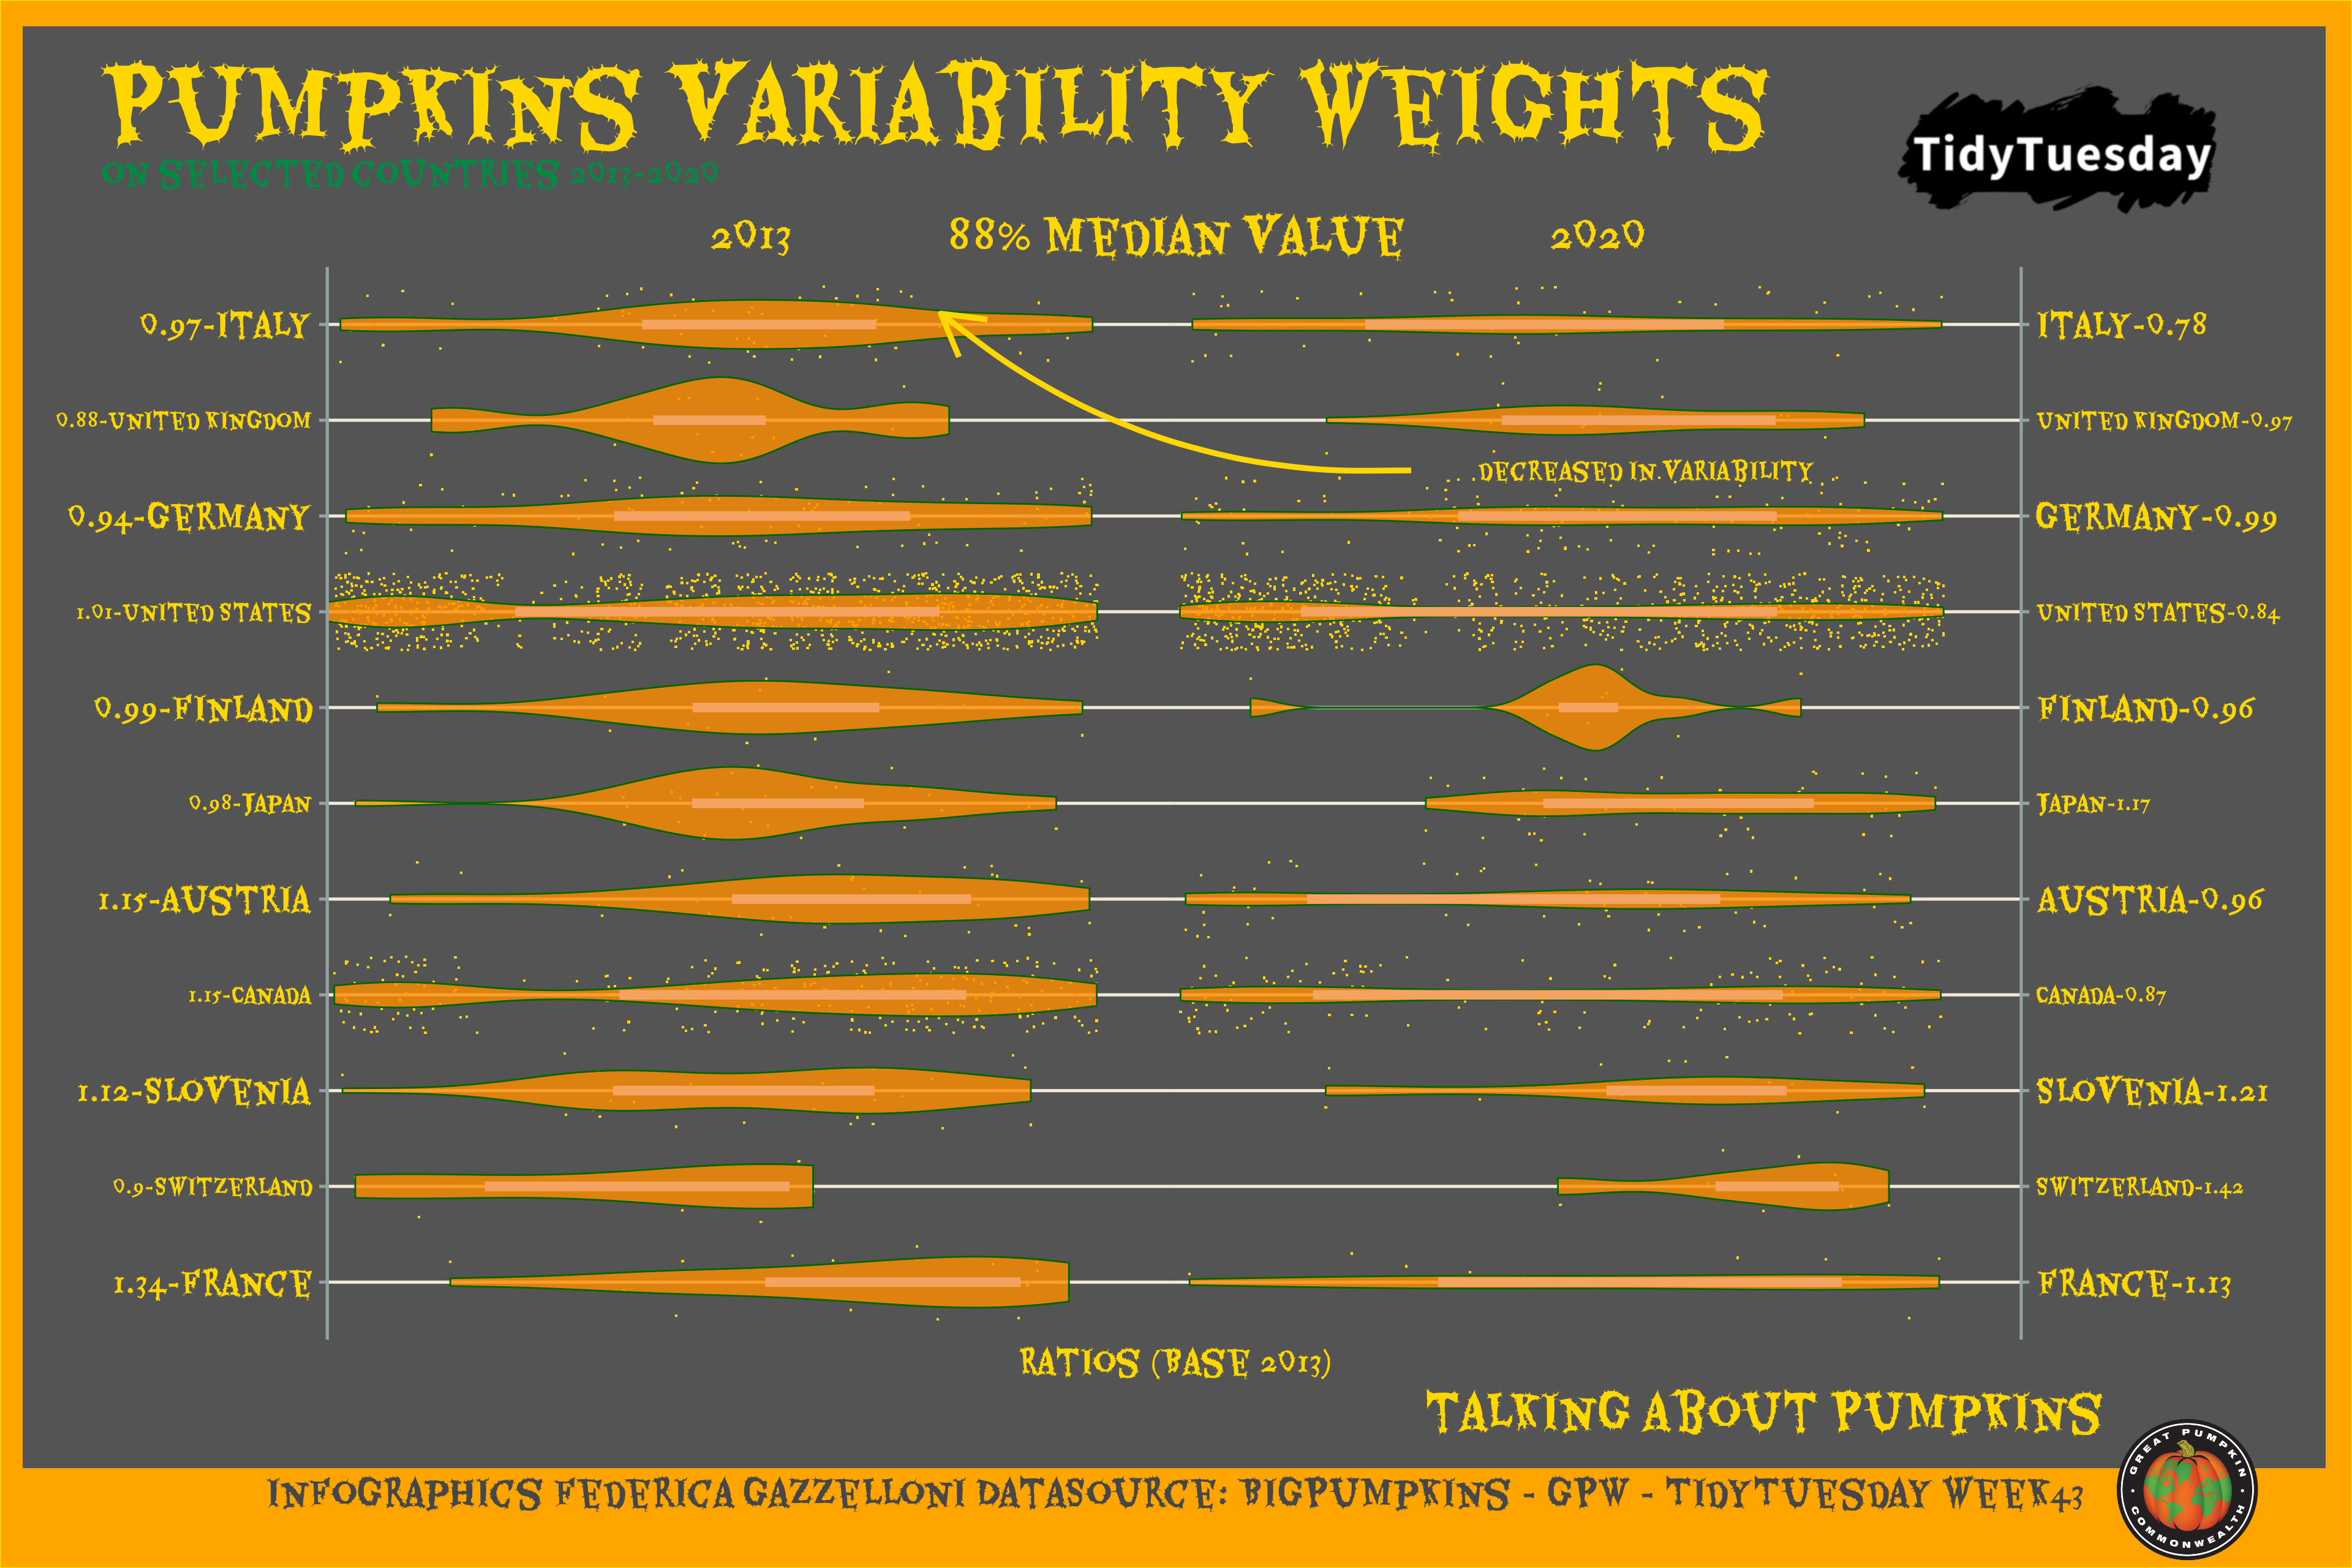
A comparison of giant pumpkin measurements and weights in the Big Pumpkins dataset.
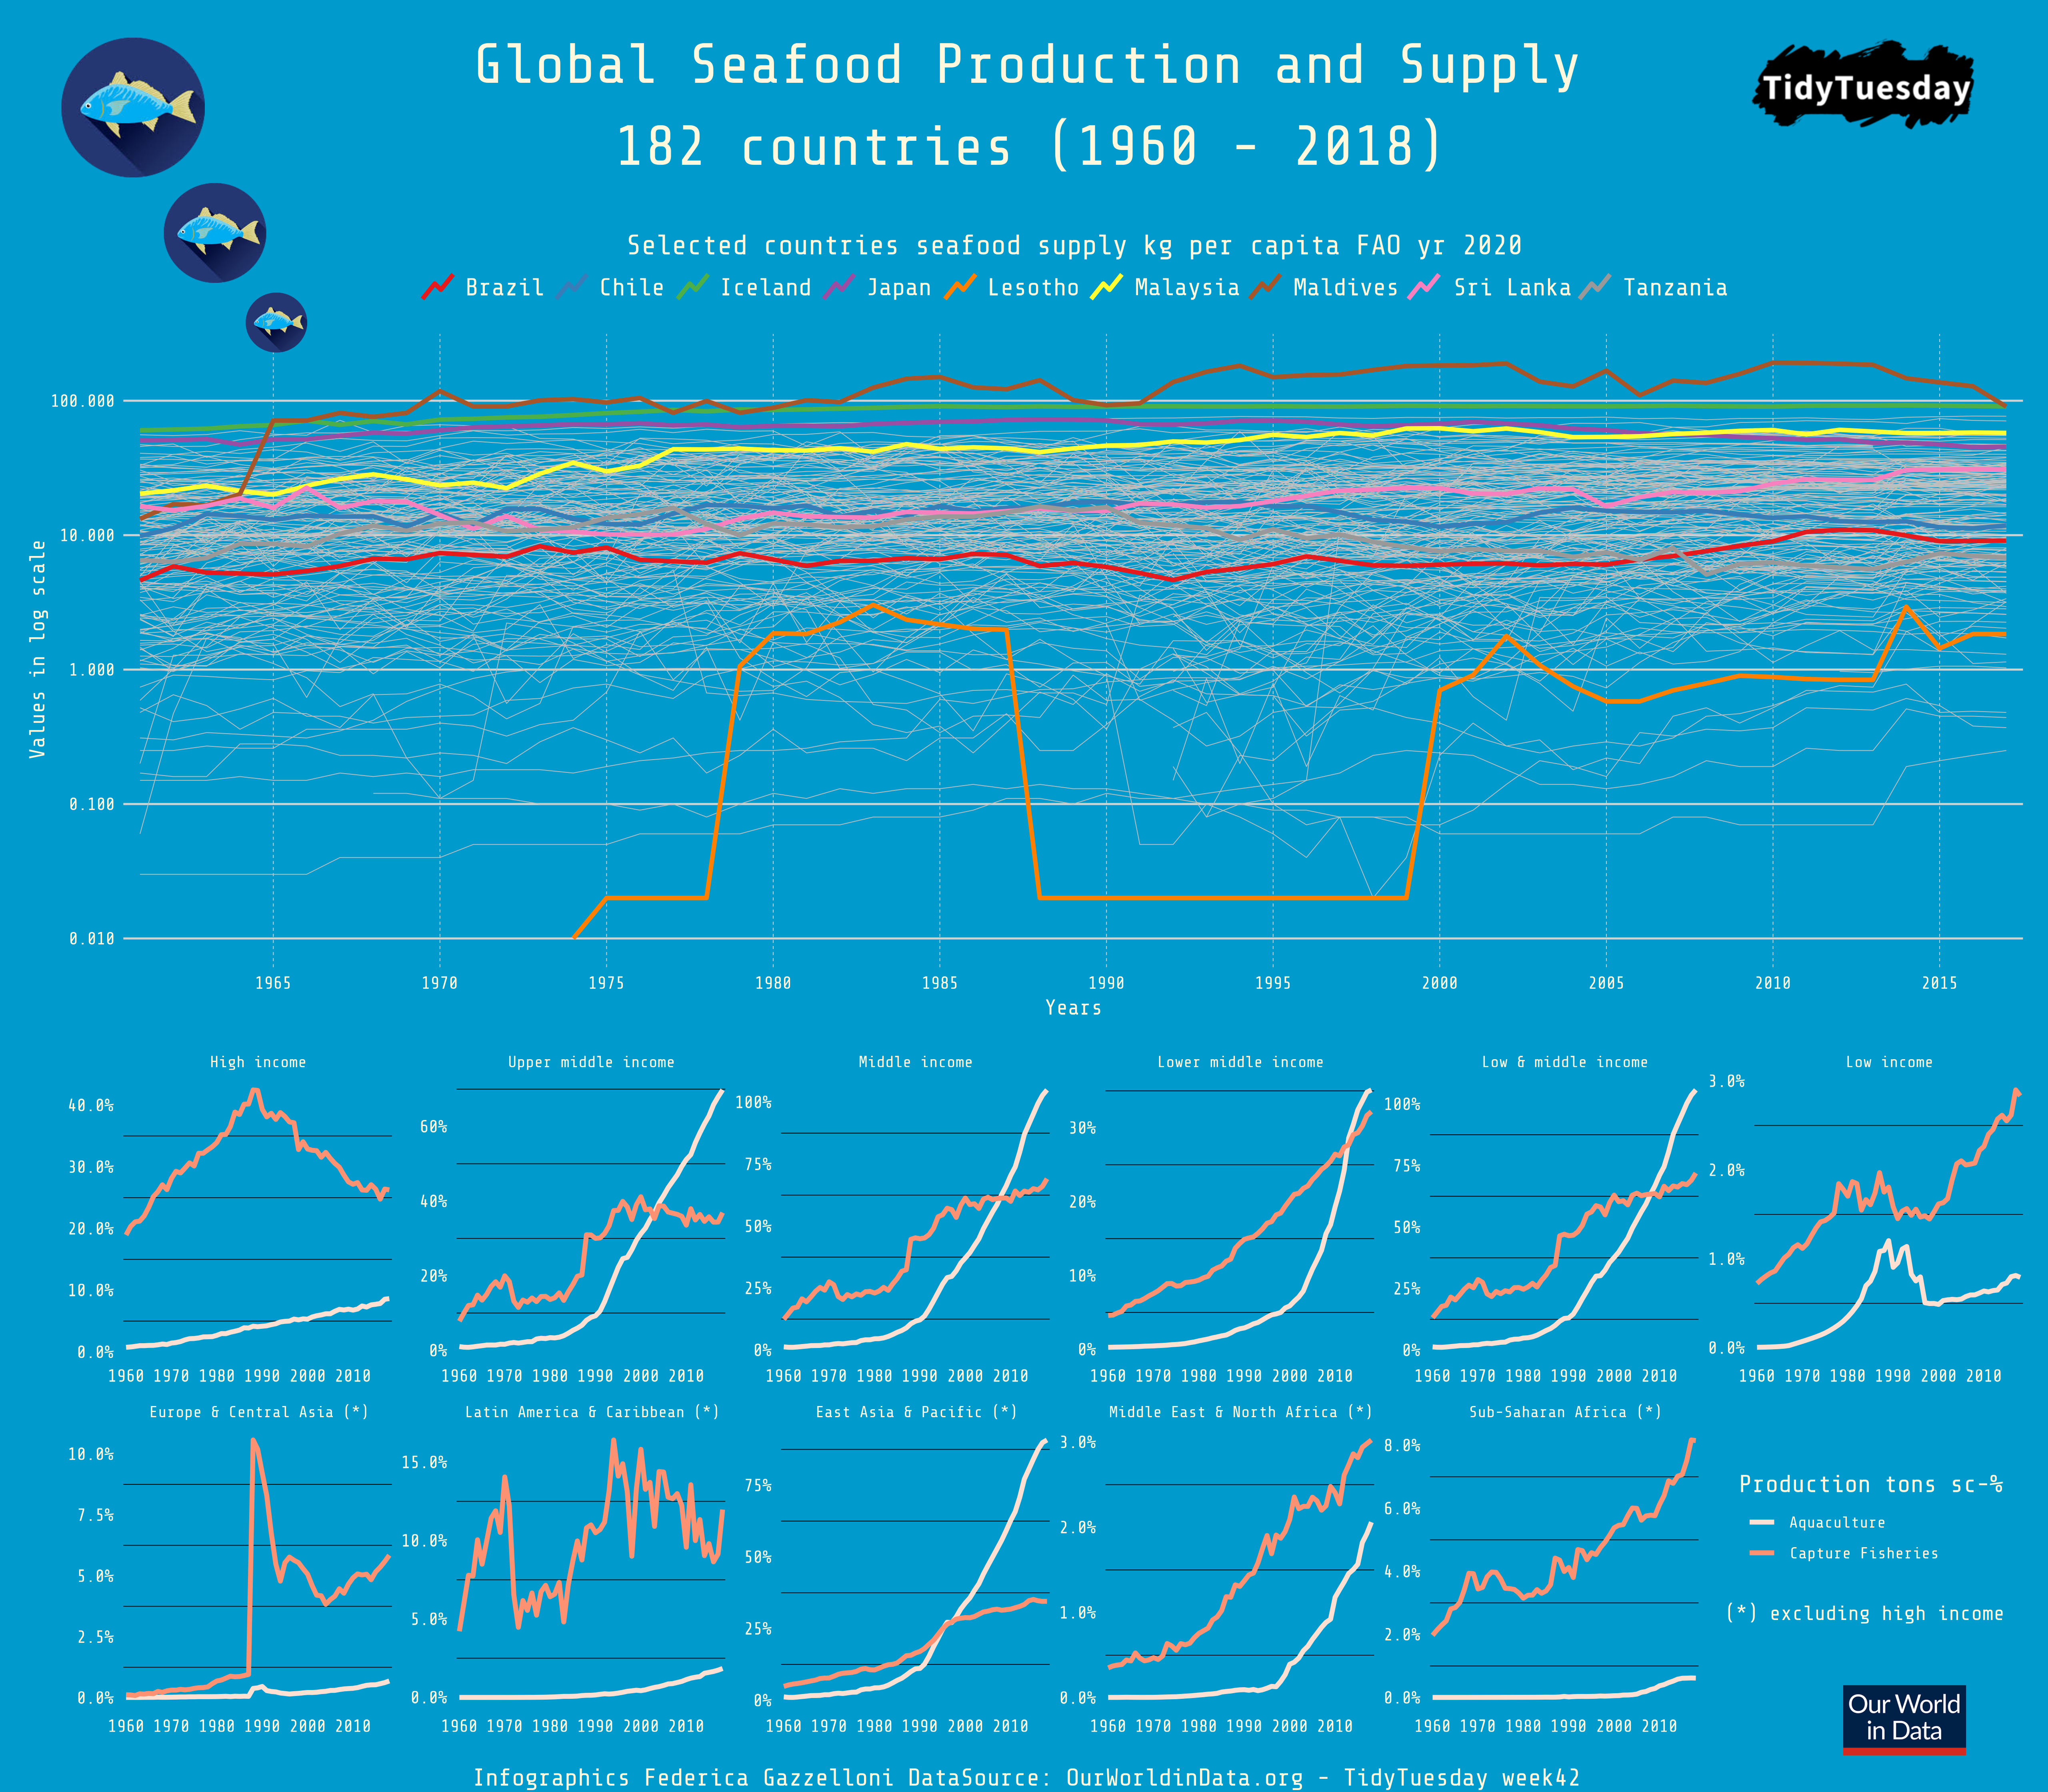
A visualization of global seafood production and consumption across species and regions.
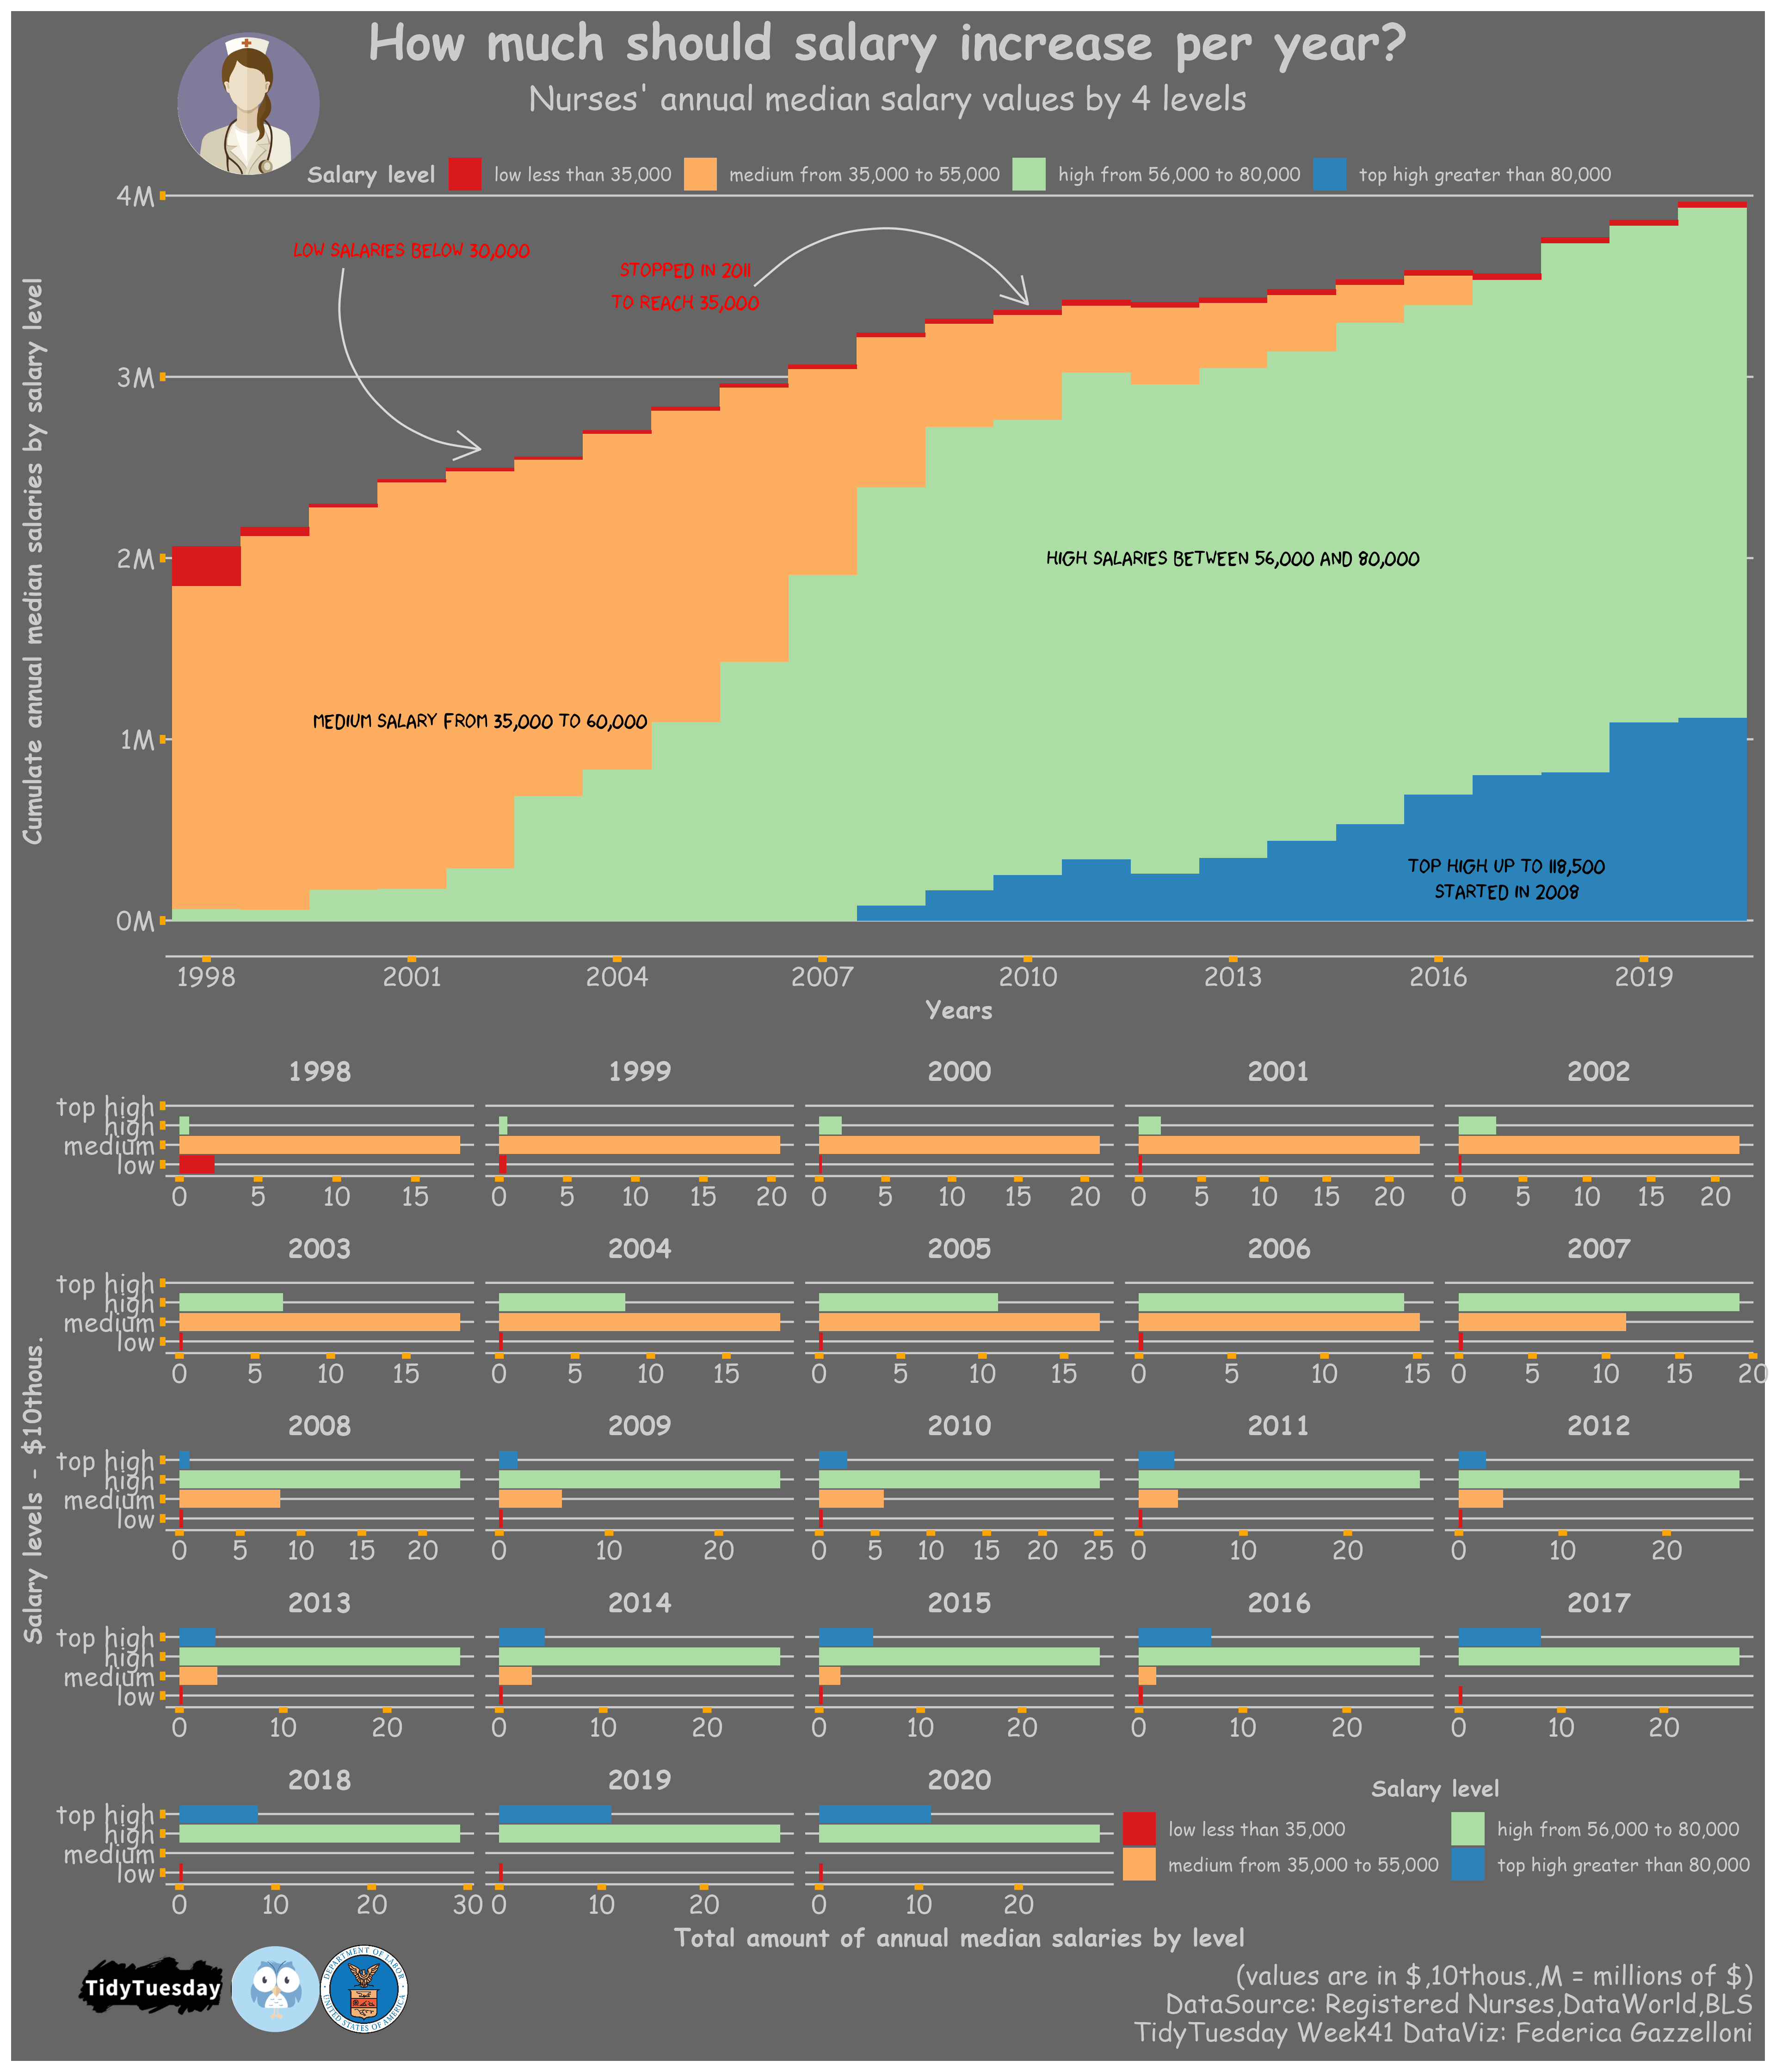
A visualization of registered nurse counts and workforce patterns across the United States.
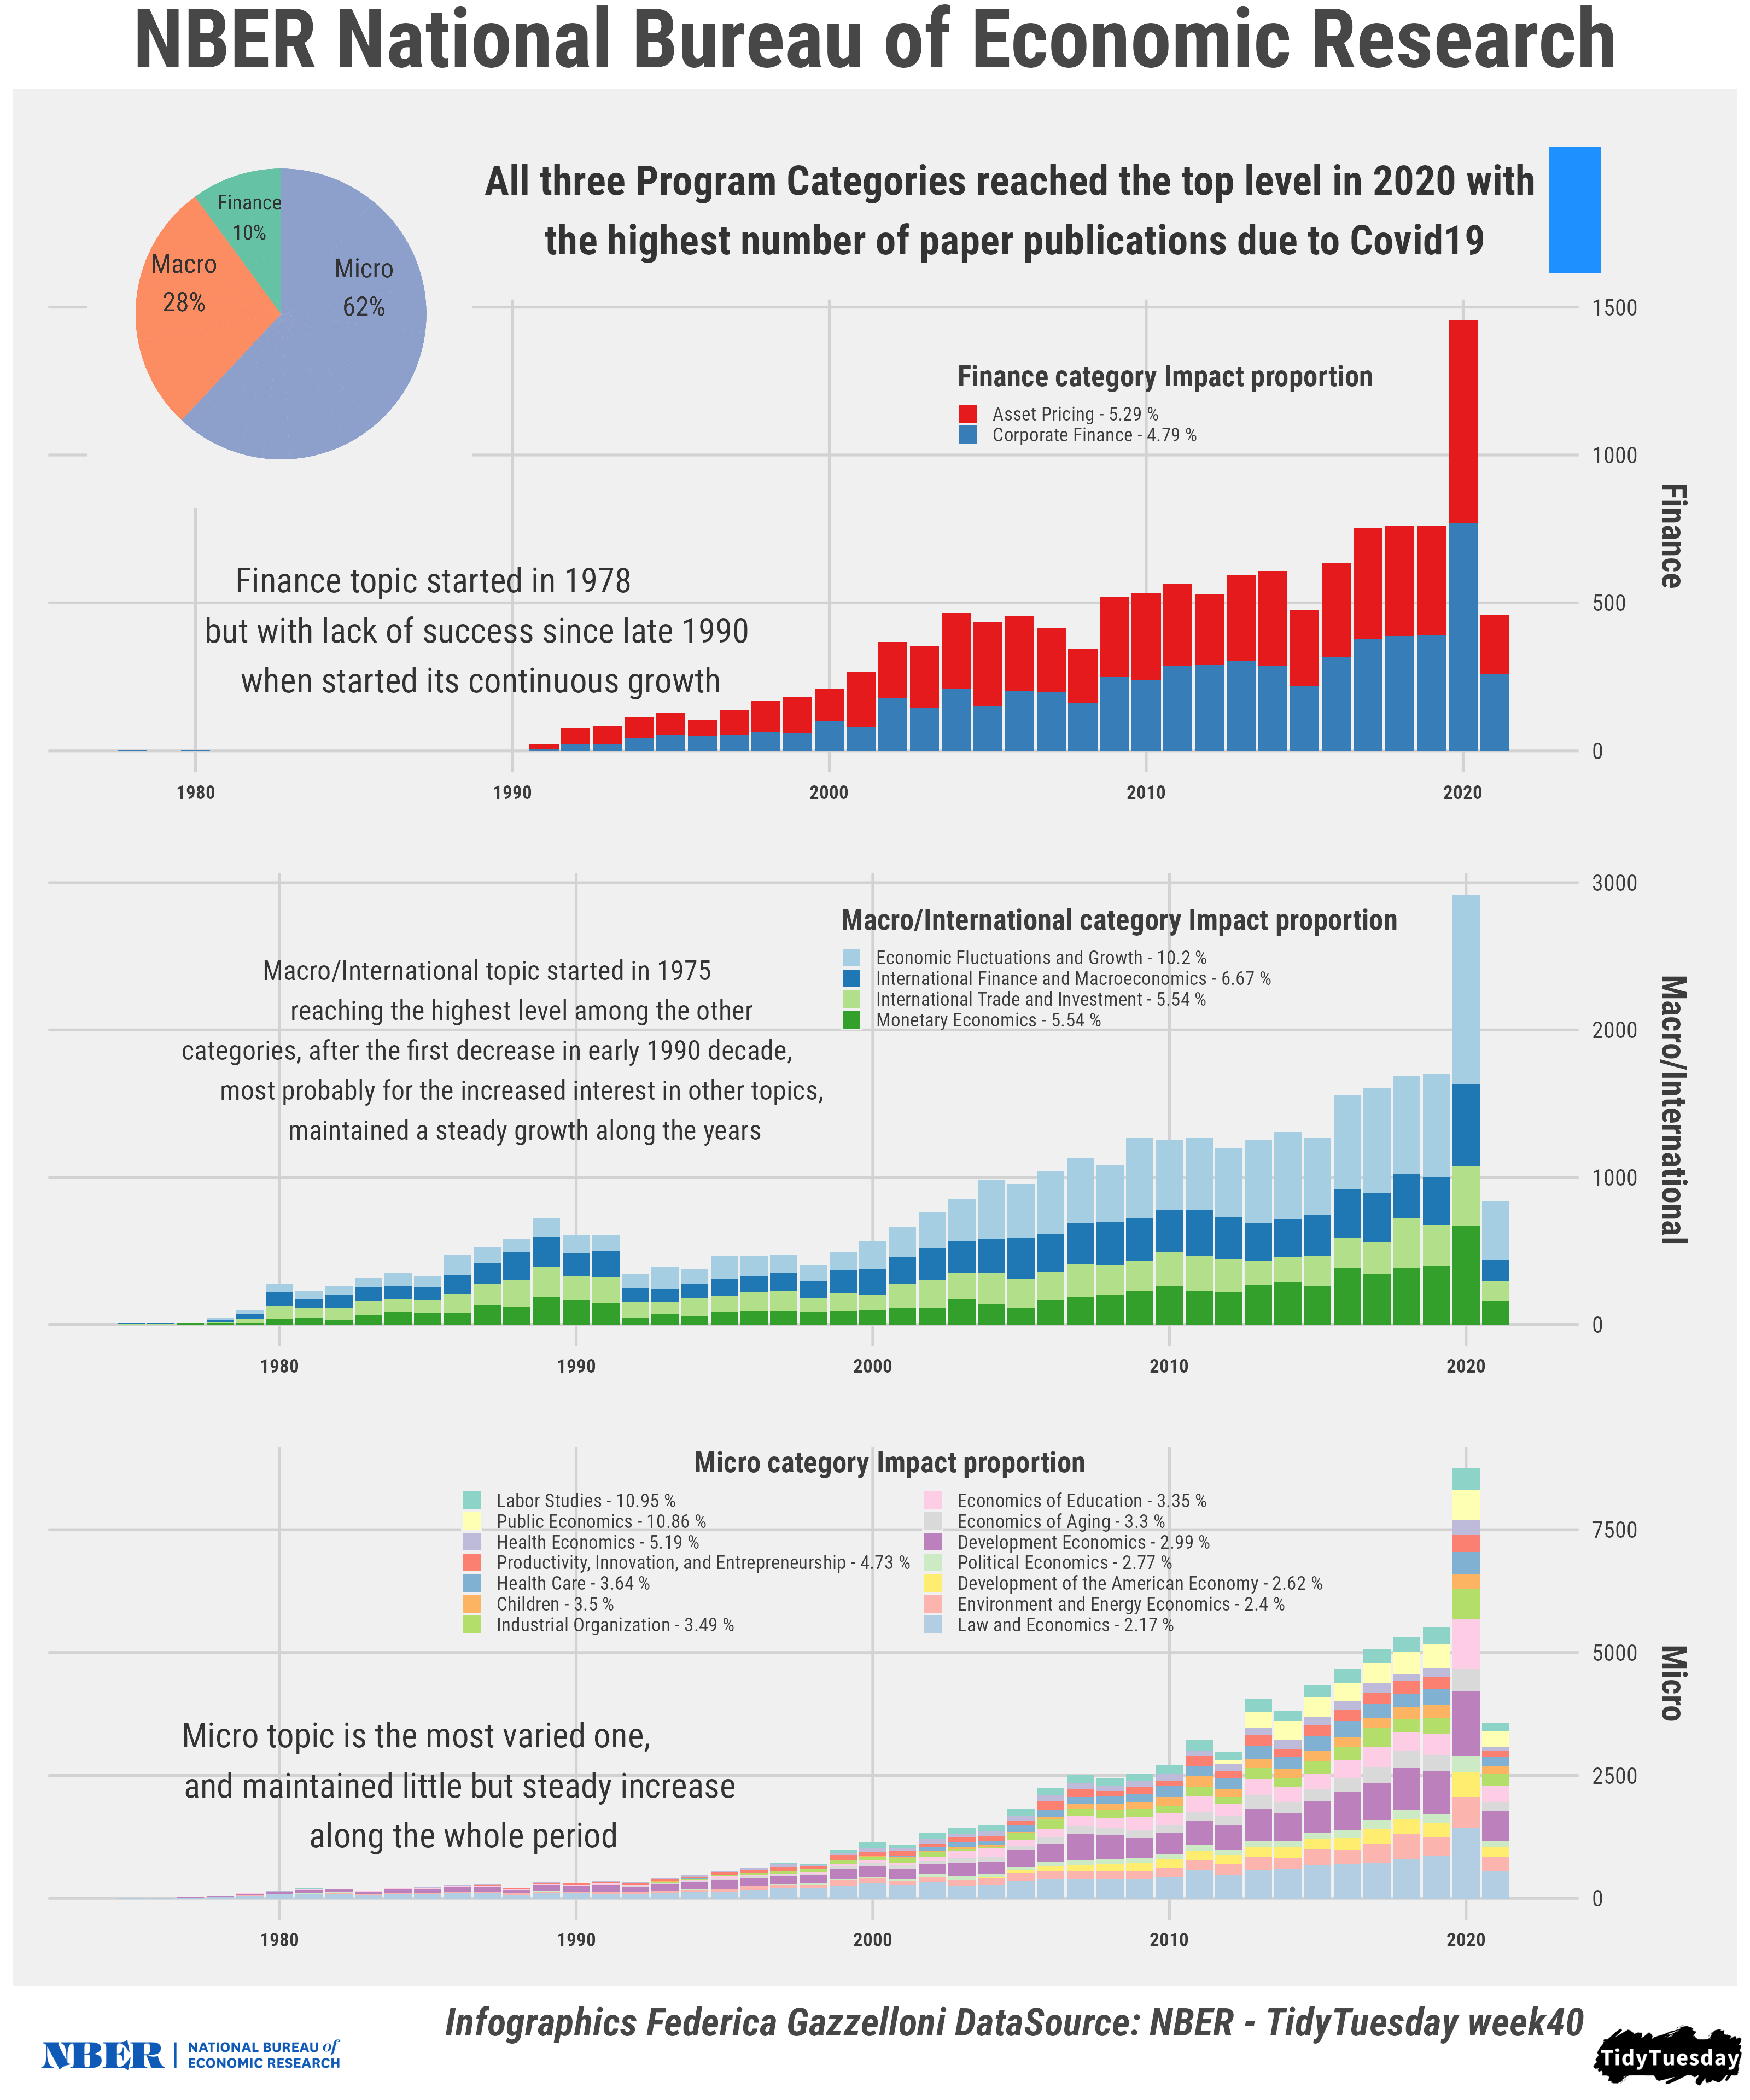
A visualization exploring National Bureau of Economic Research working papers and their publication details.
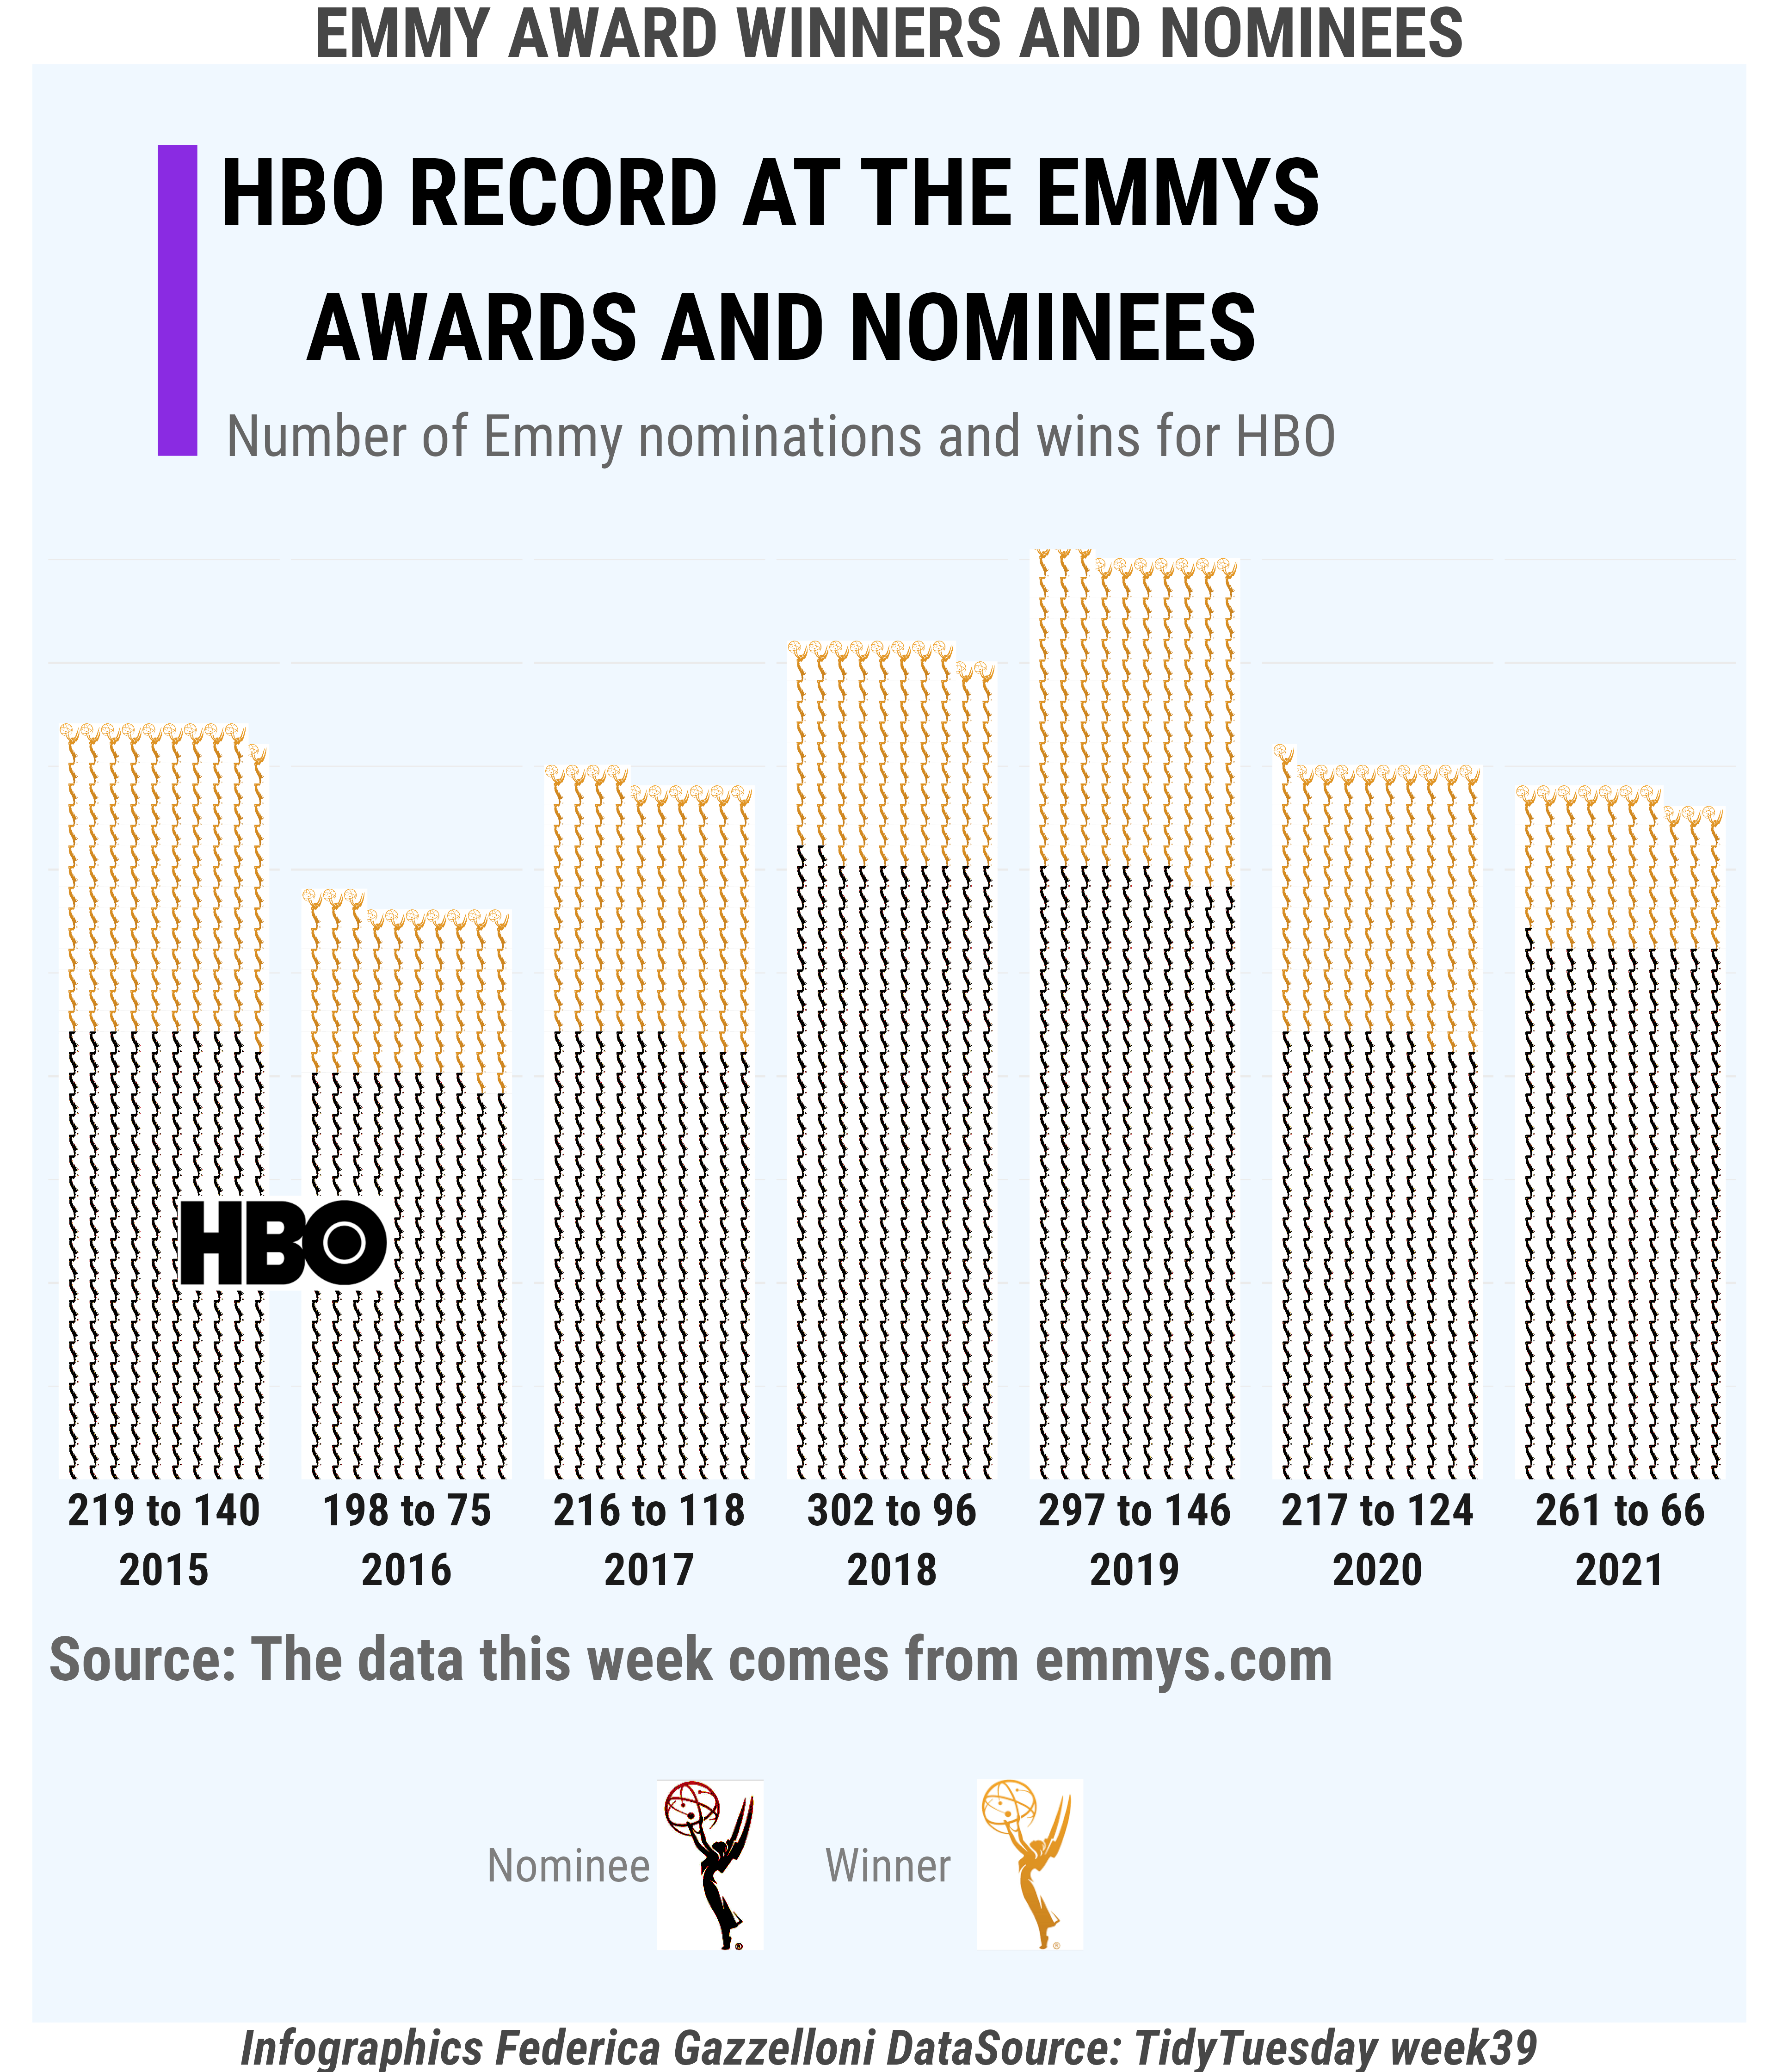
A visualization of Emmy Award nominations and wins across television programs and years.
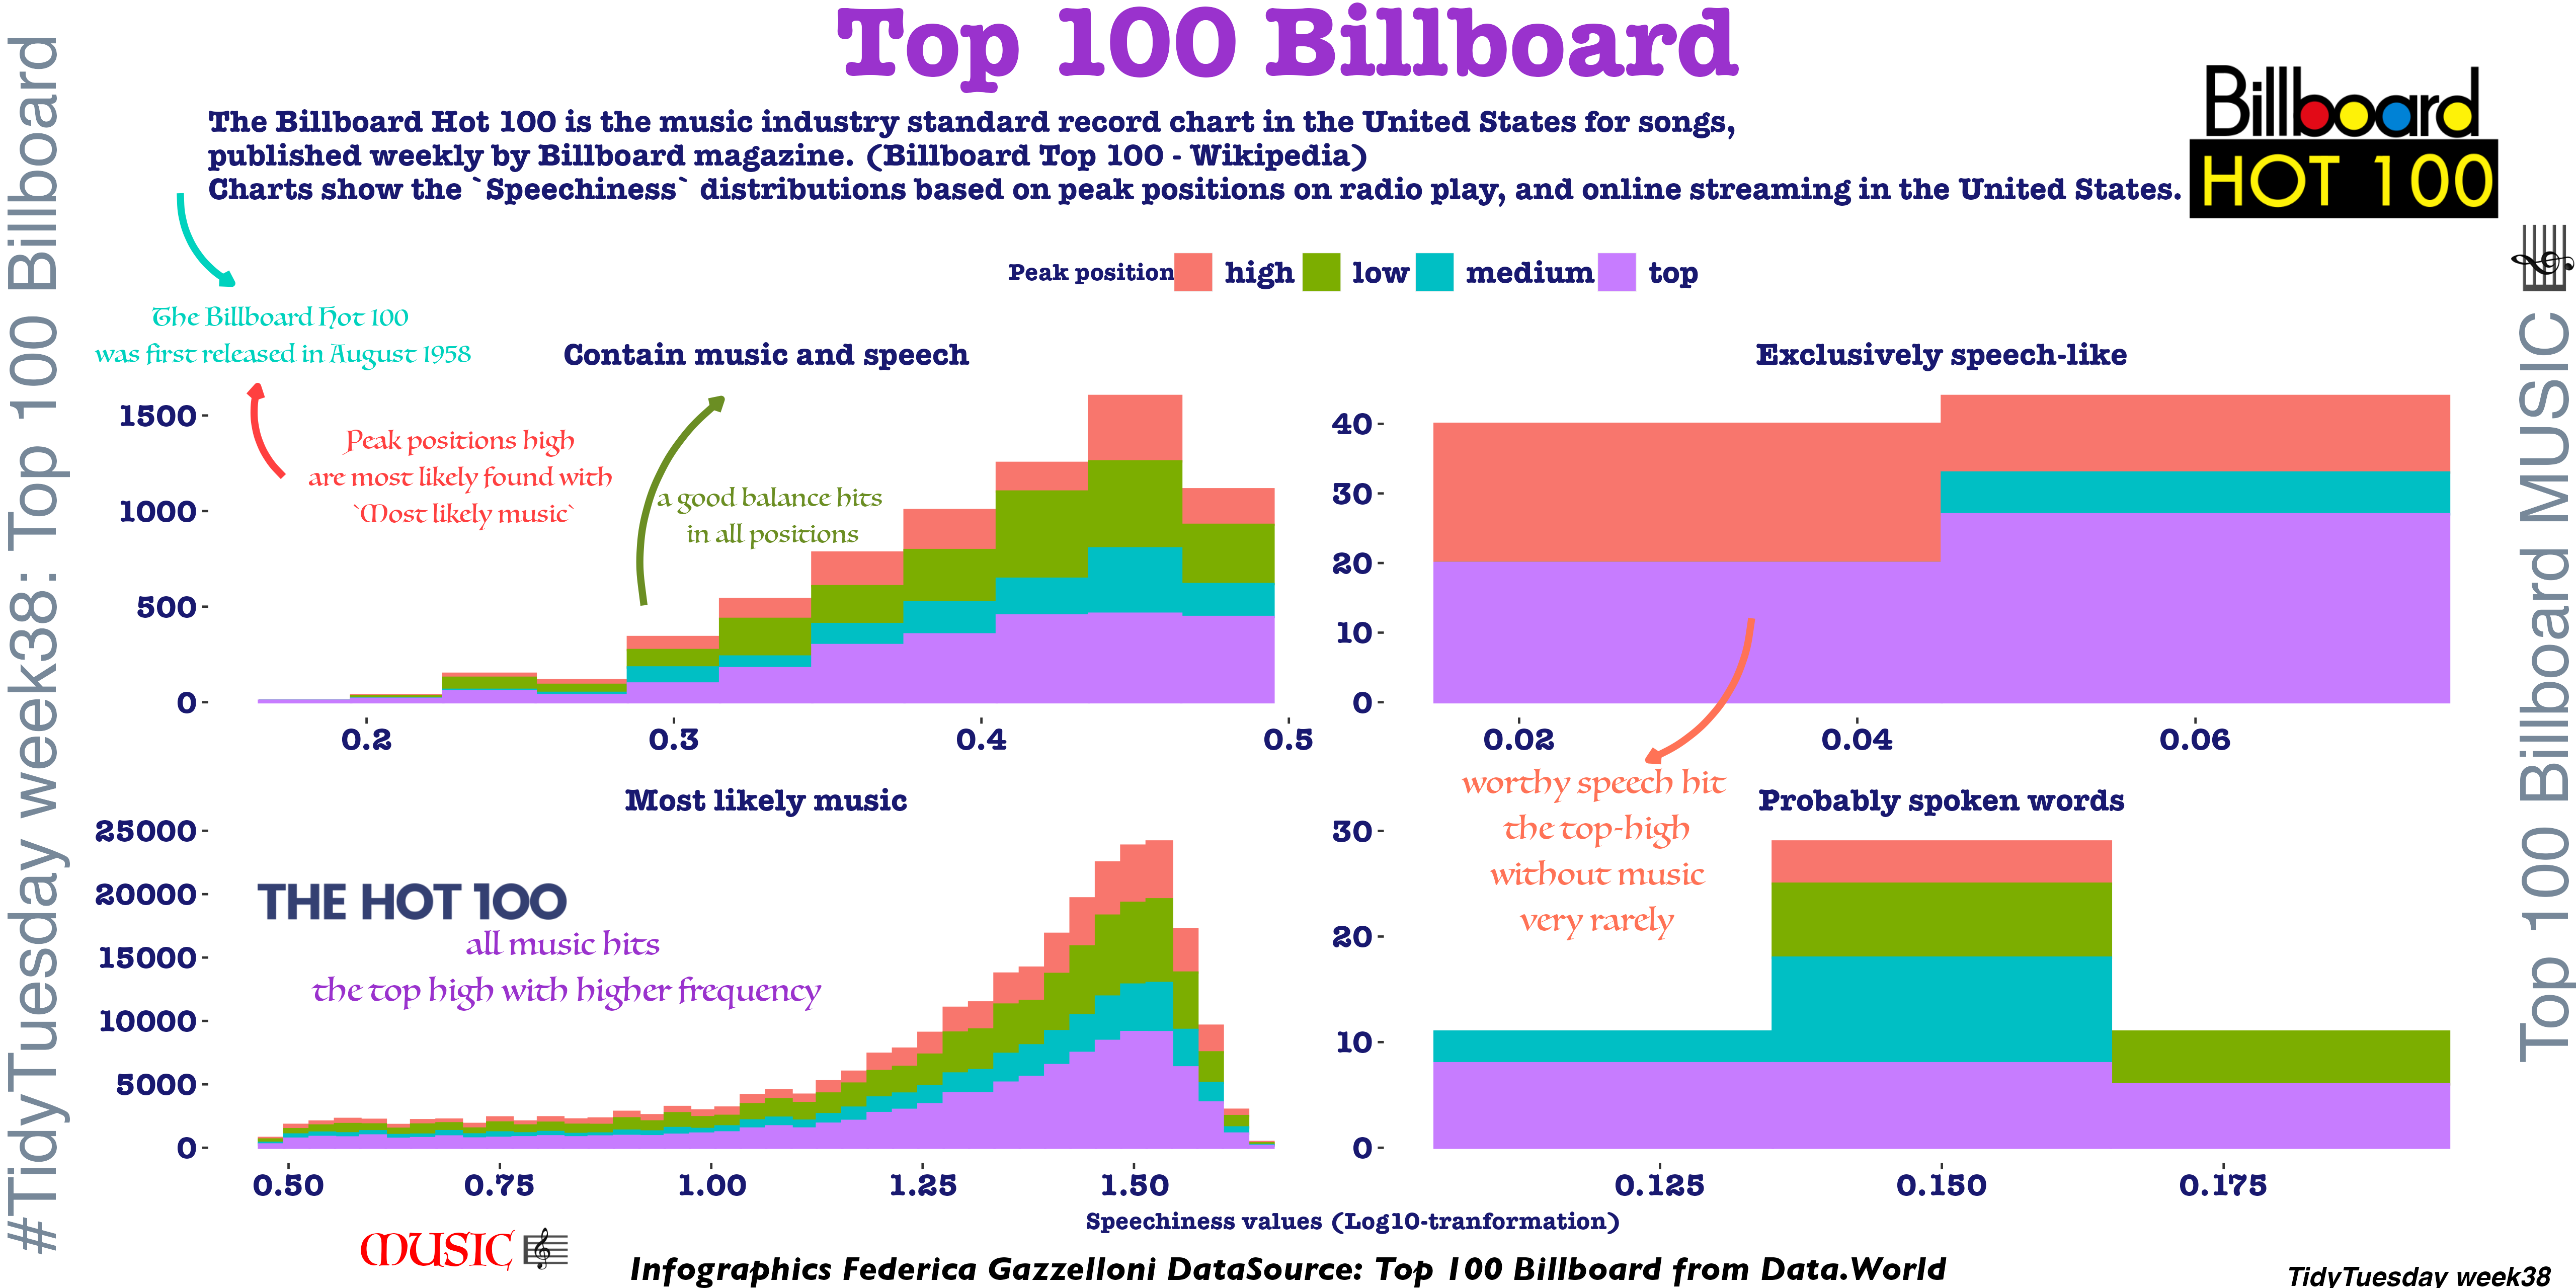
A chart exploring songs and rankings in the Billboard Hot 100 dataset.
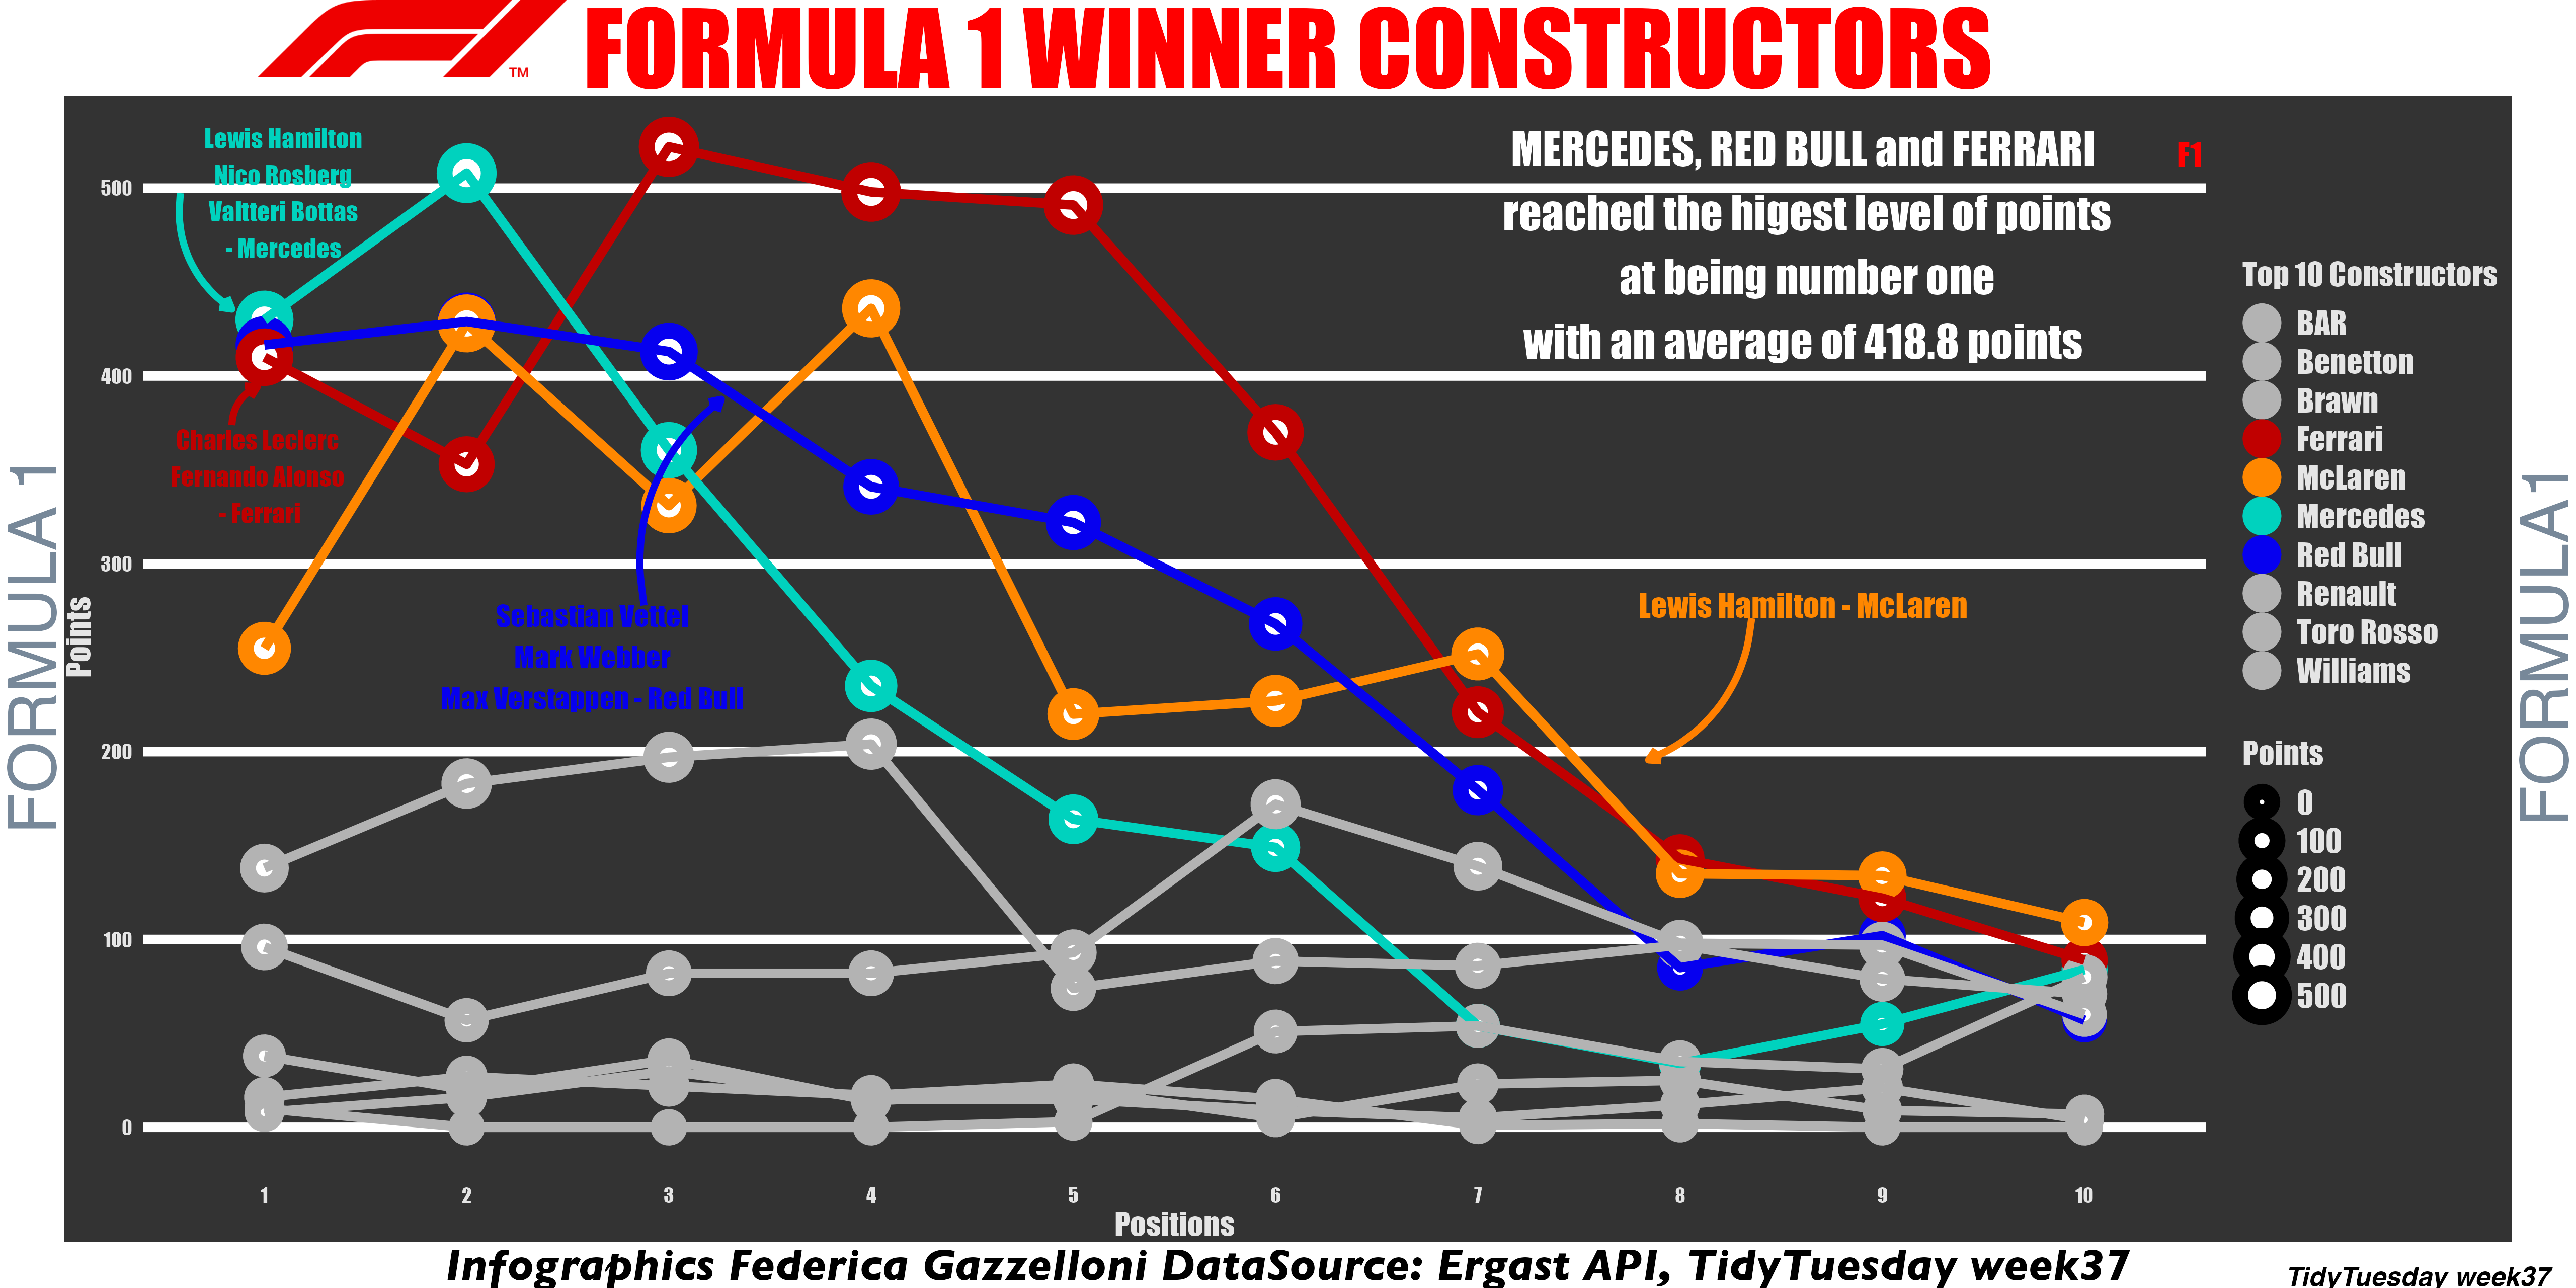
A visualization of Formula 1 race results and records across drivers, teams, and seasons.
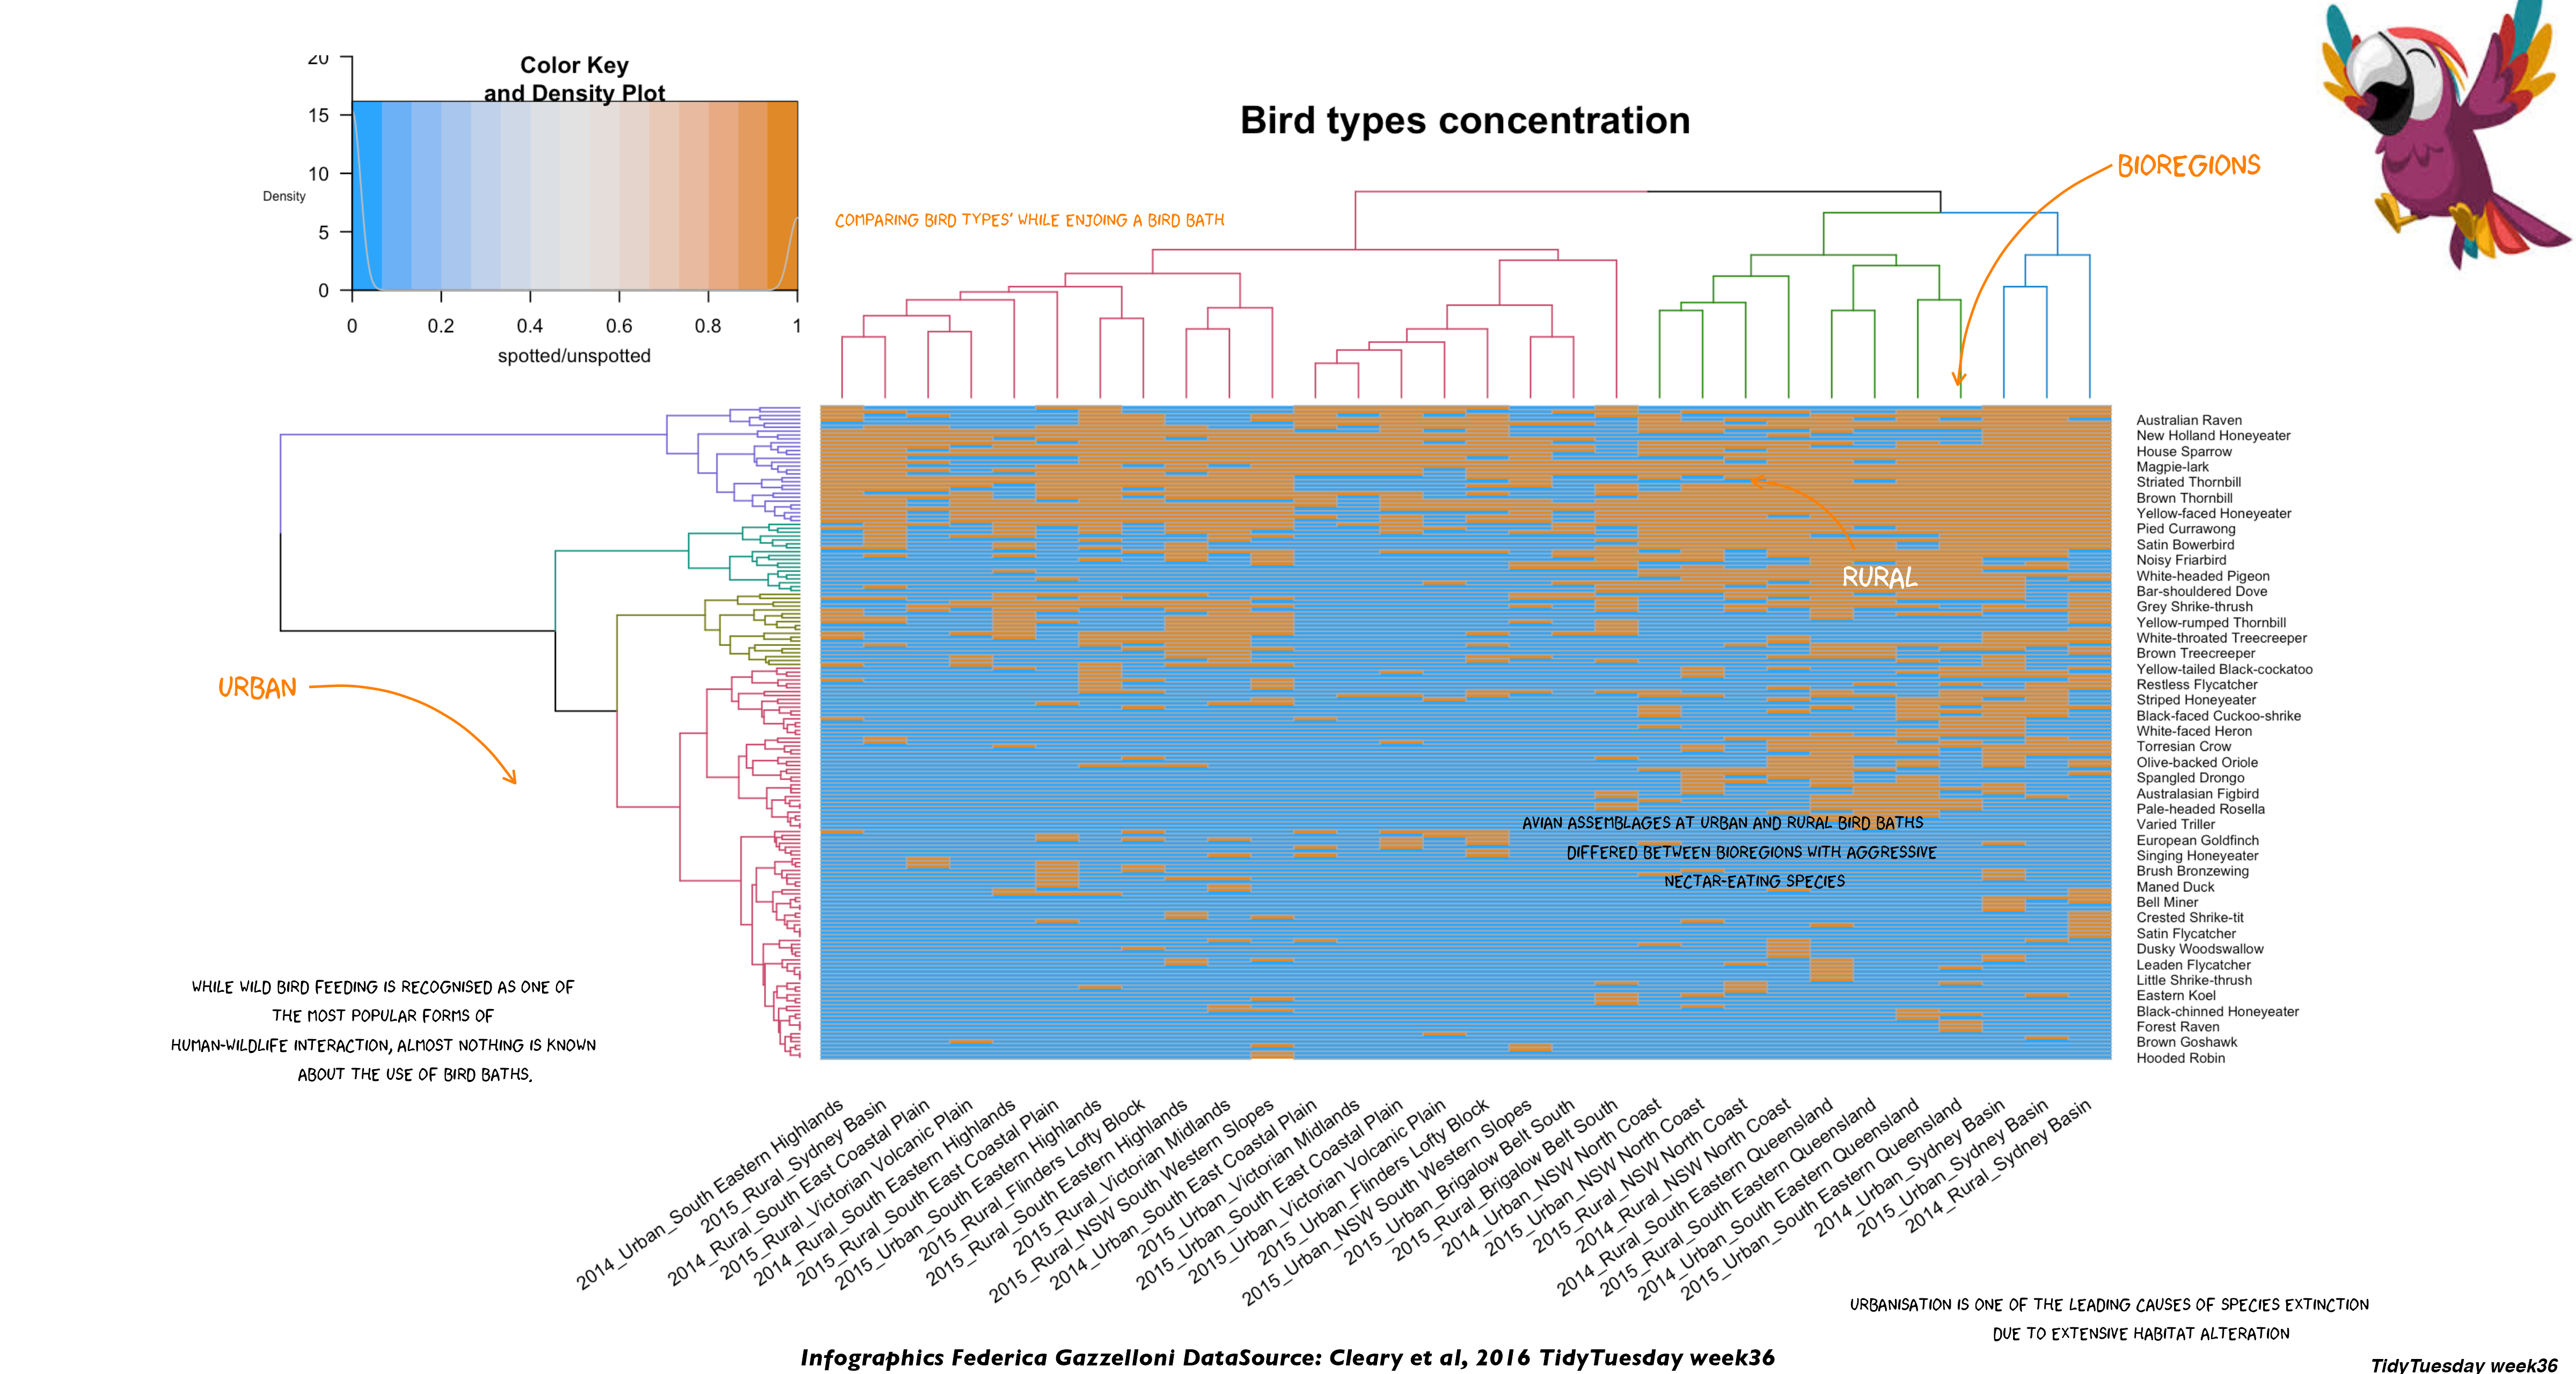
A visualization of bird species observed at bird baths using the TidyTuesday 2021 dataset.
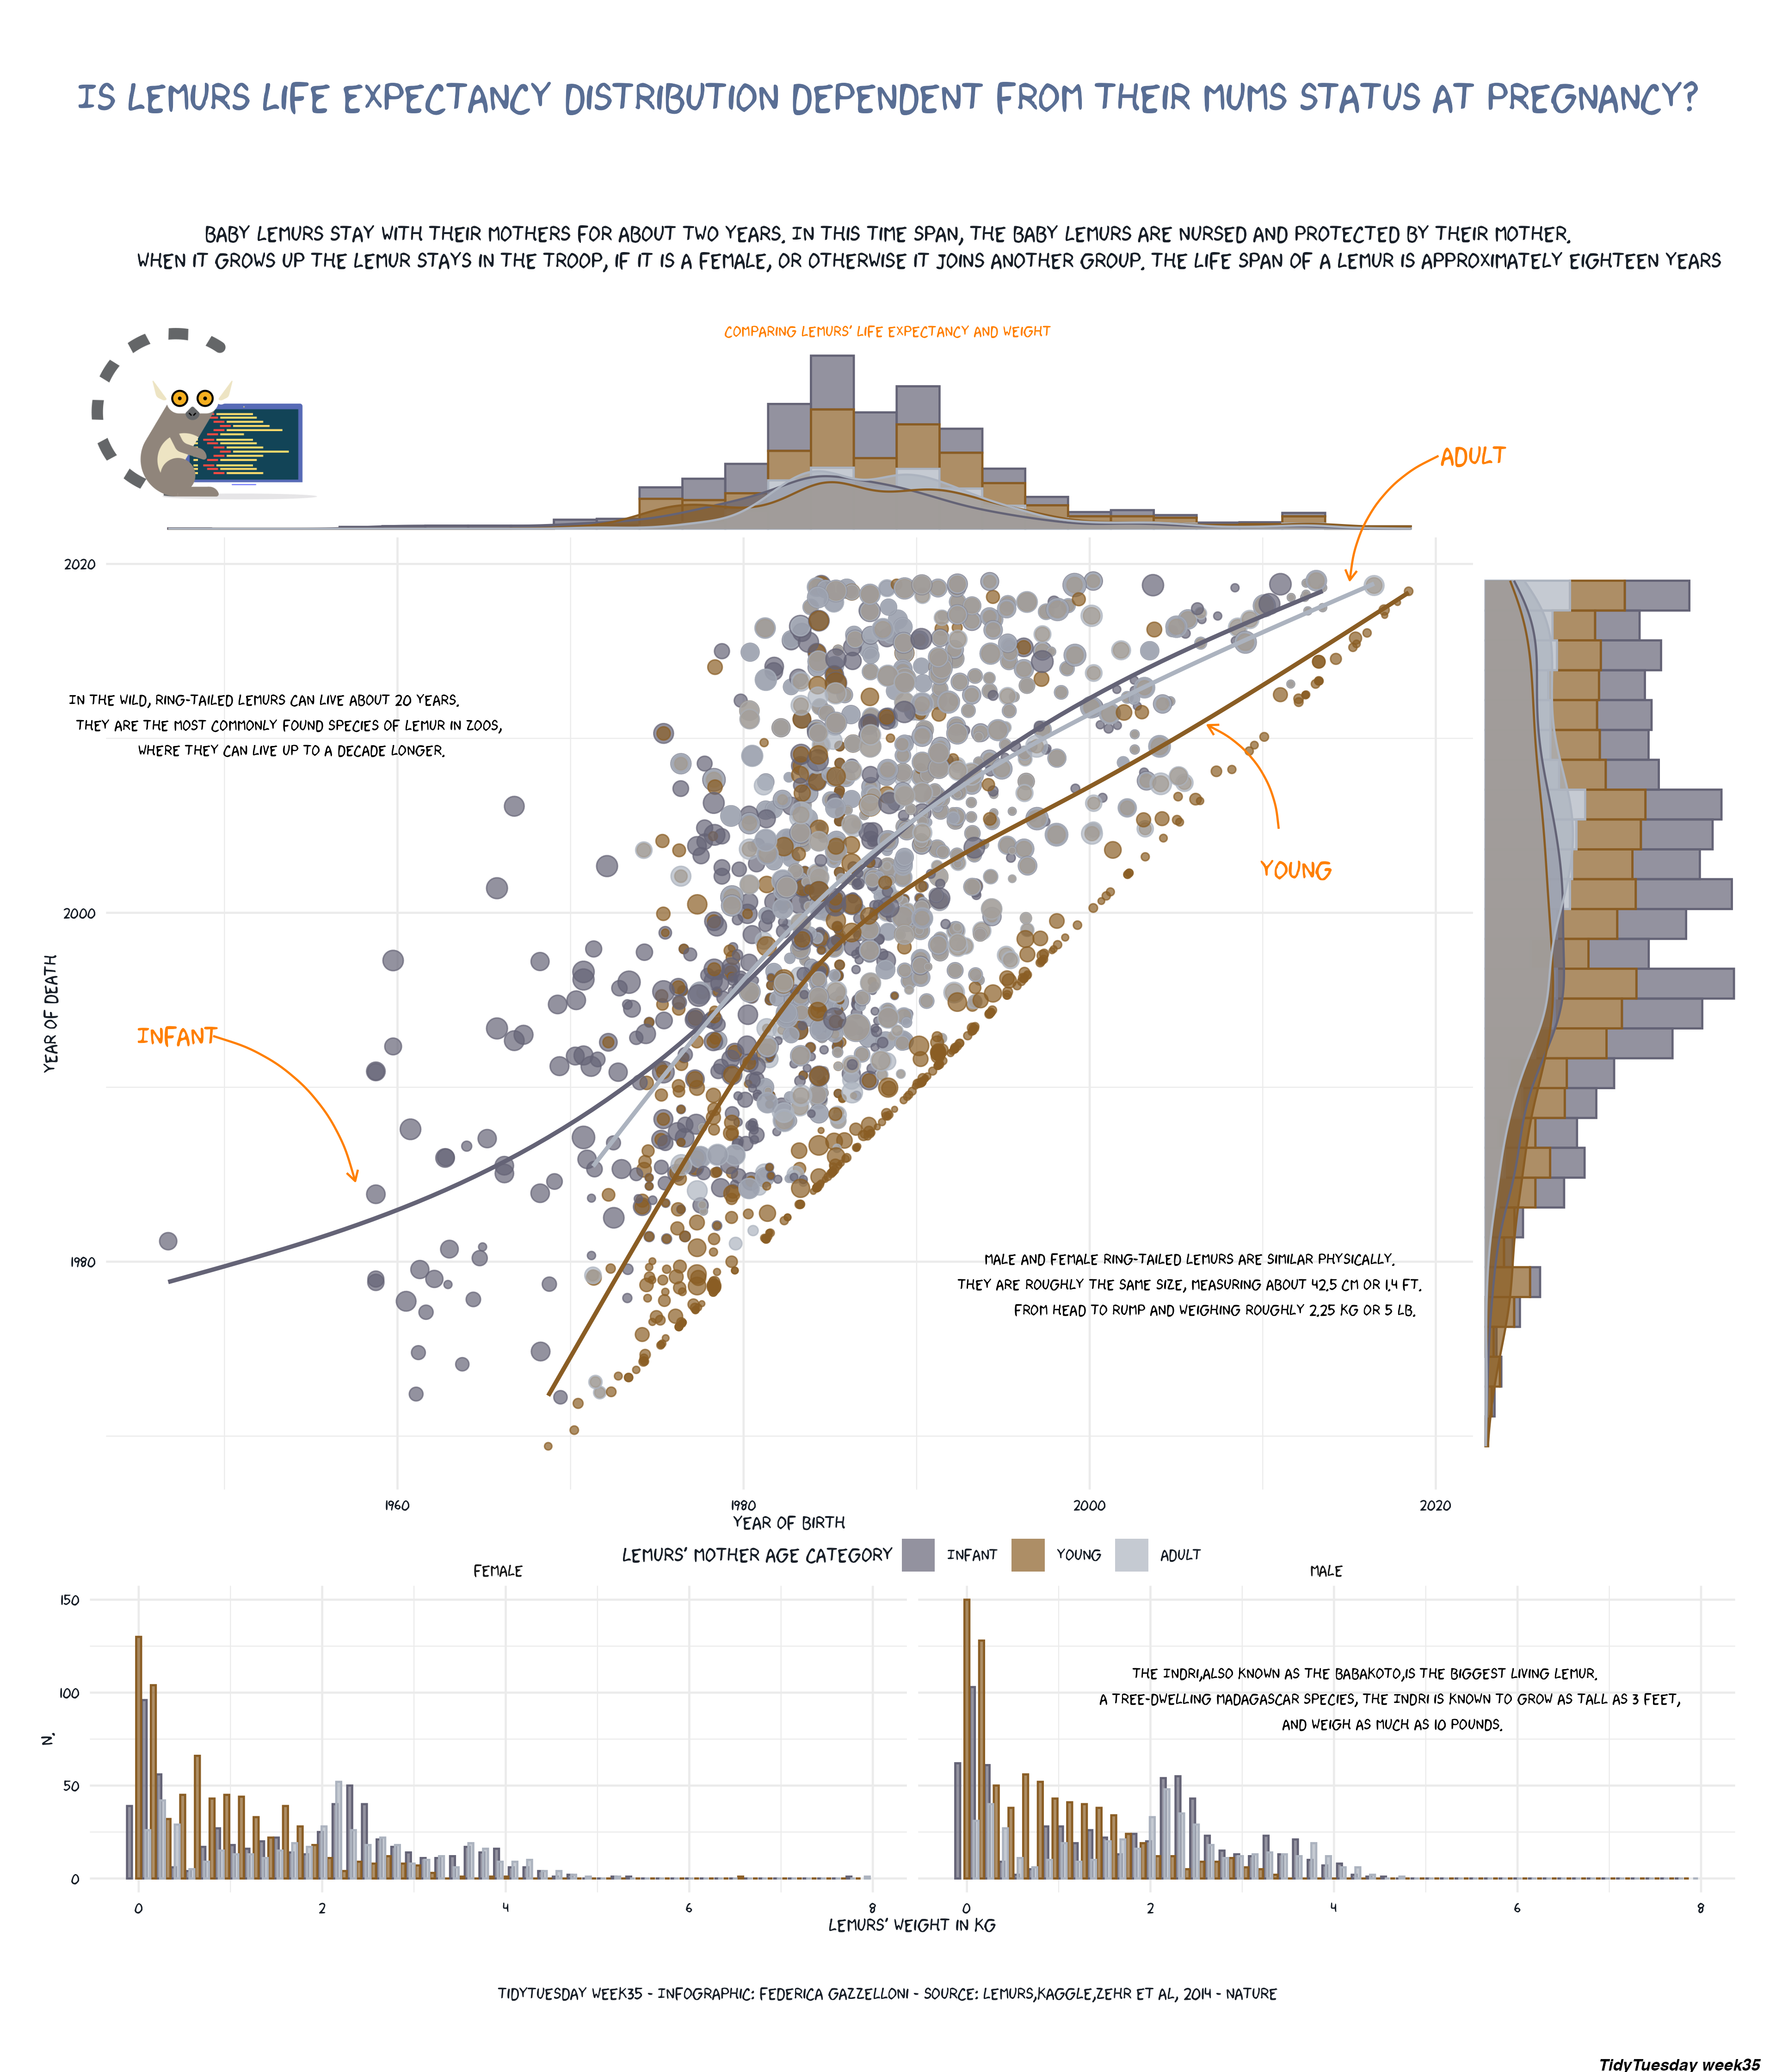
A visualization exploring lemur observations and characteristics in the TidyTuesday dataset.
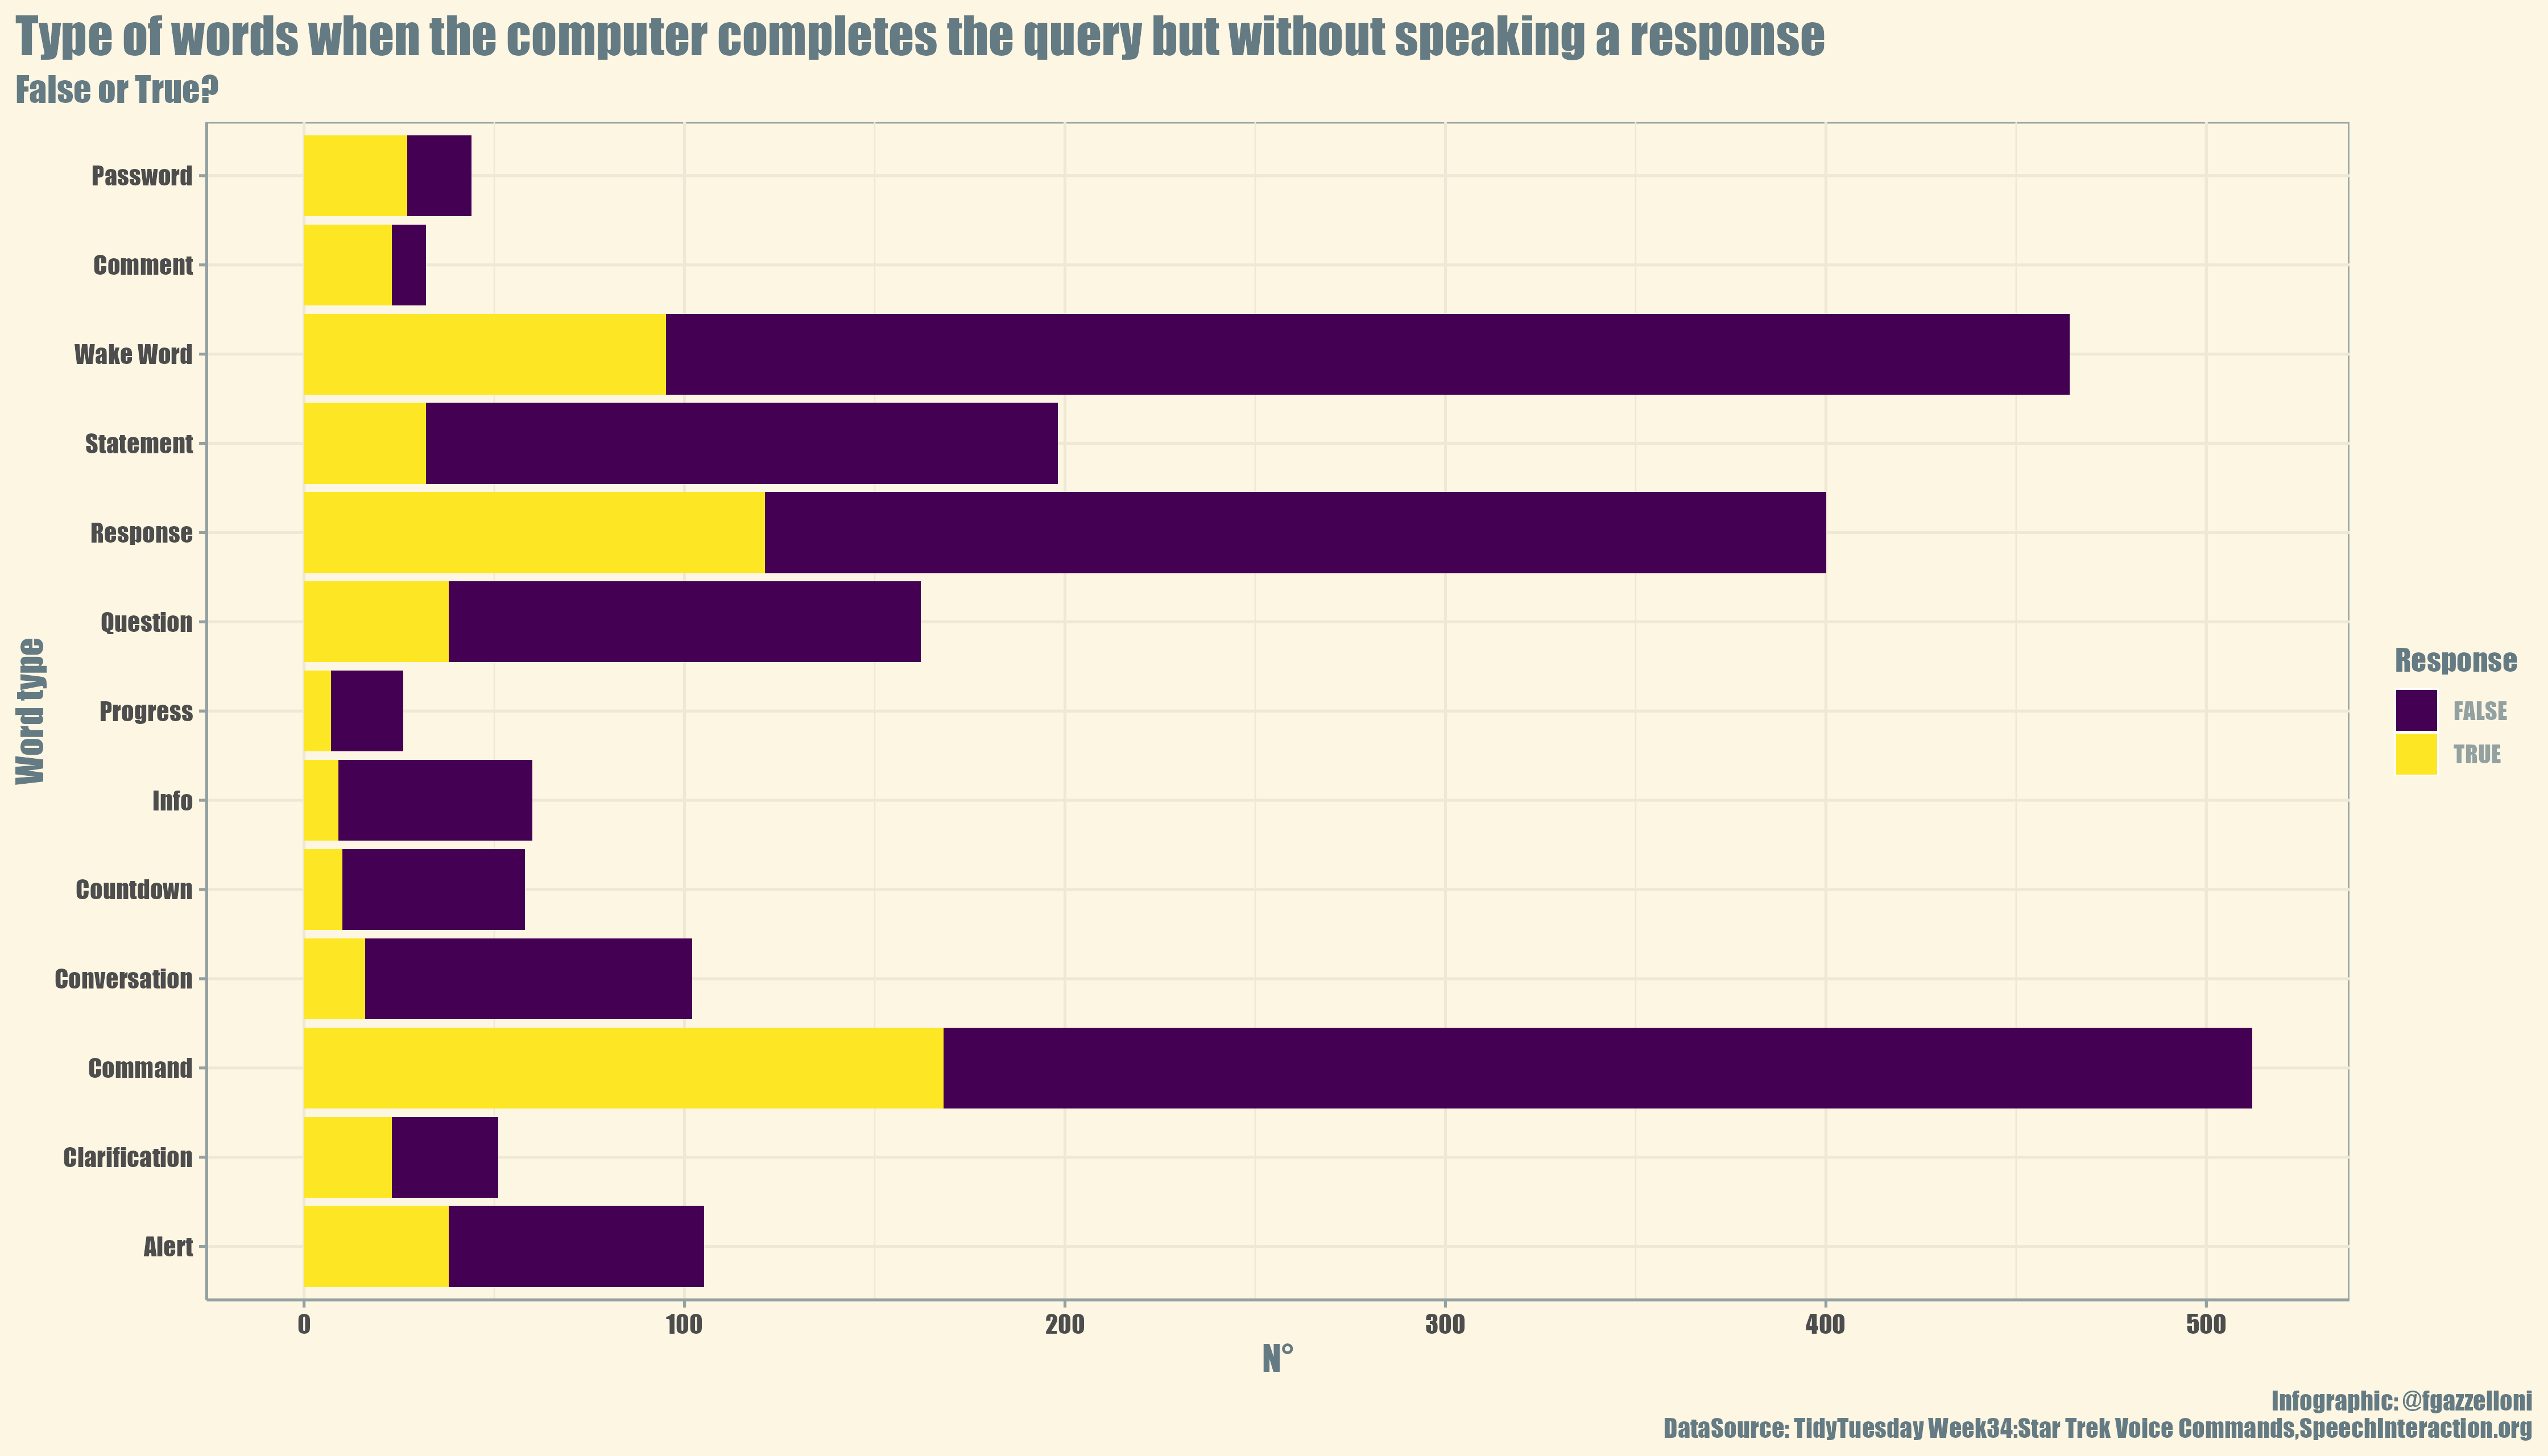
A visualization of Star Trek voice commands, exploring how voice-interface requests match user expectations.
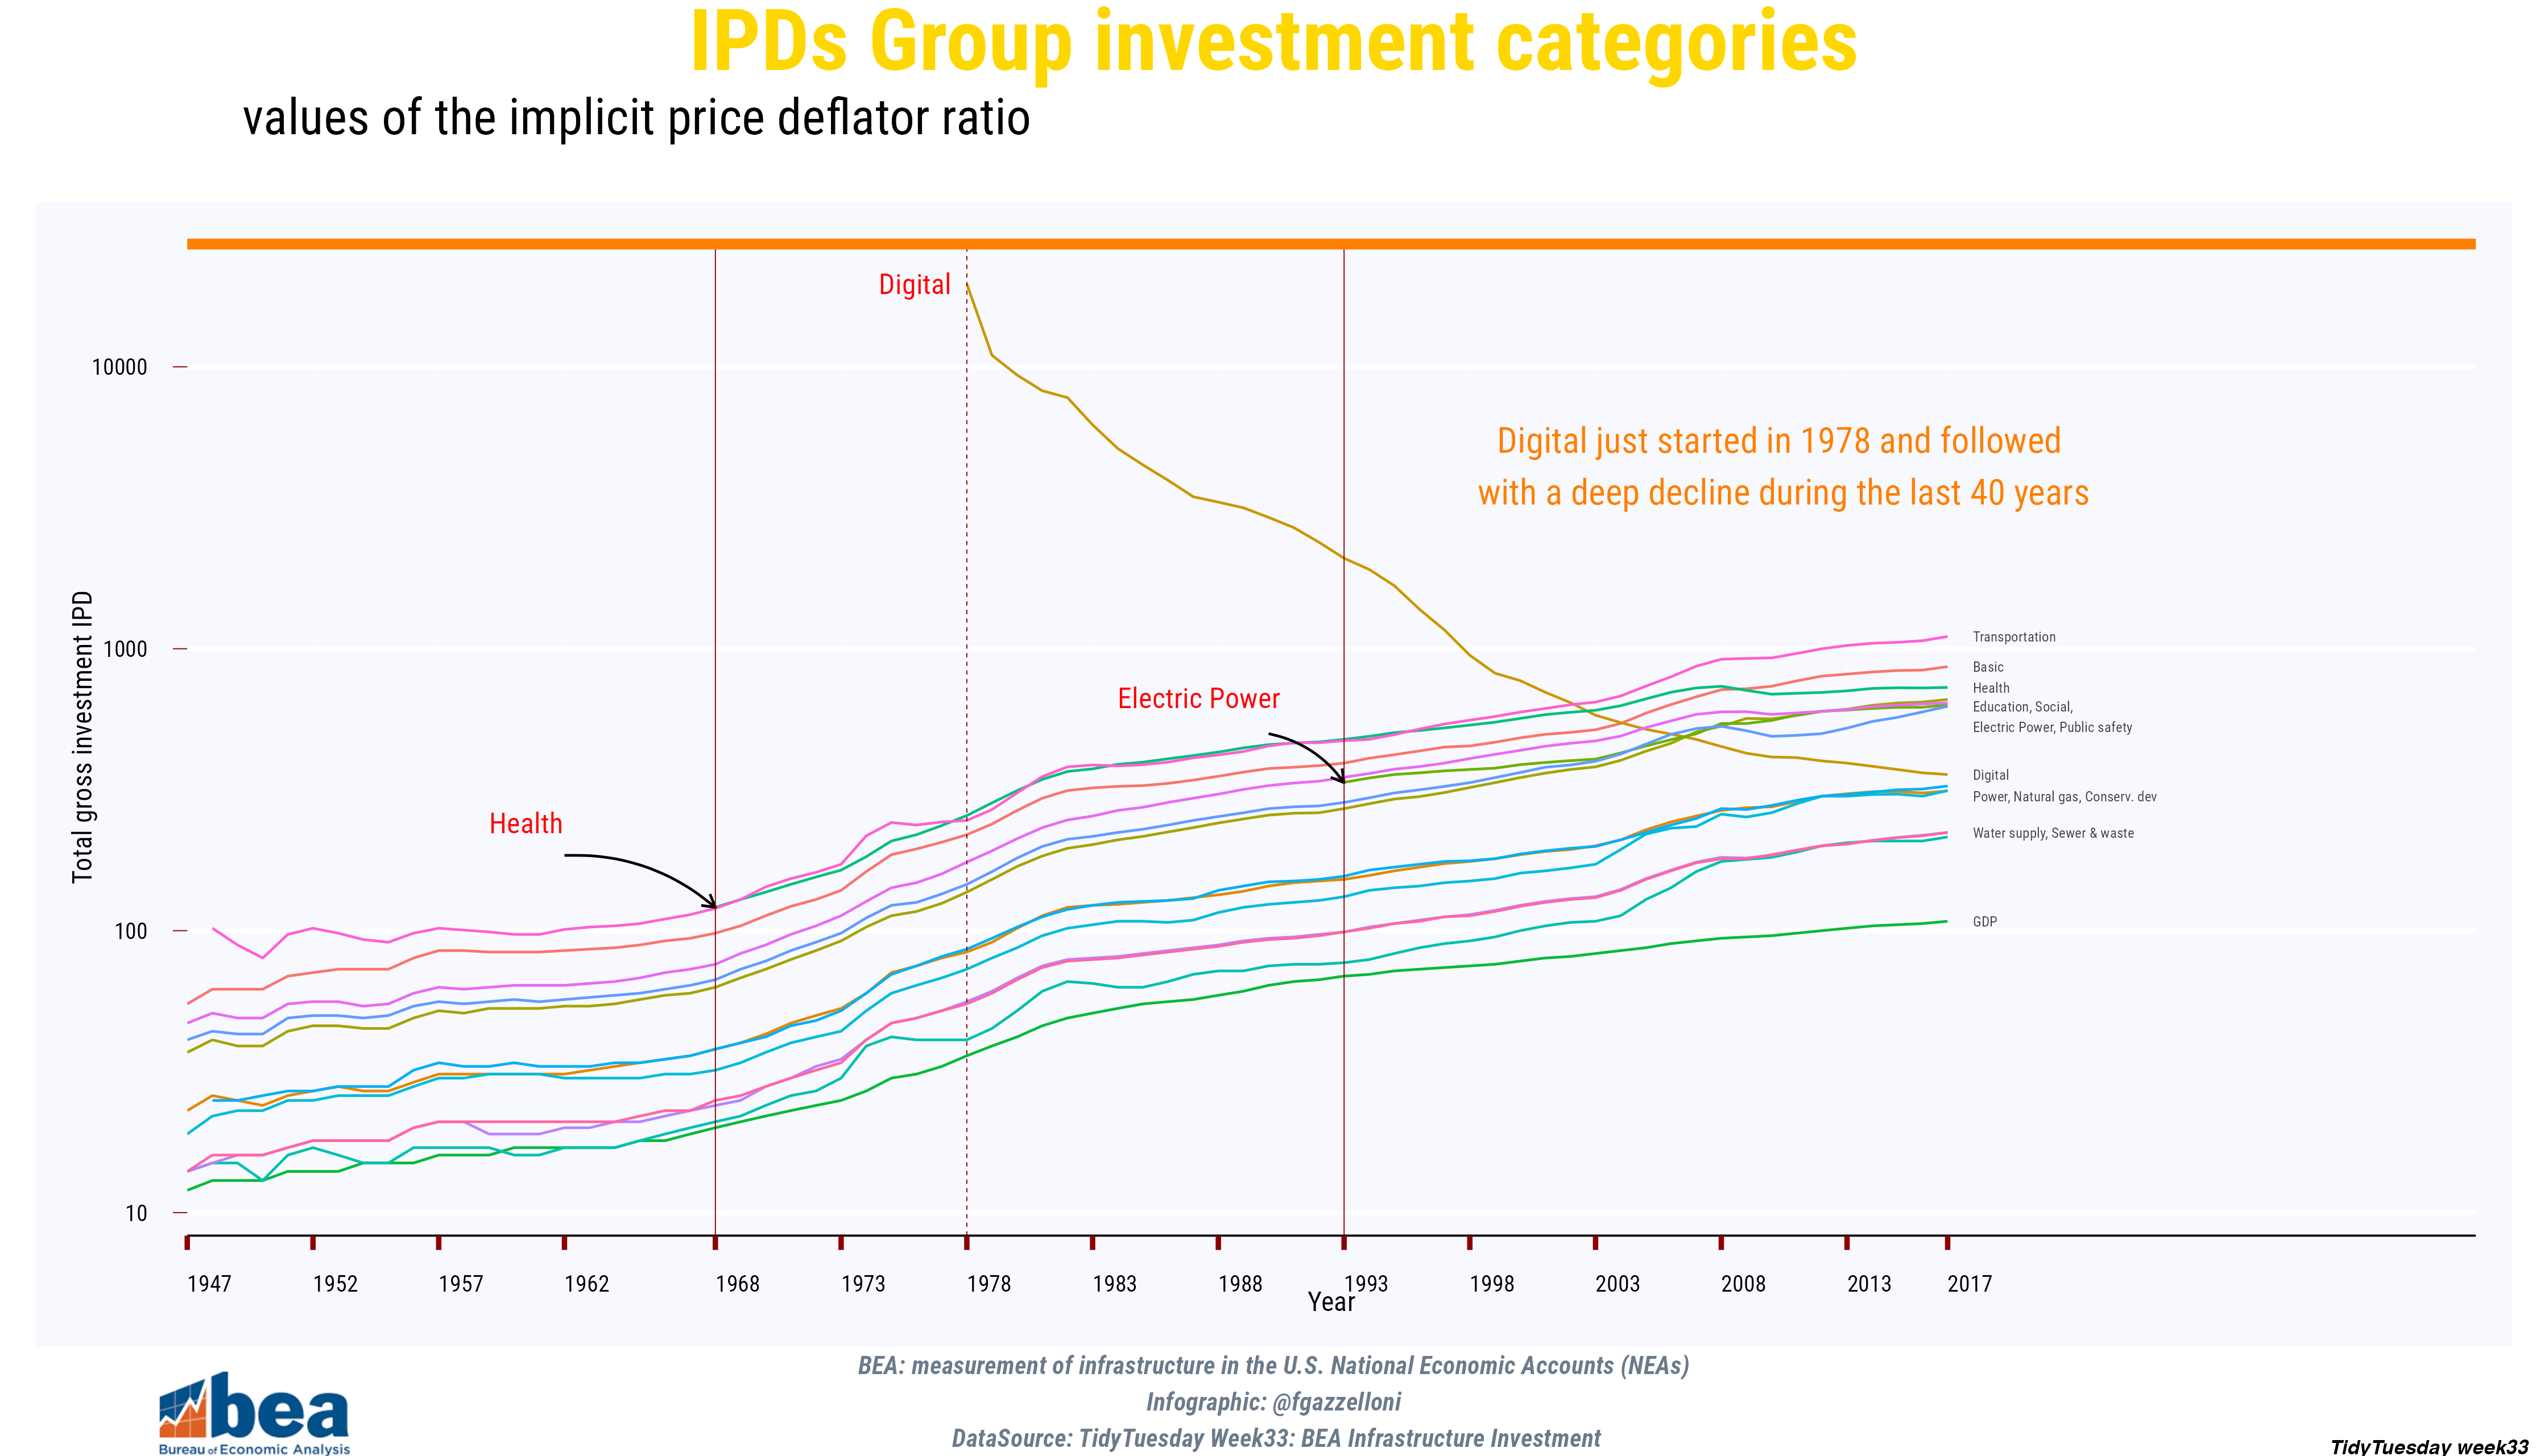
A visualization of US infrastructure investment by type and year, using Bureau of Economic Analysis measures.
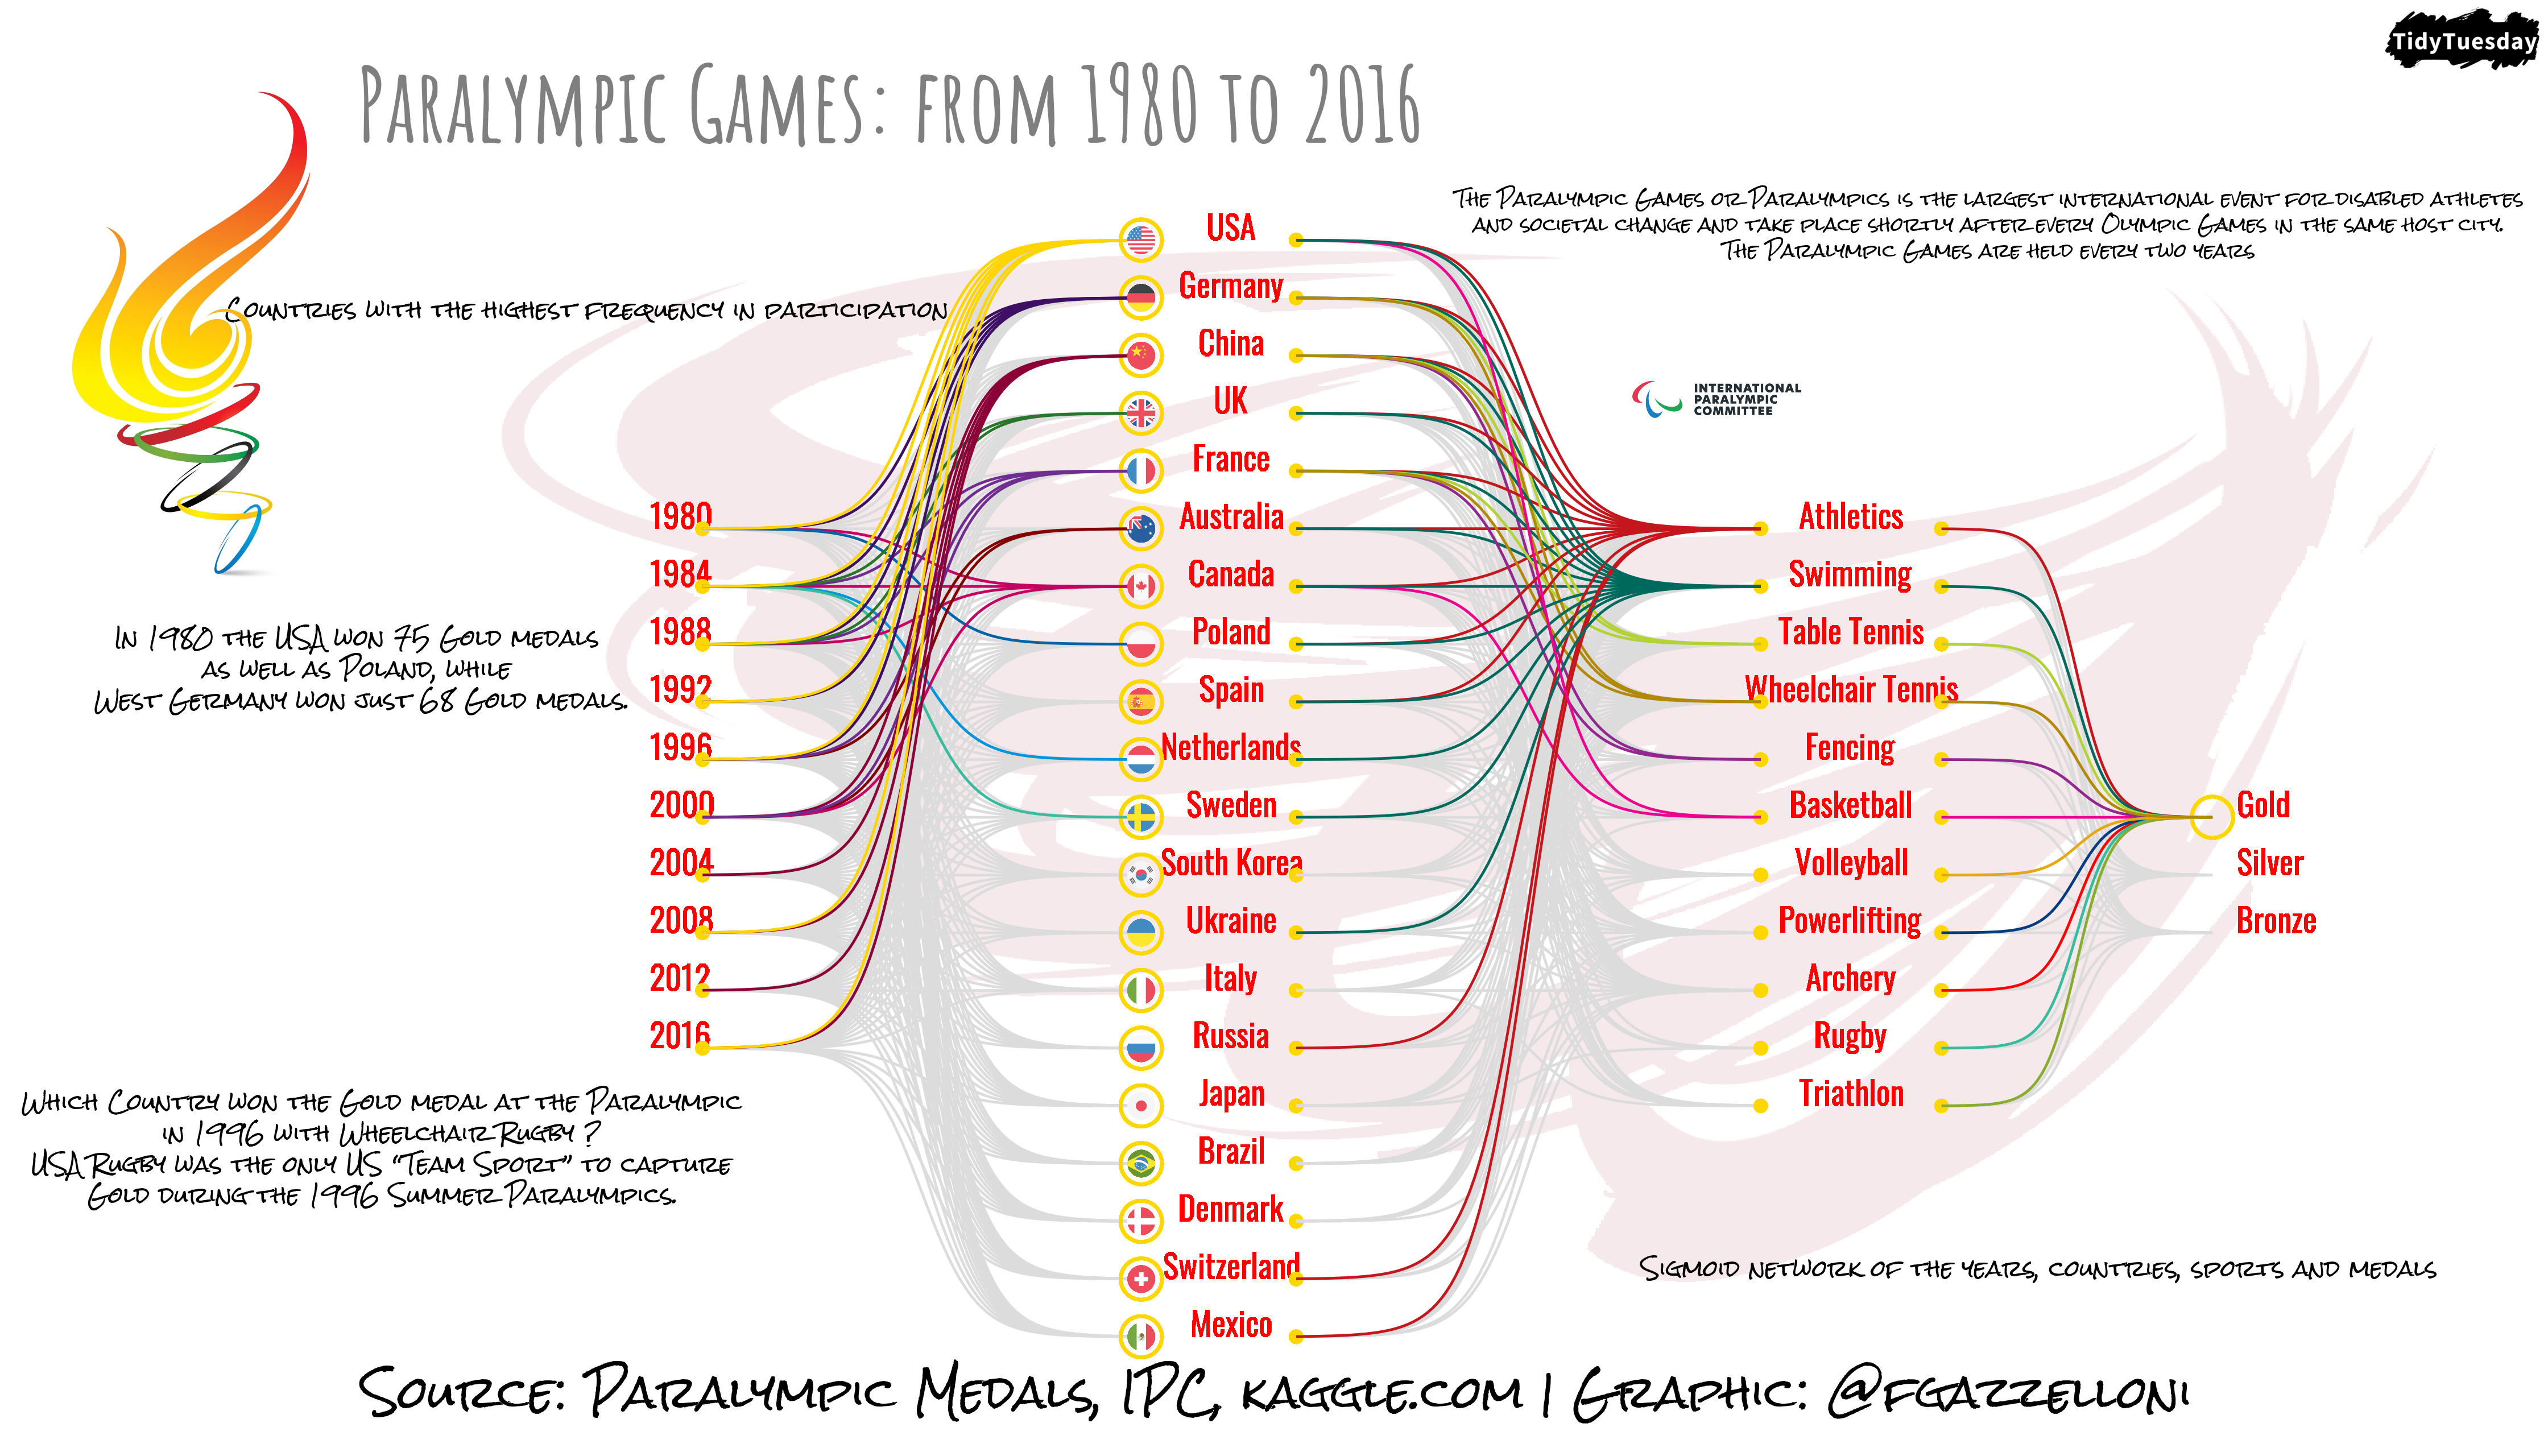
A visualization of Paralympic medal results across athletes, countries, and events.
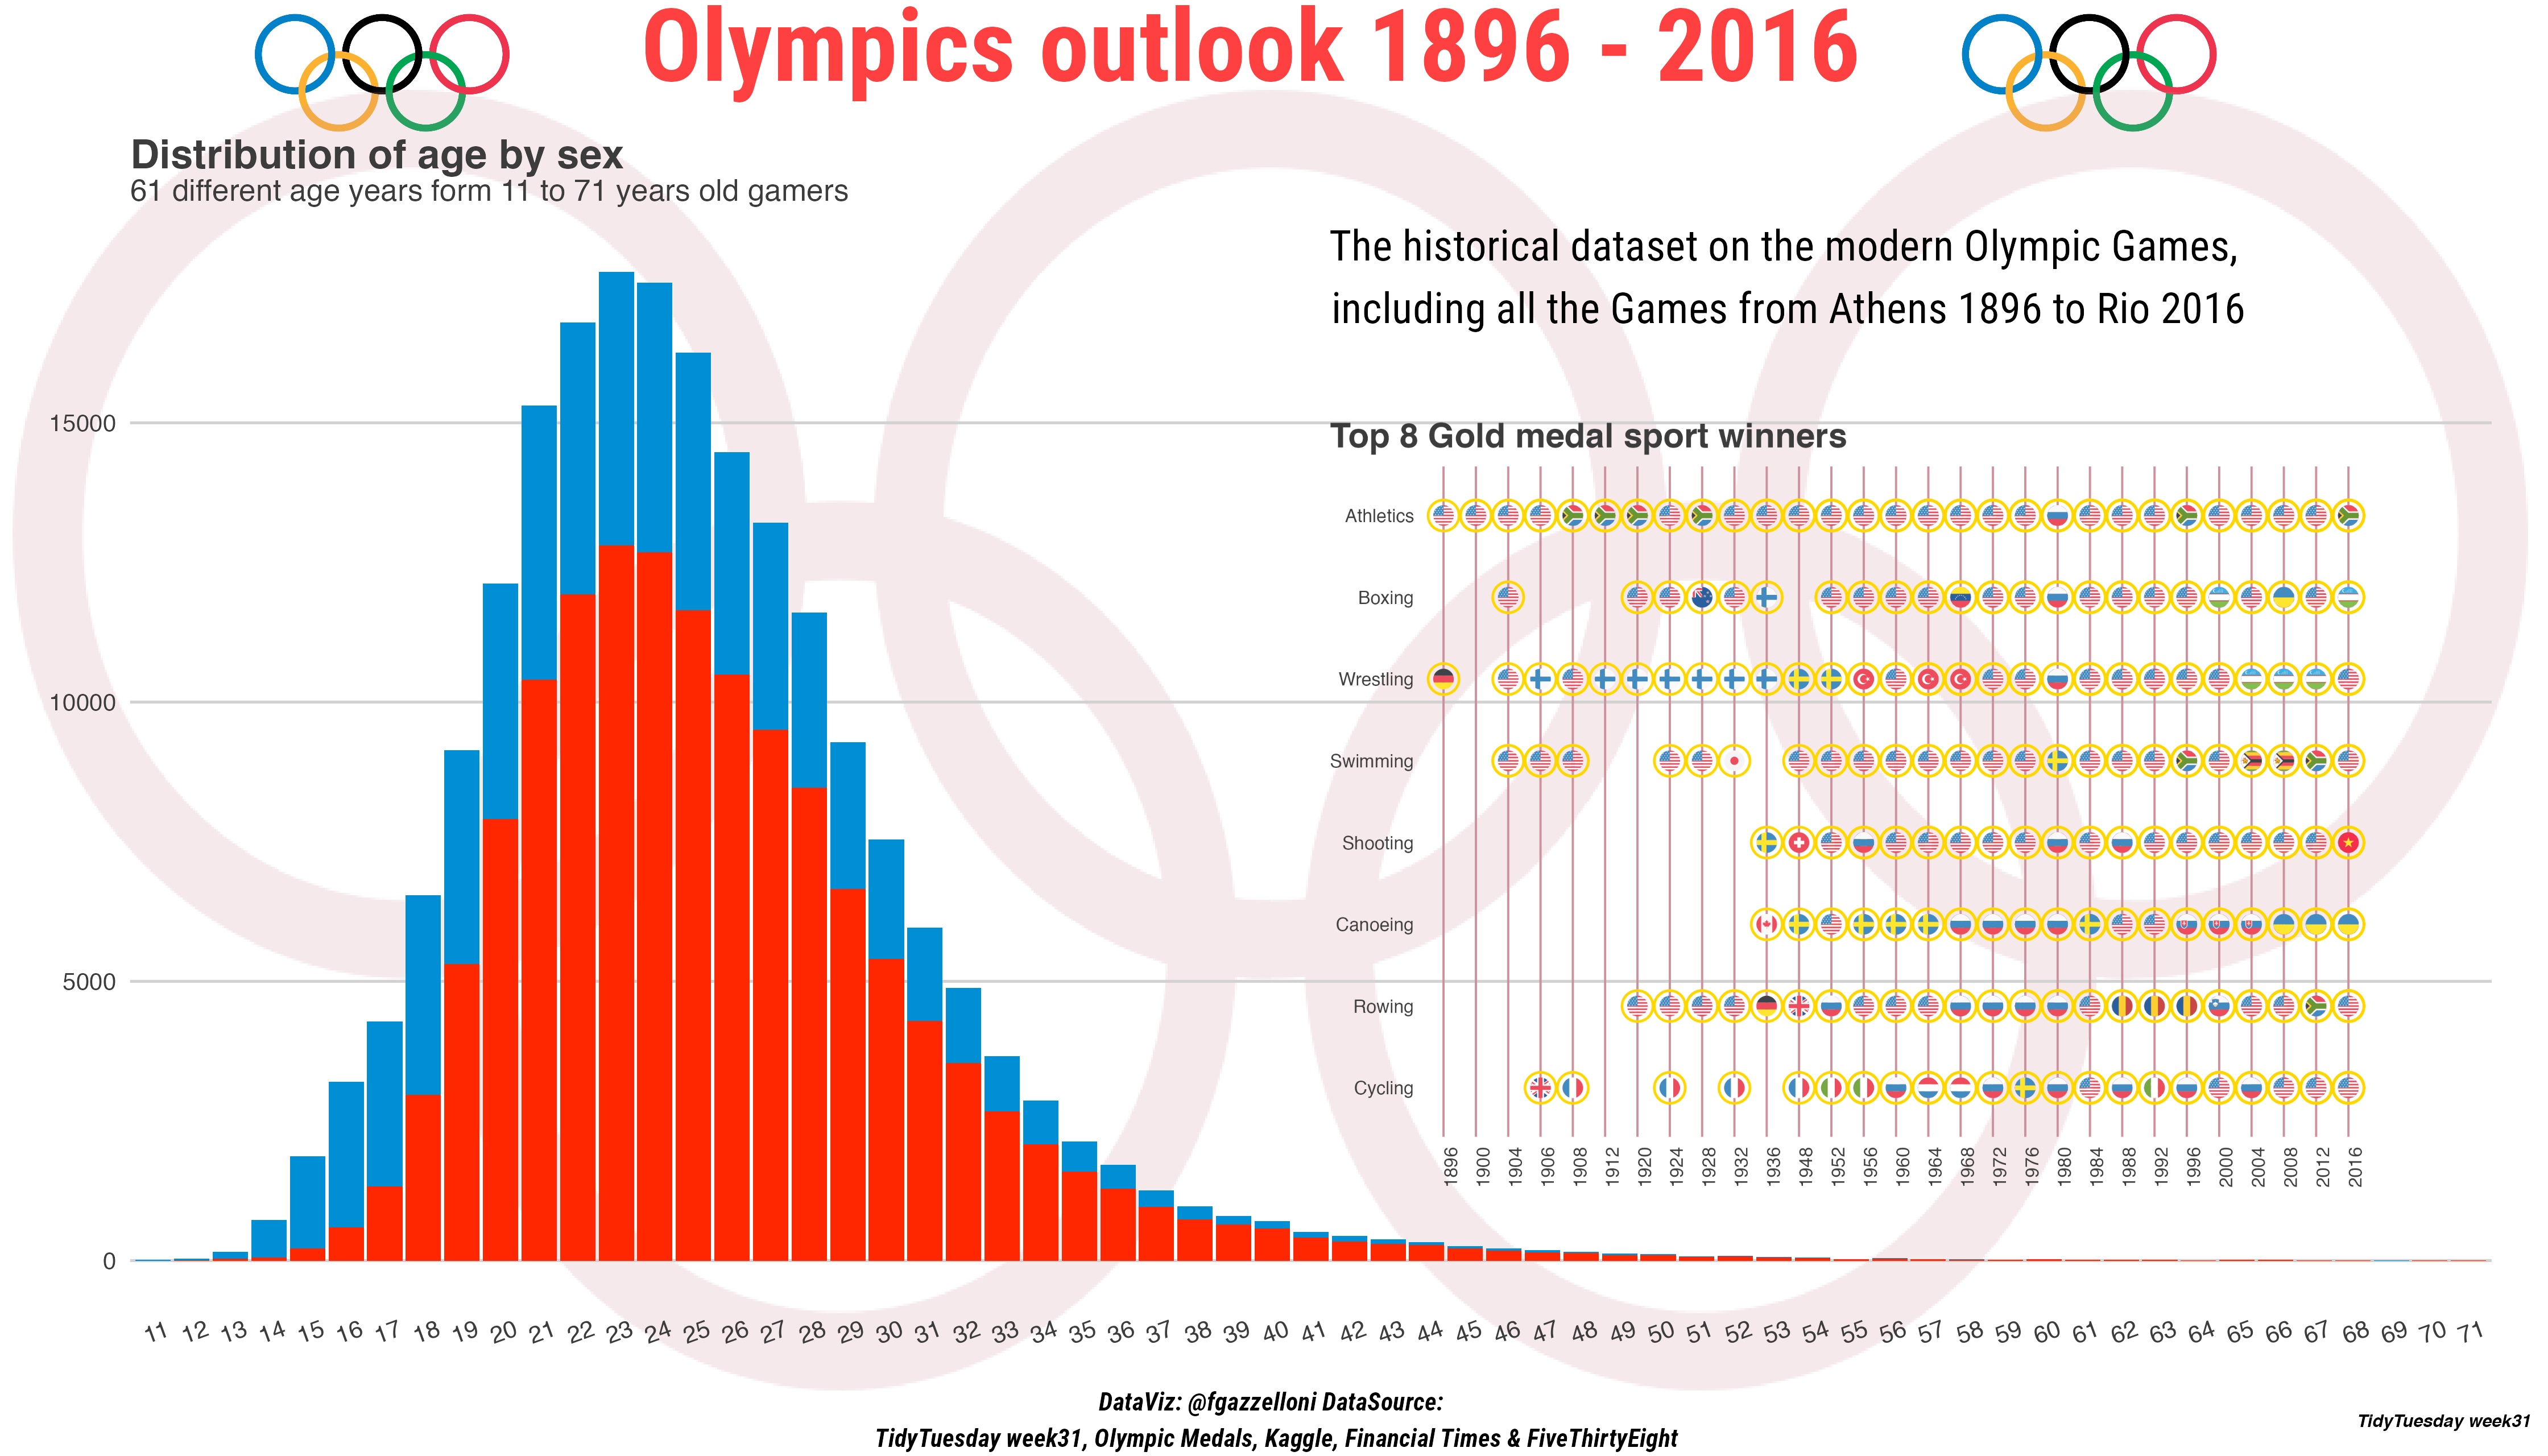
A comparison of Olympic medal results across countries, events, and years.
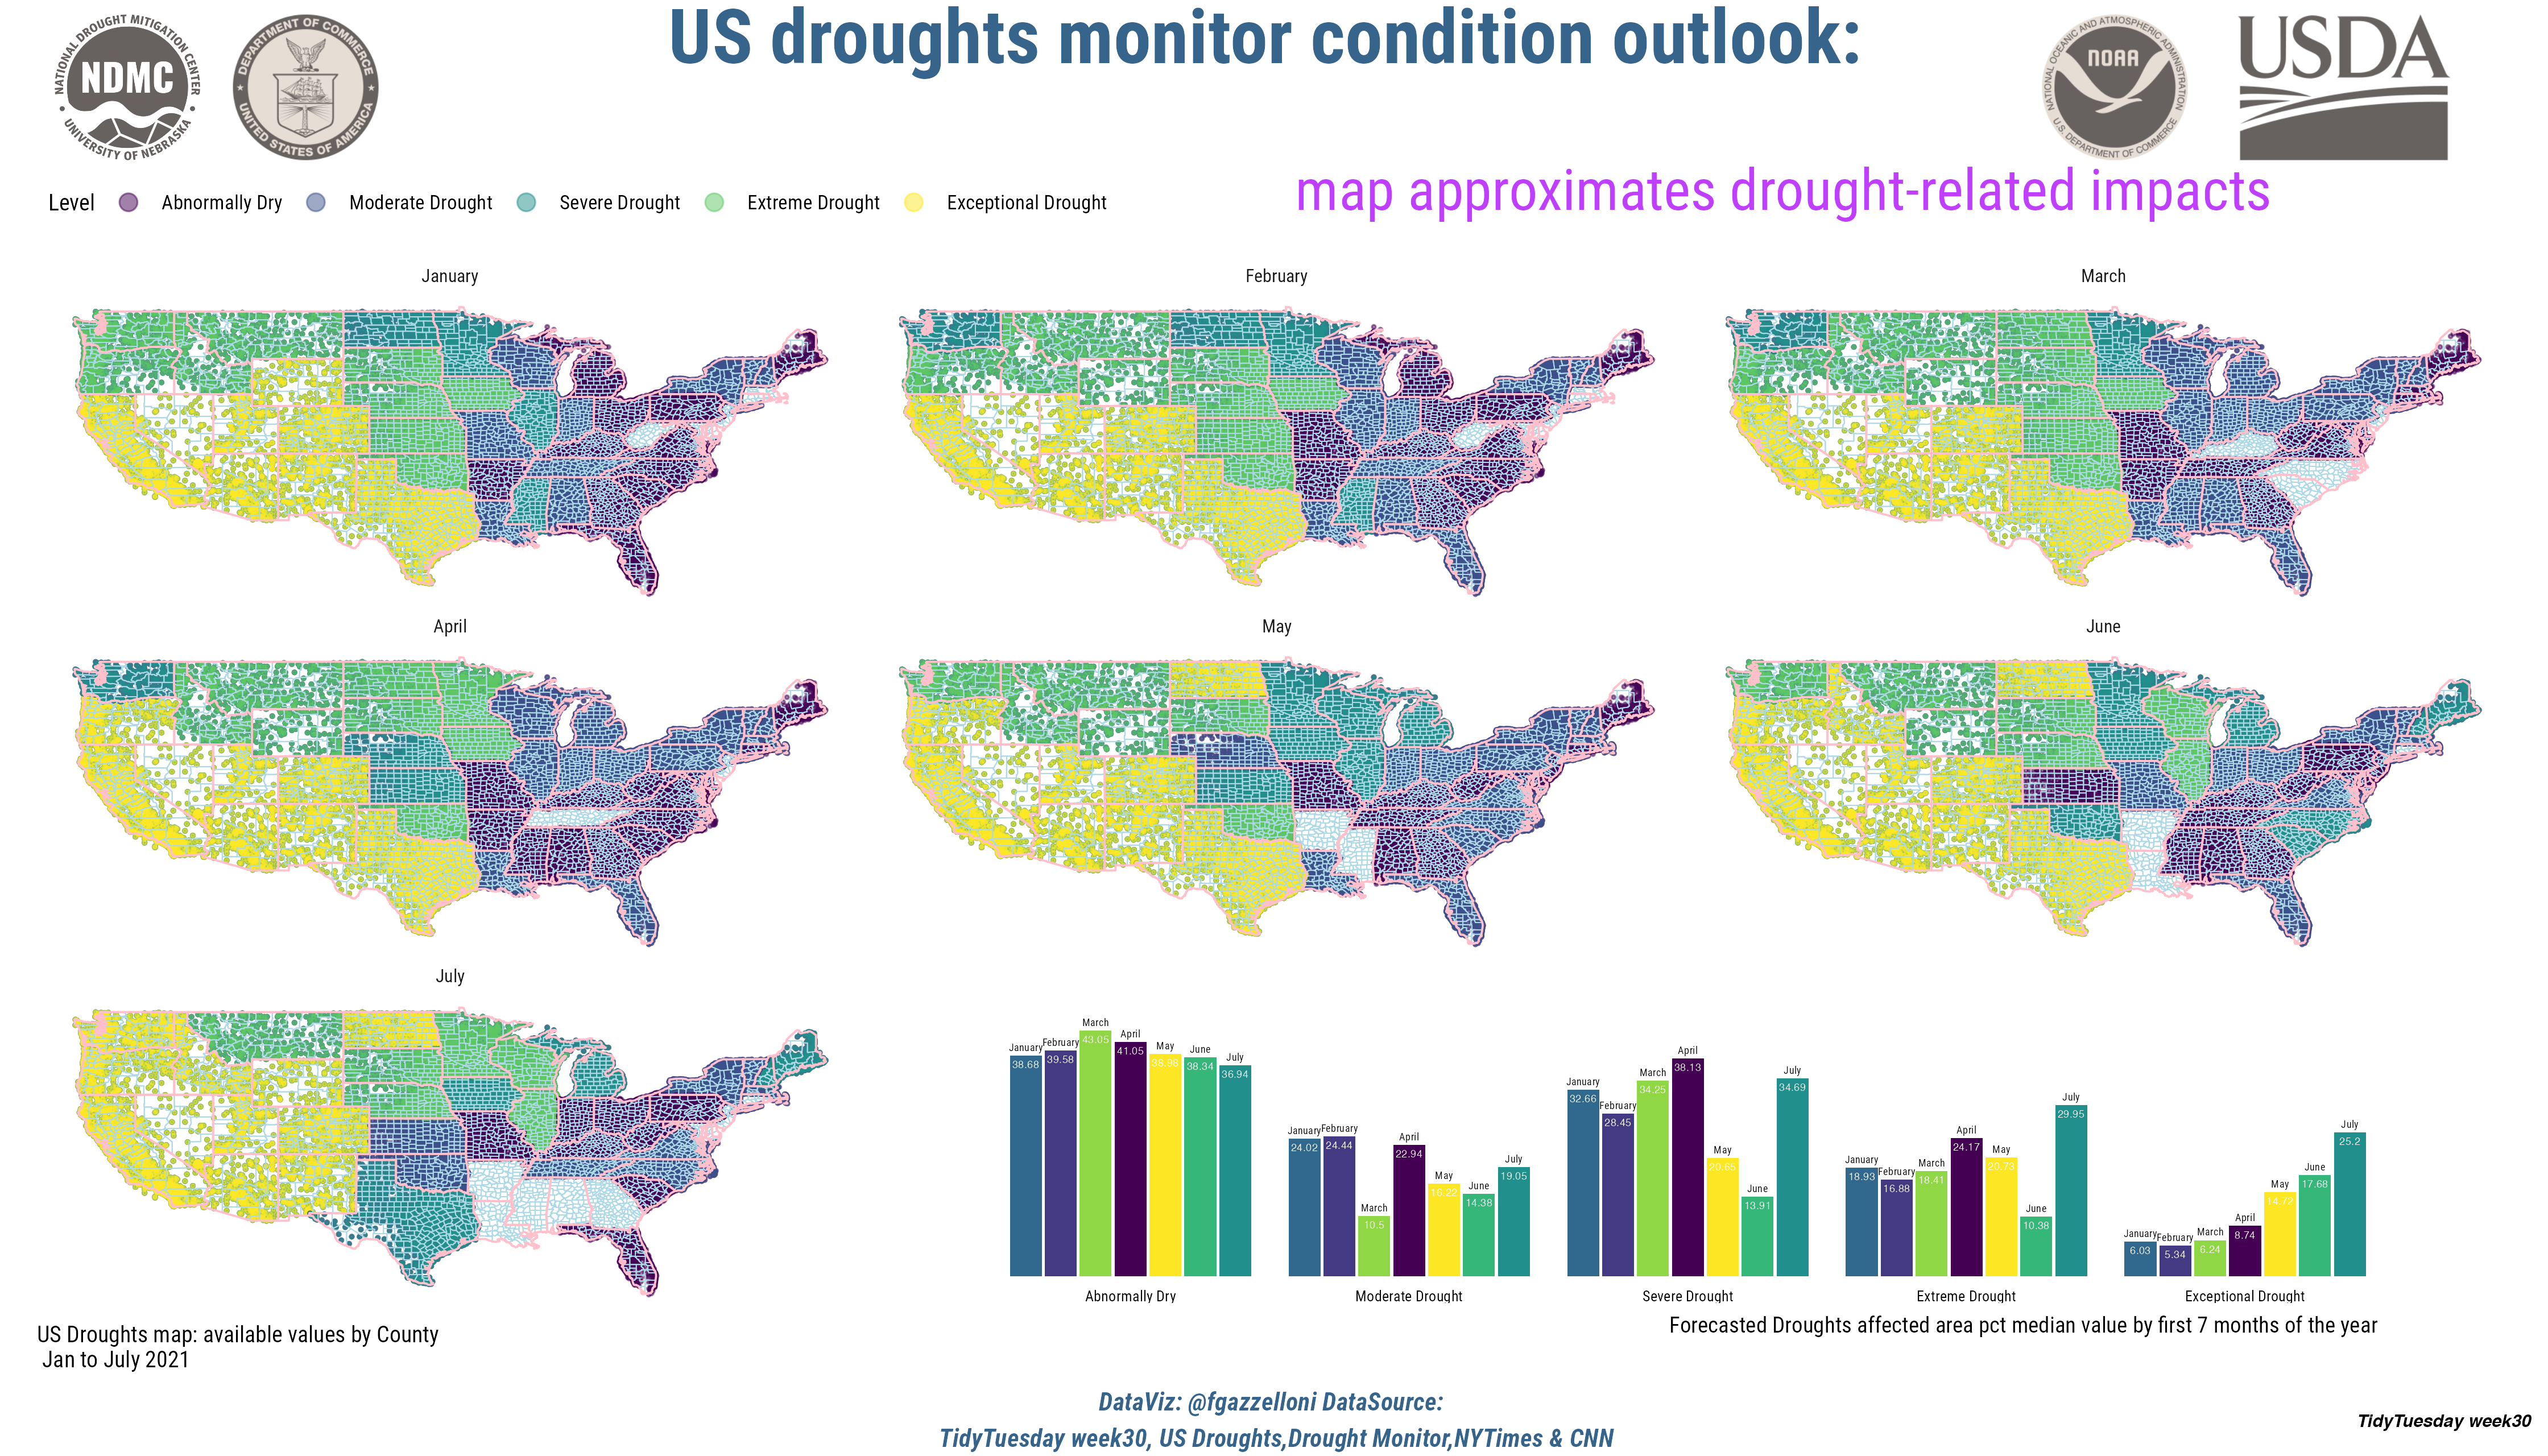
A map-based view of drought conditions across the United States using TidyTuesday data.
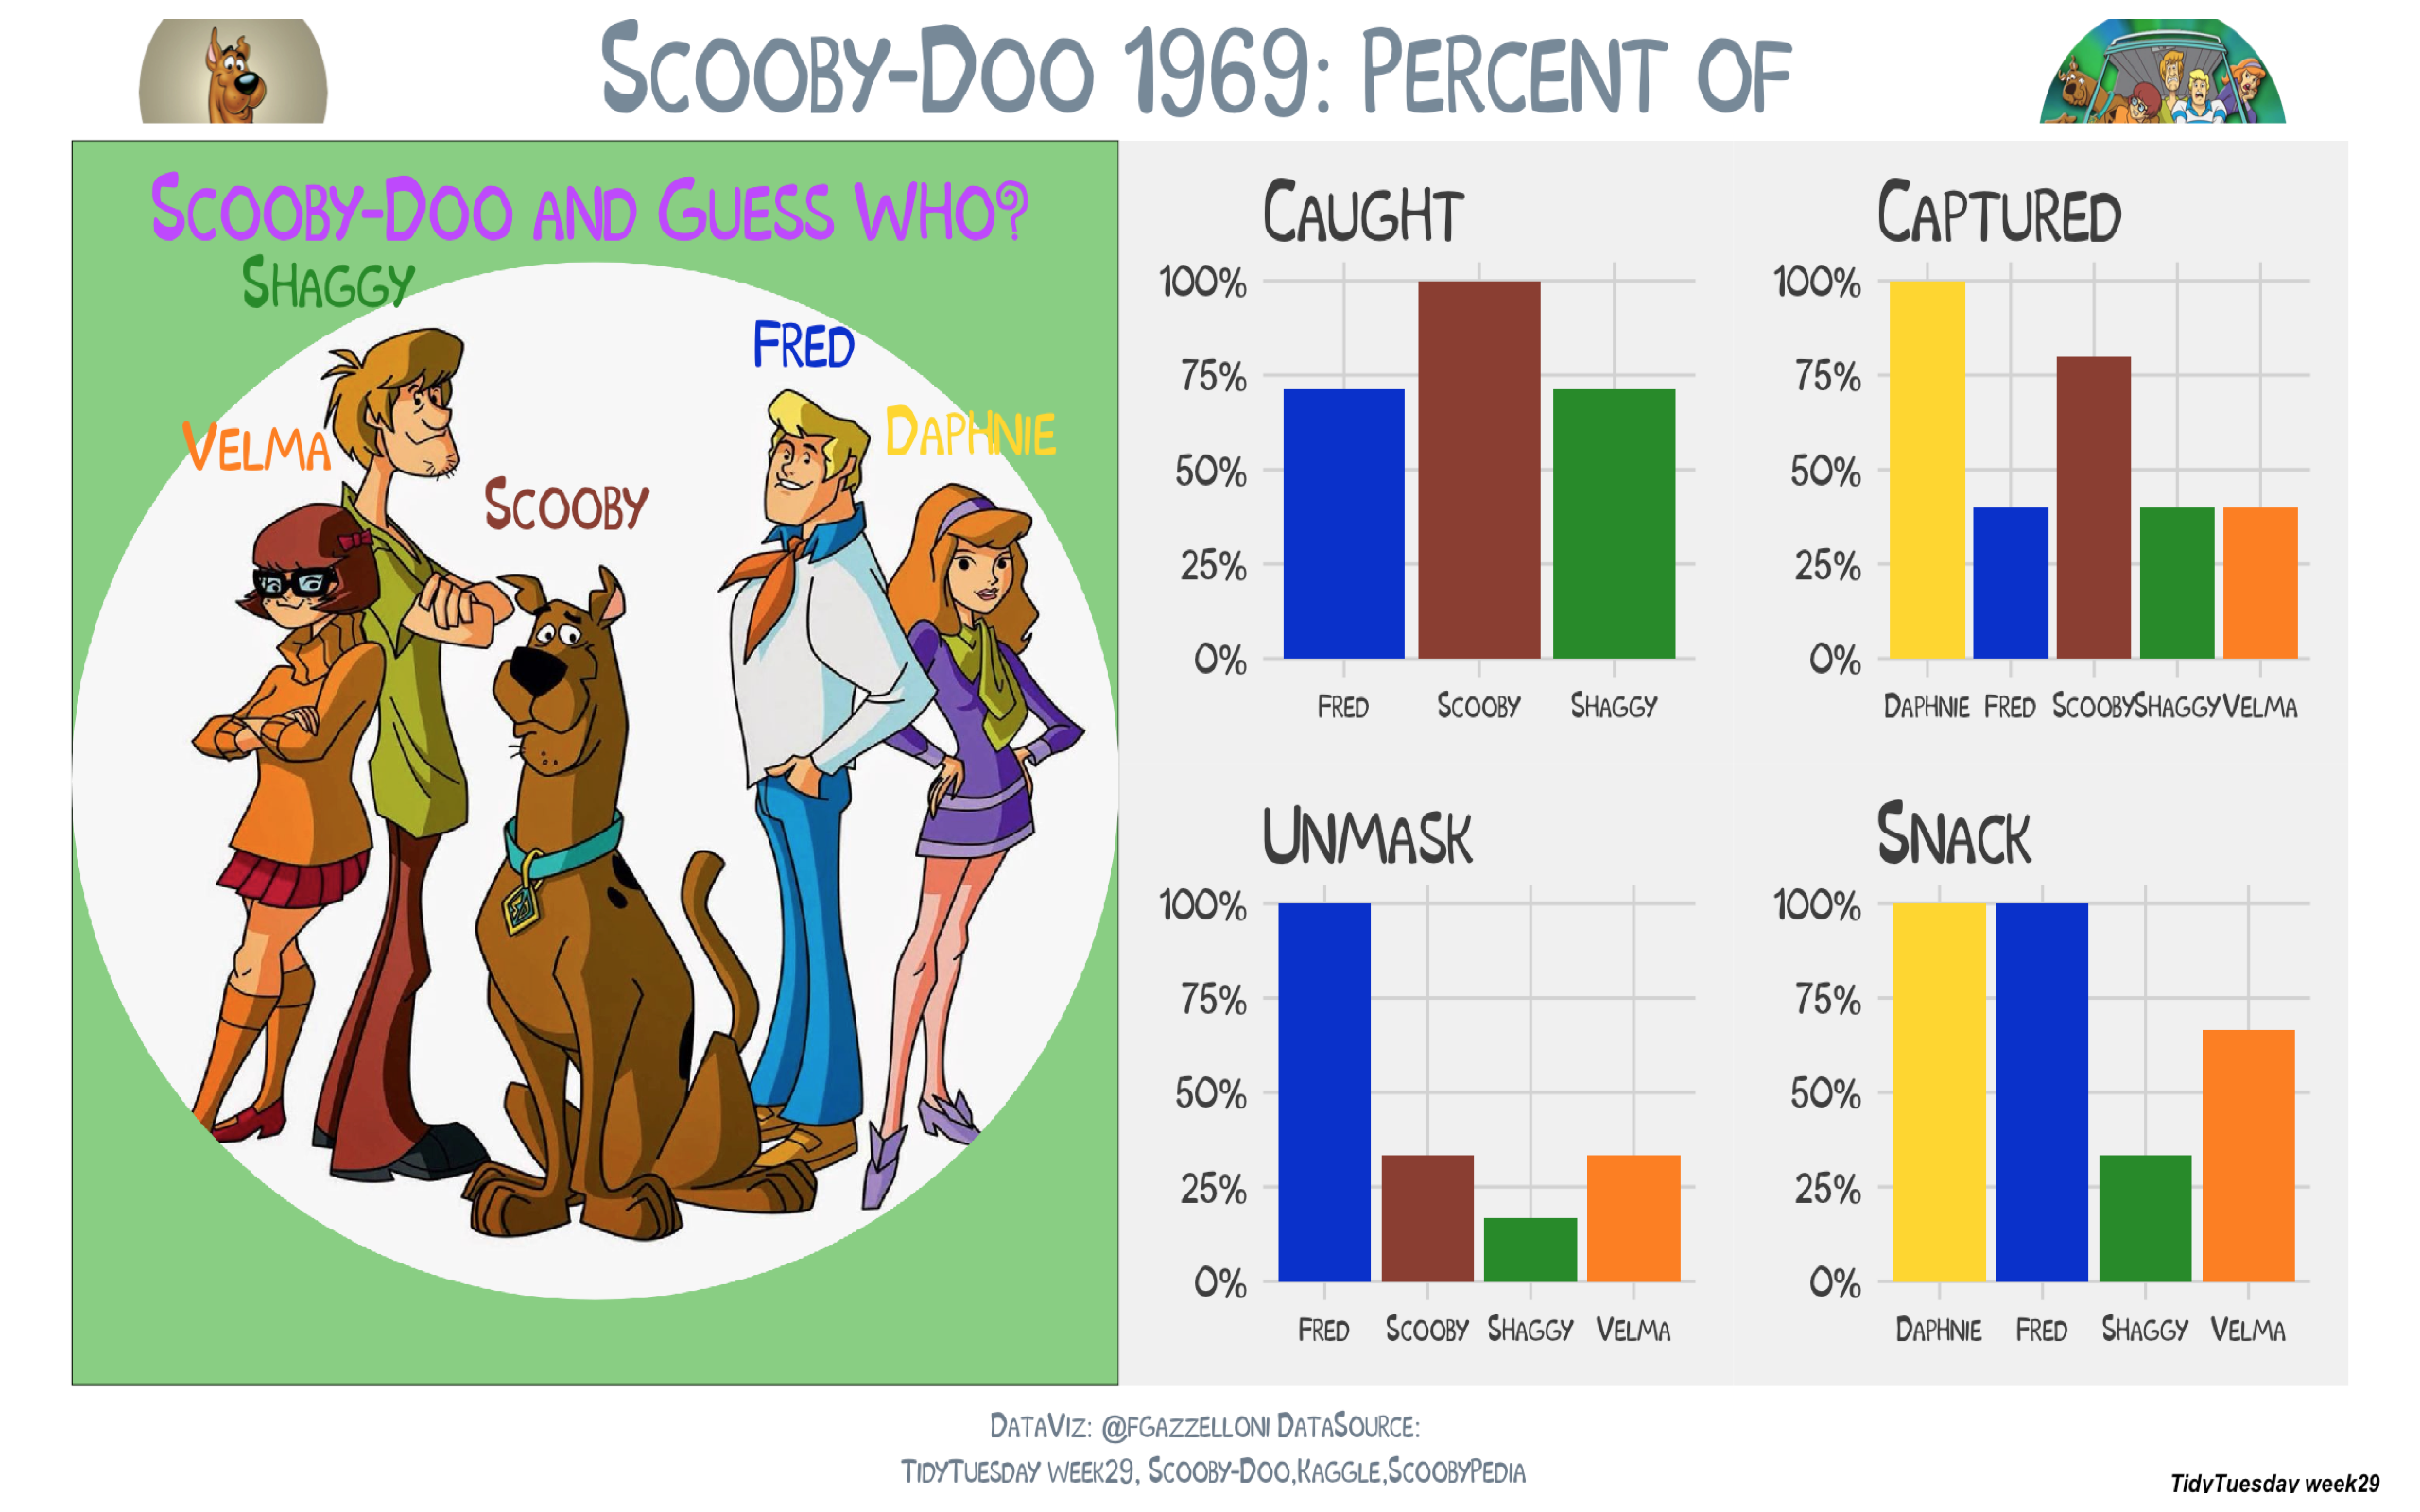
A visualization exploring characters and appearances in the Scooby-Doo series.
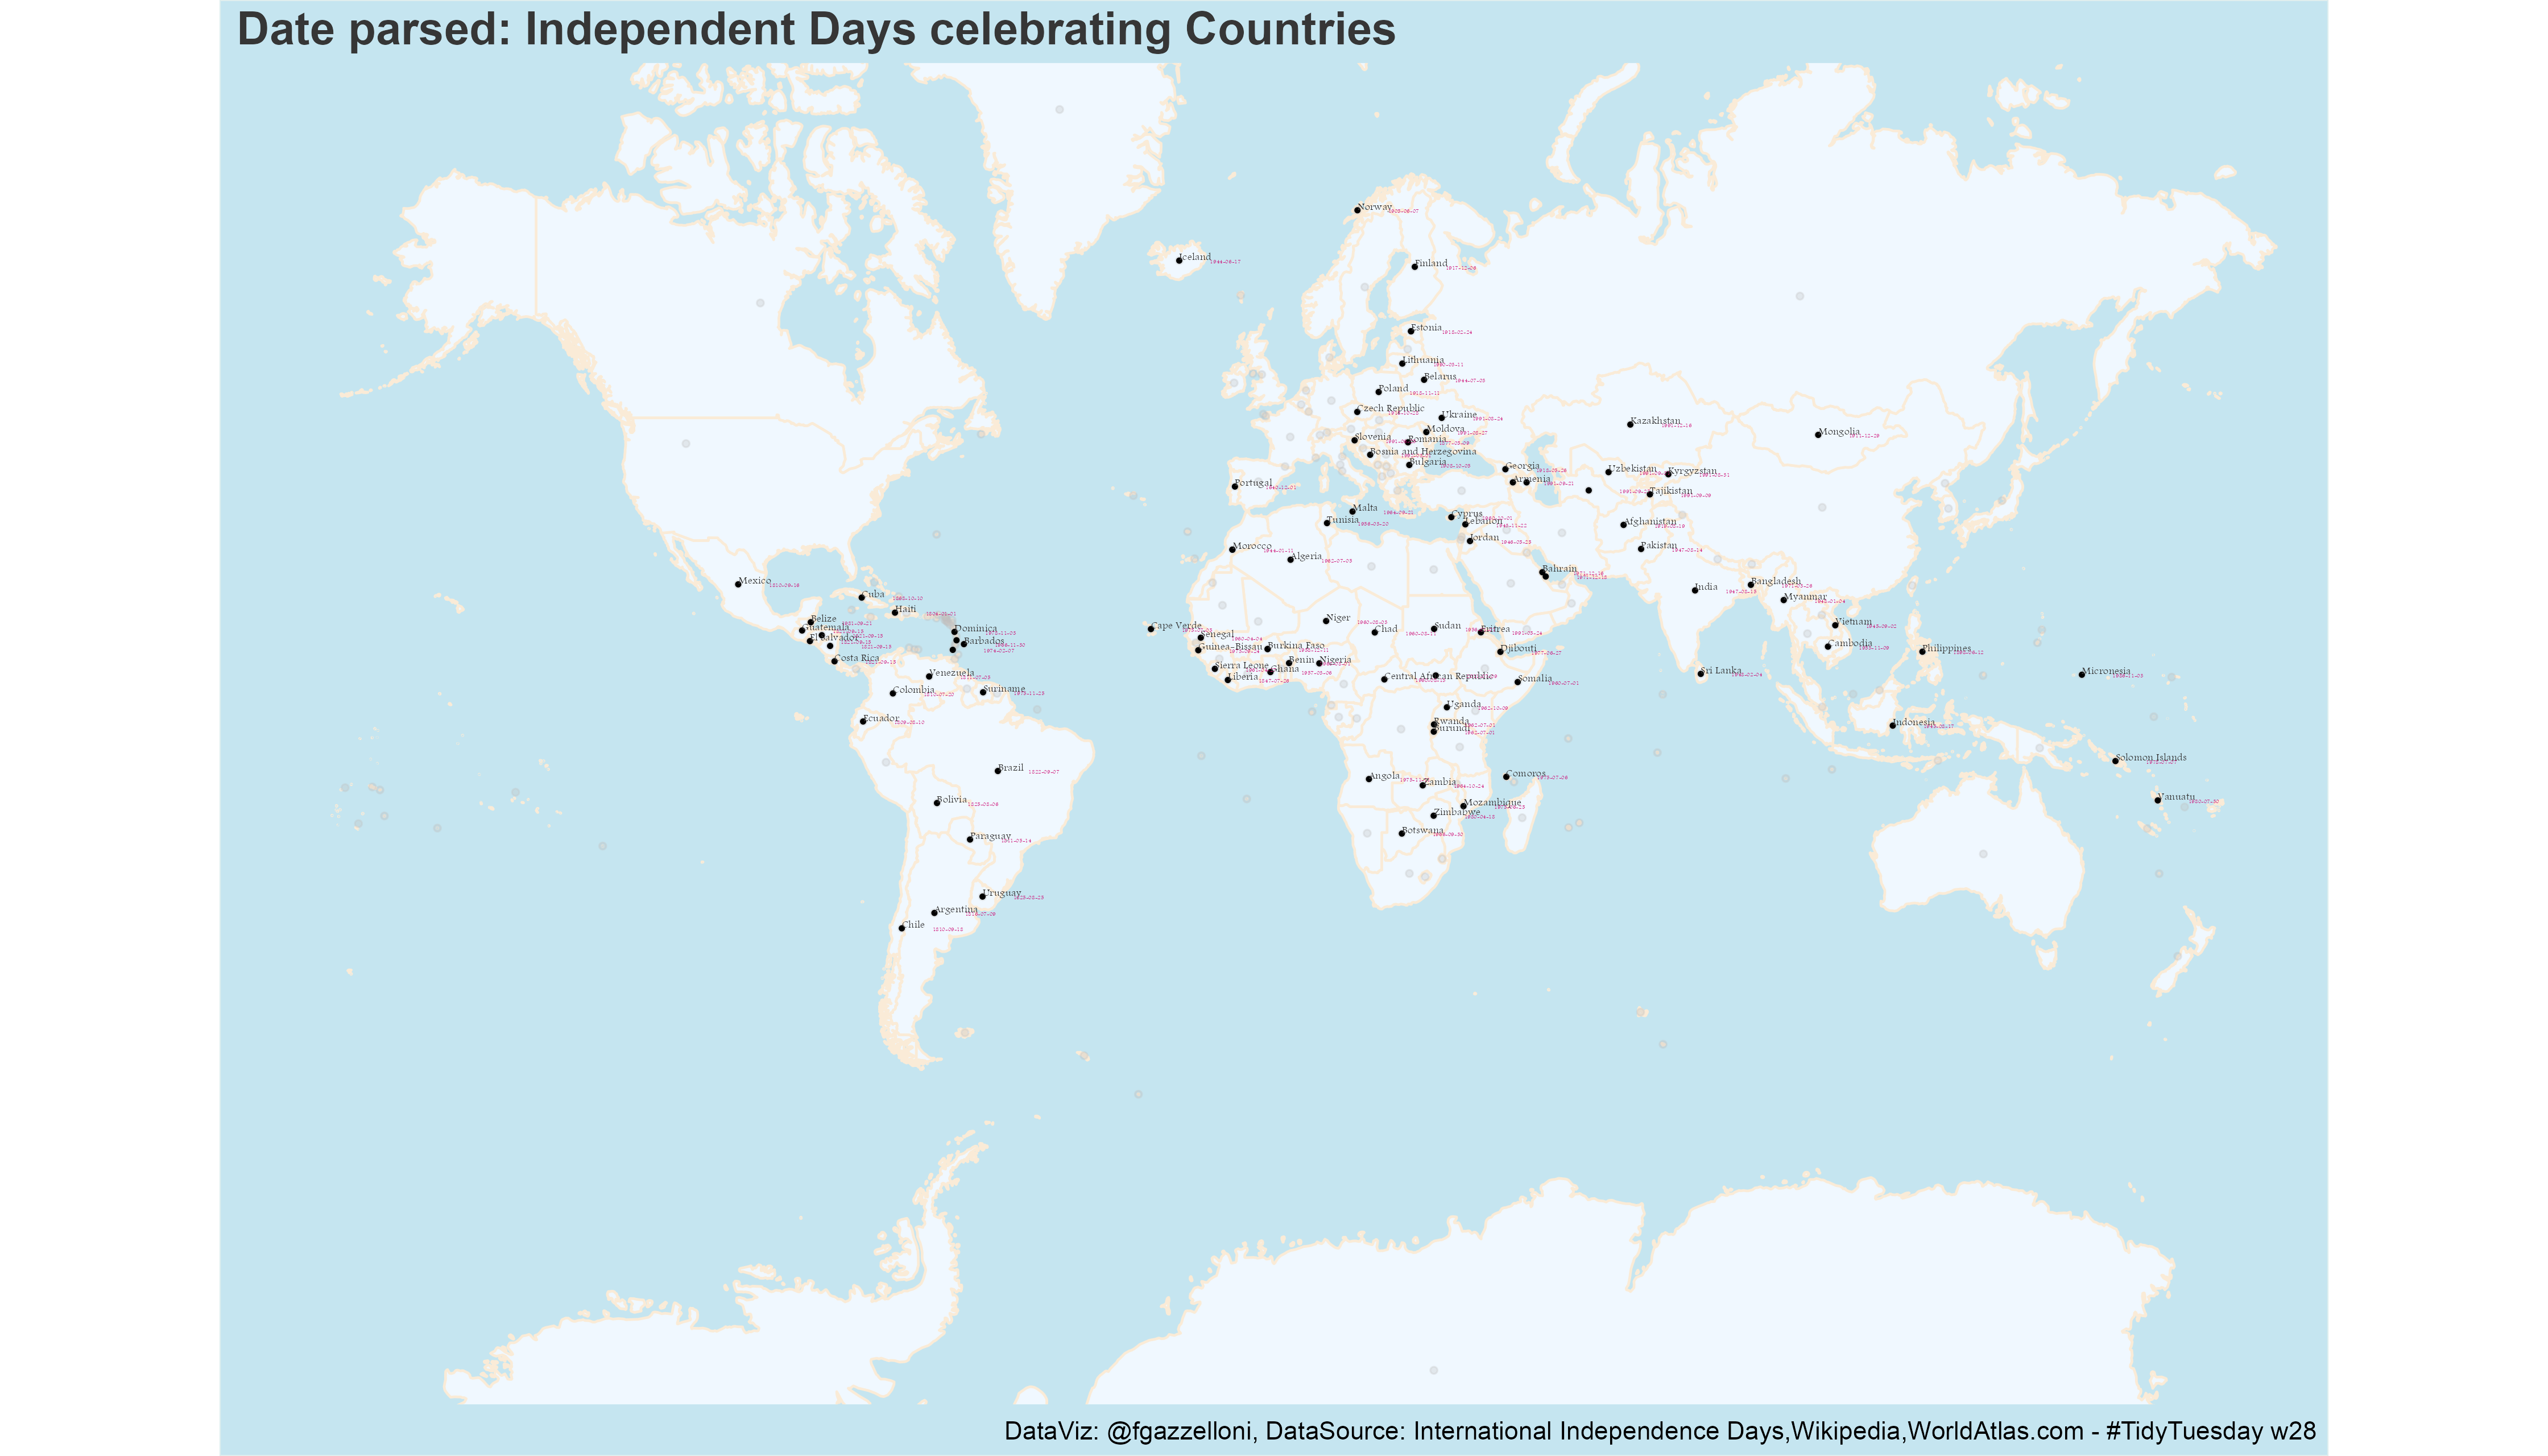
A country-by-country view of national independence days and their dates around the world.
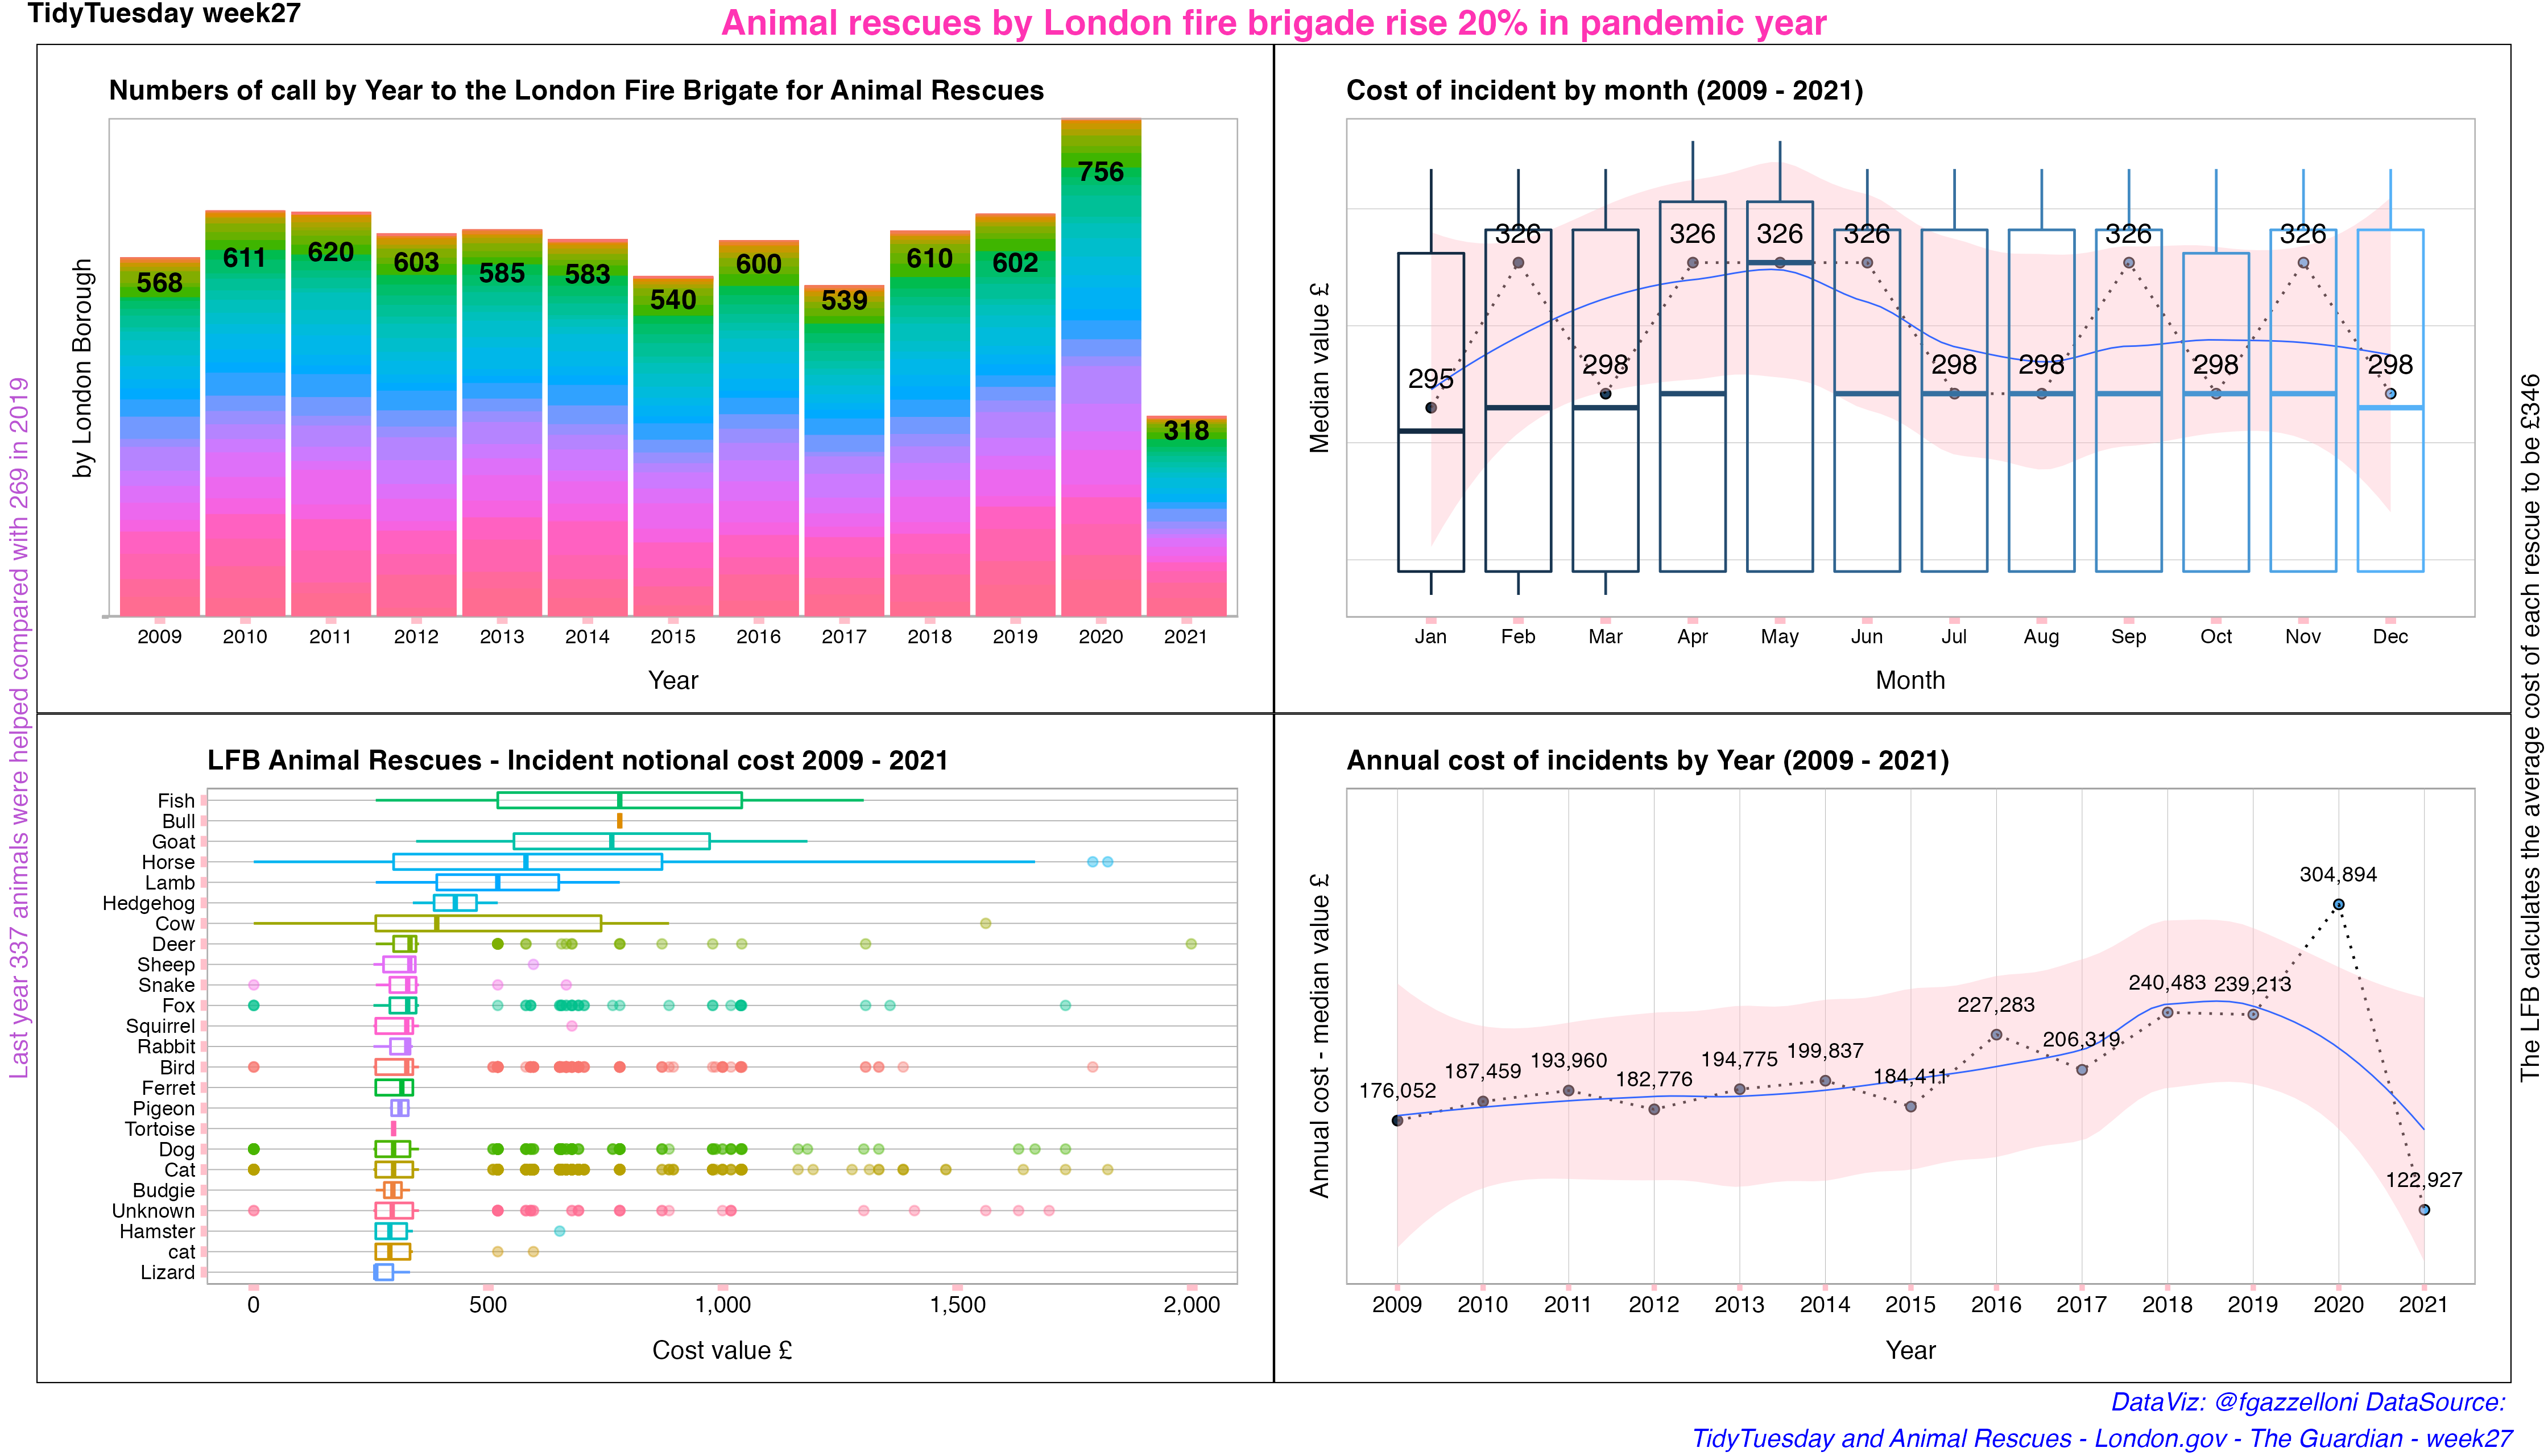
A visualization exploring animal rescue records and the animals represented in the dataset.
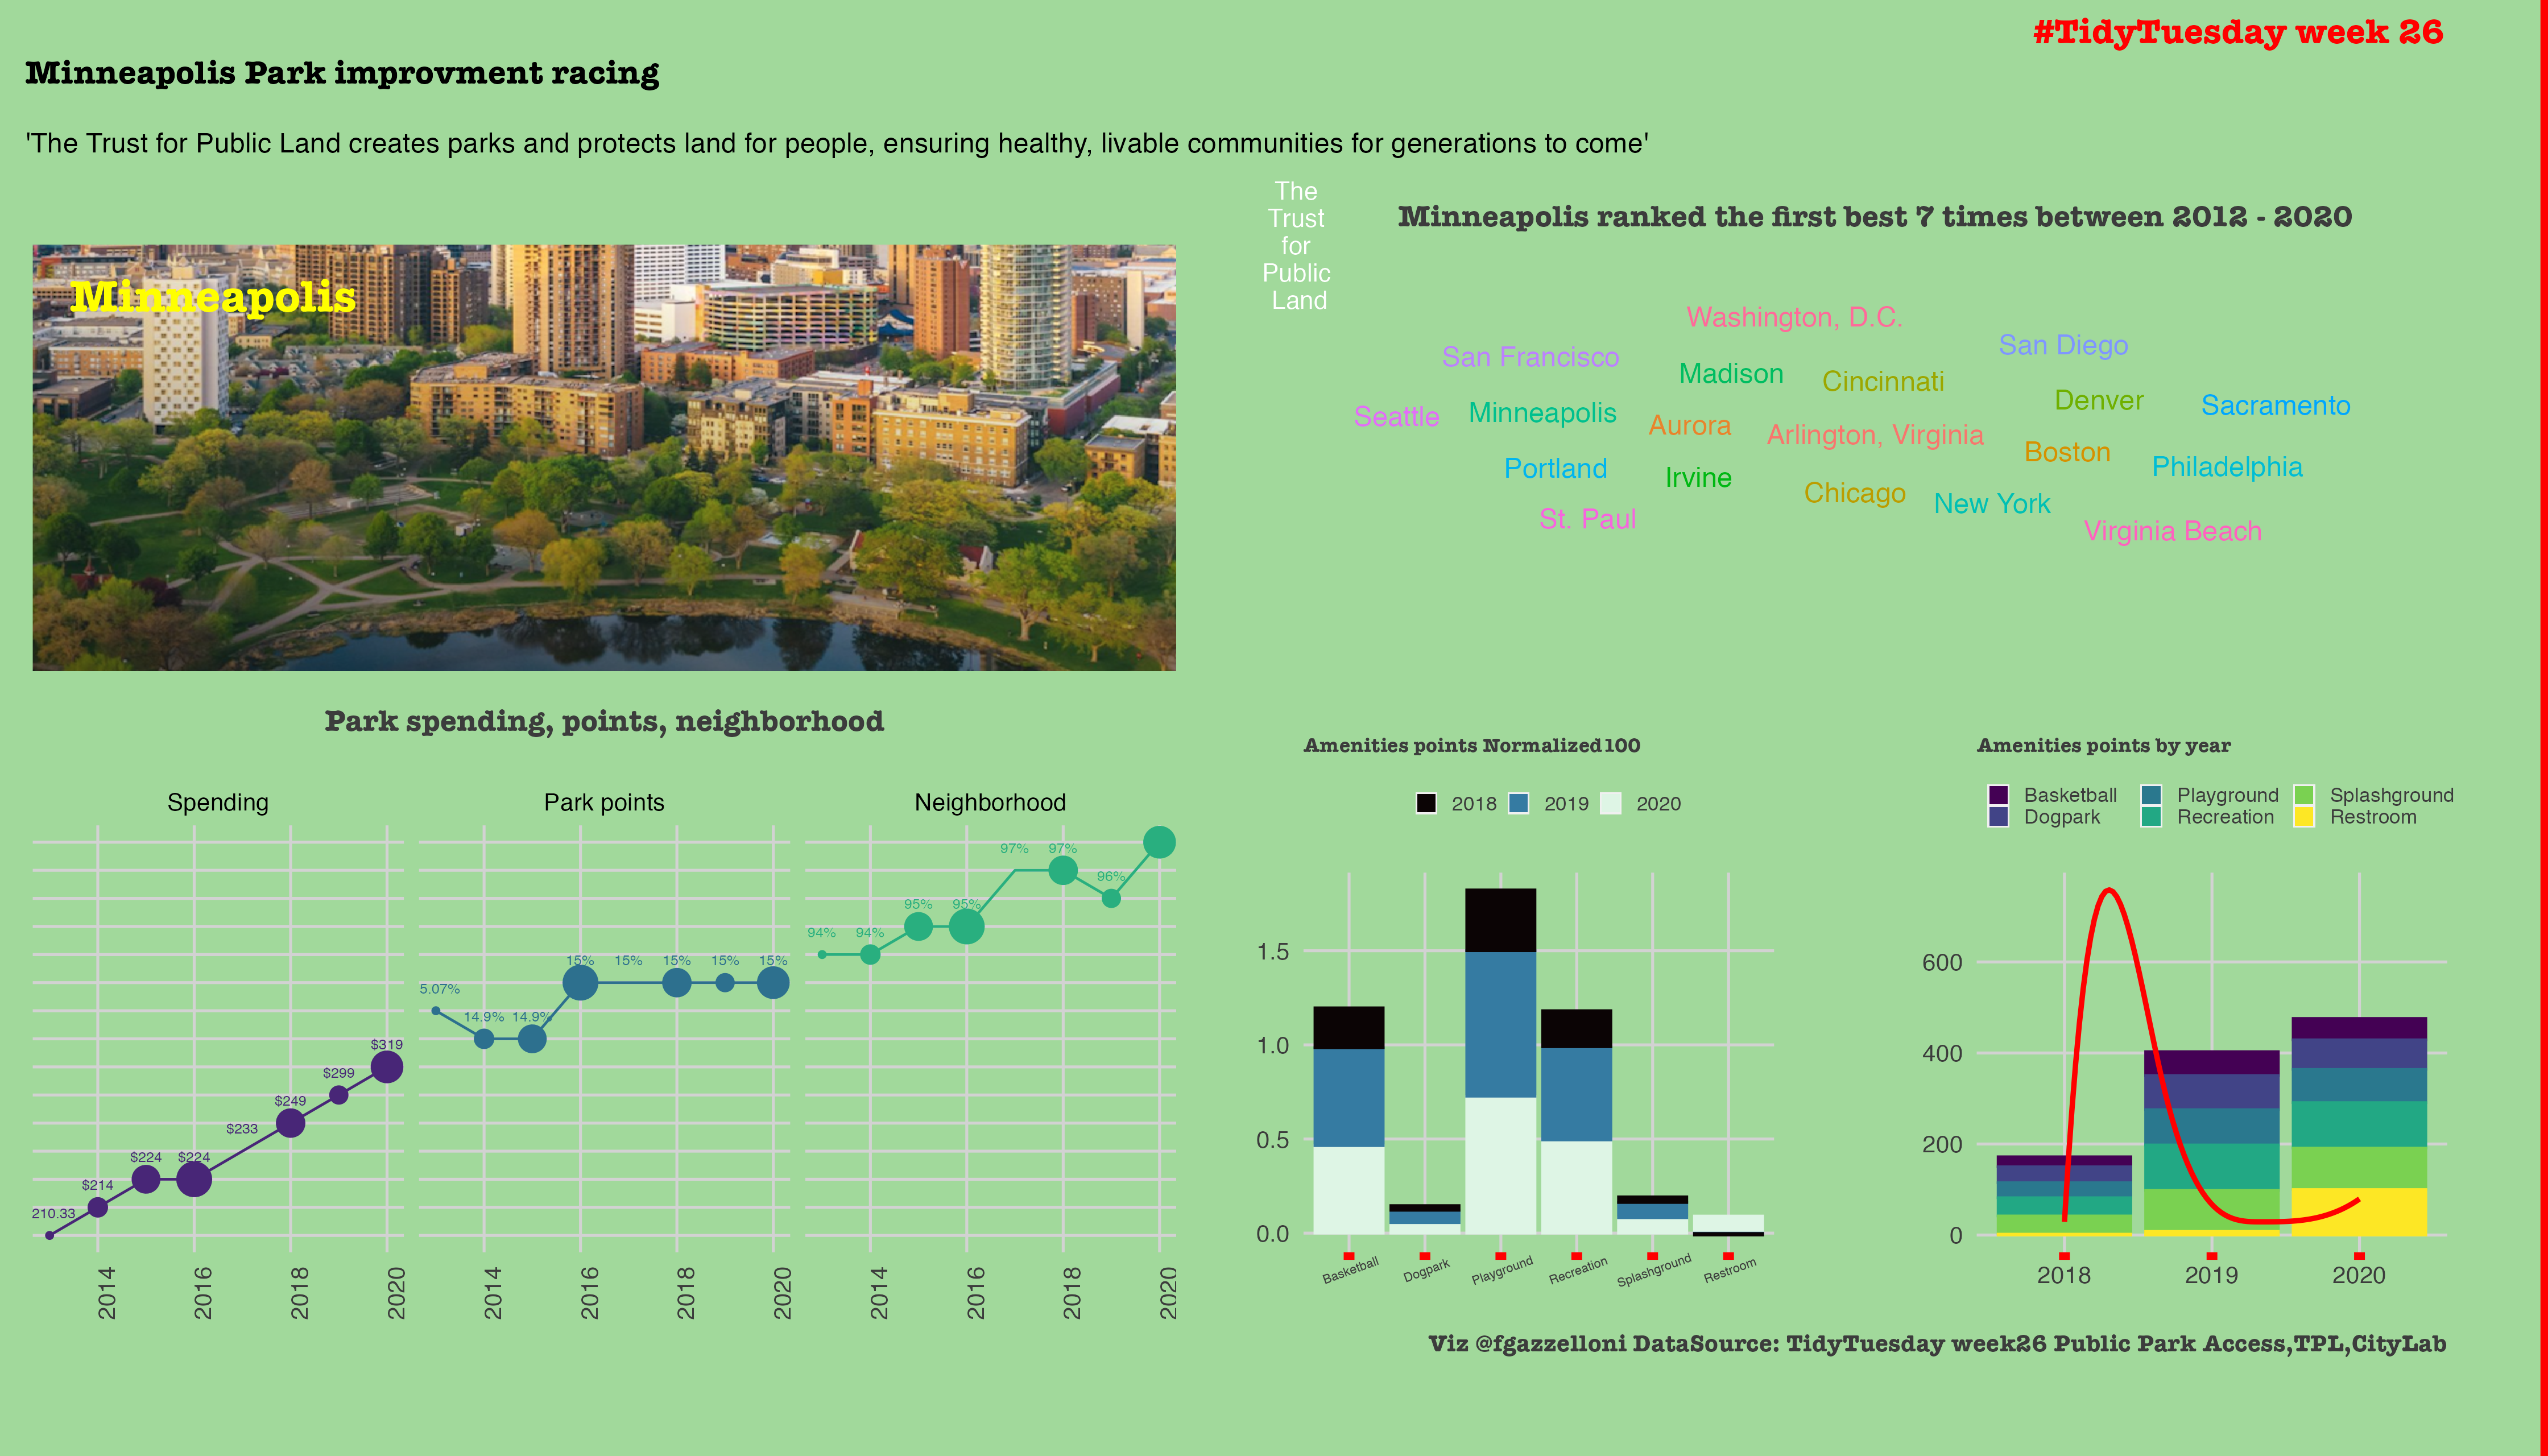
A visualization of public park access across the United States, highlighting geographic differences in access.
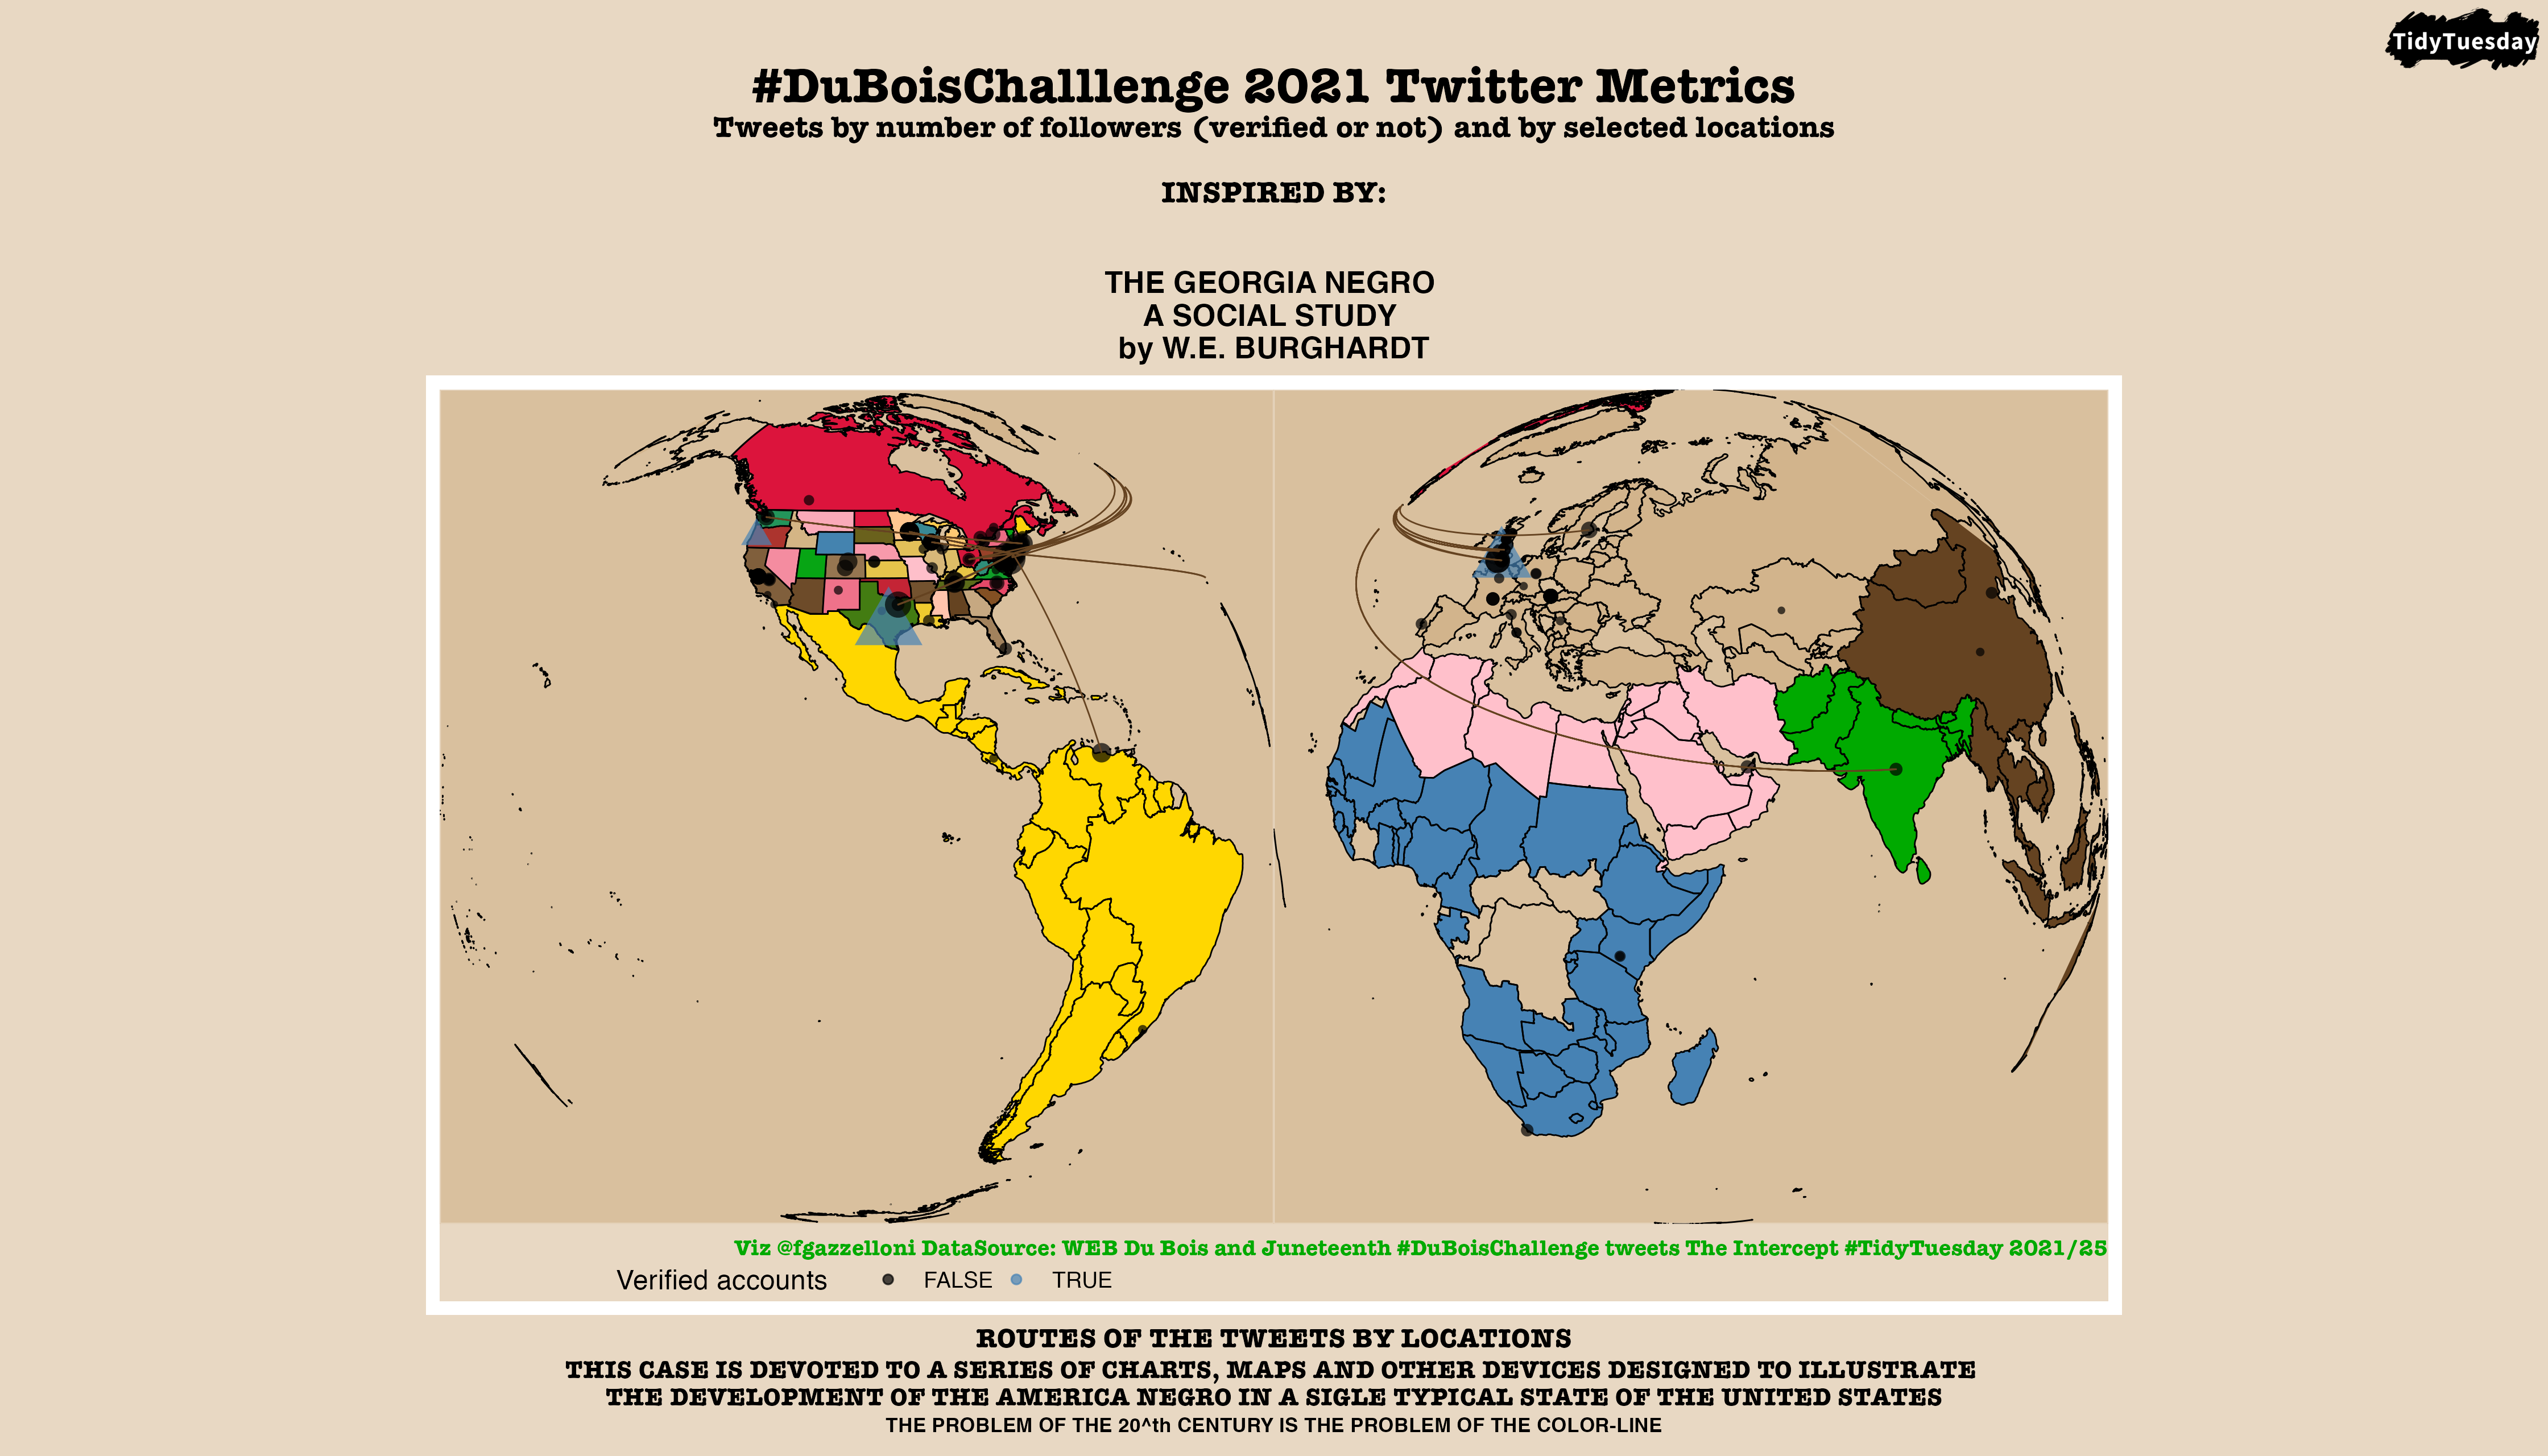
A historical data visualization connecting W.E.B. Du Bois material with the Juneteenth theme.
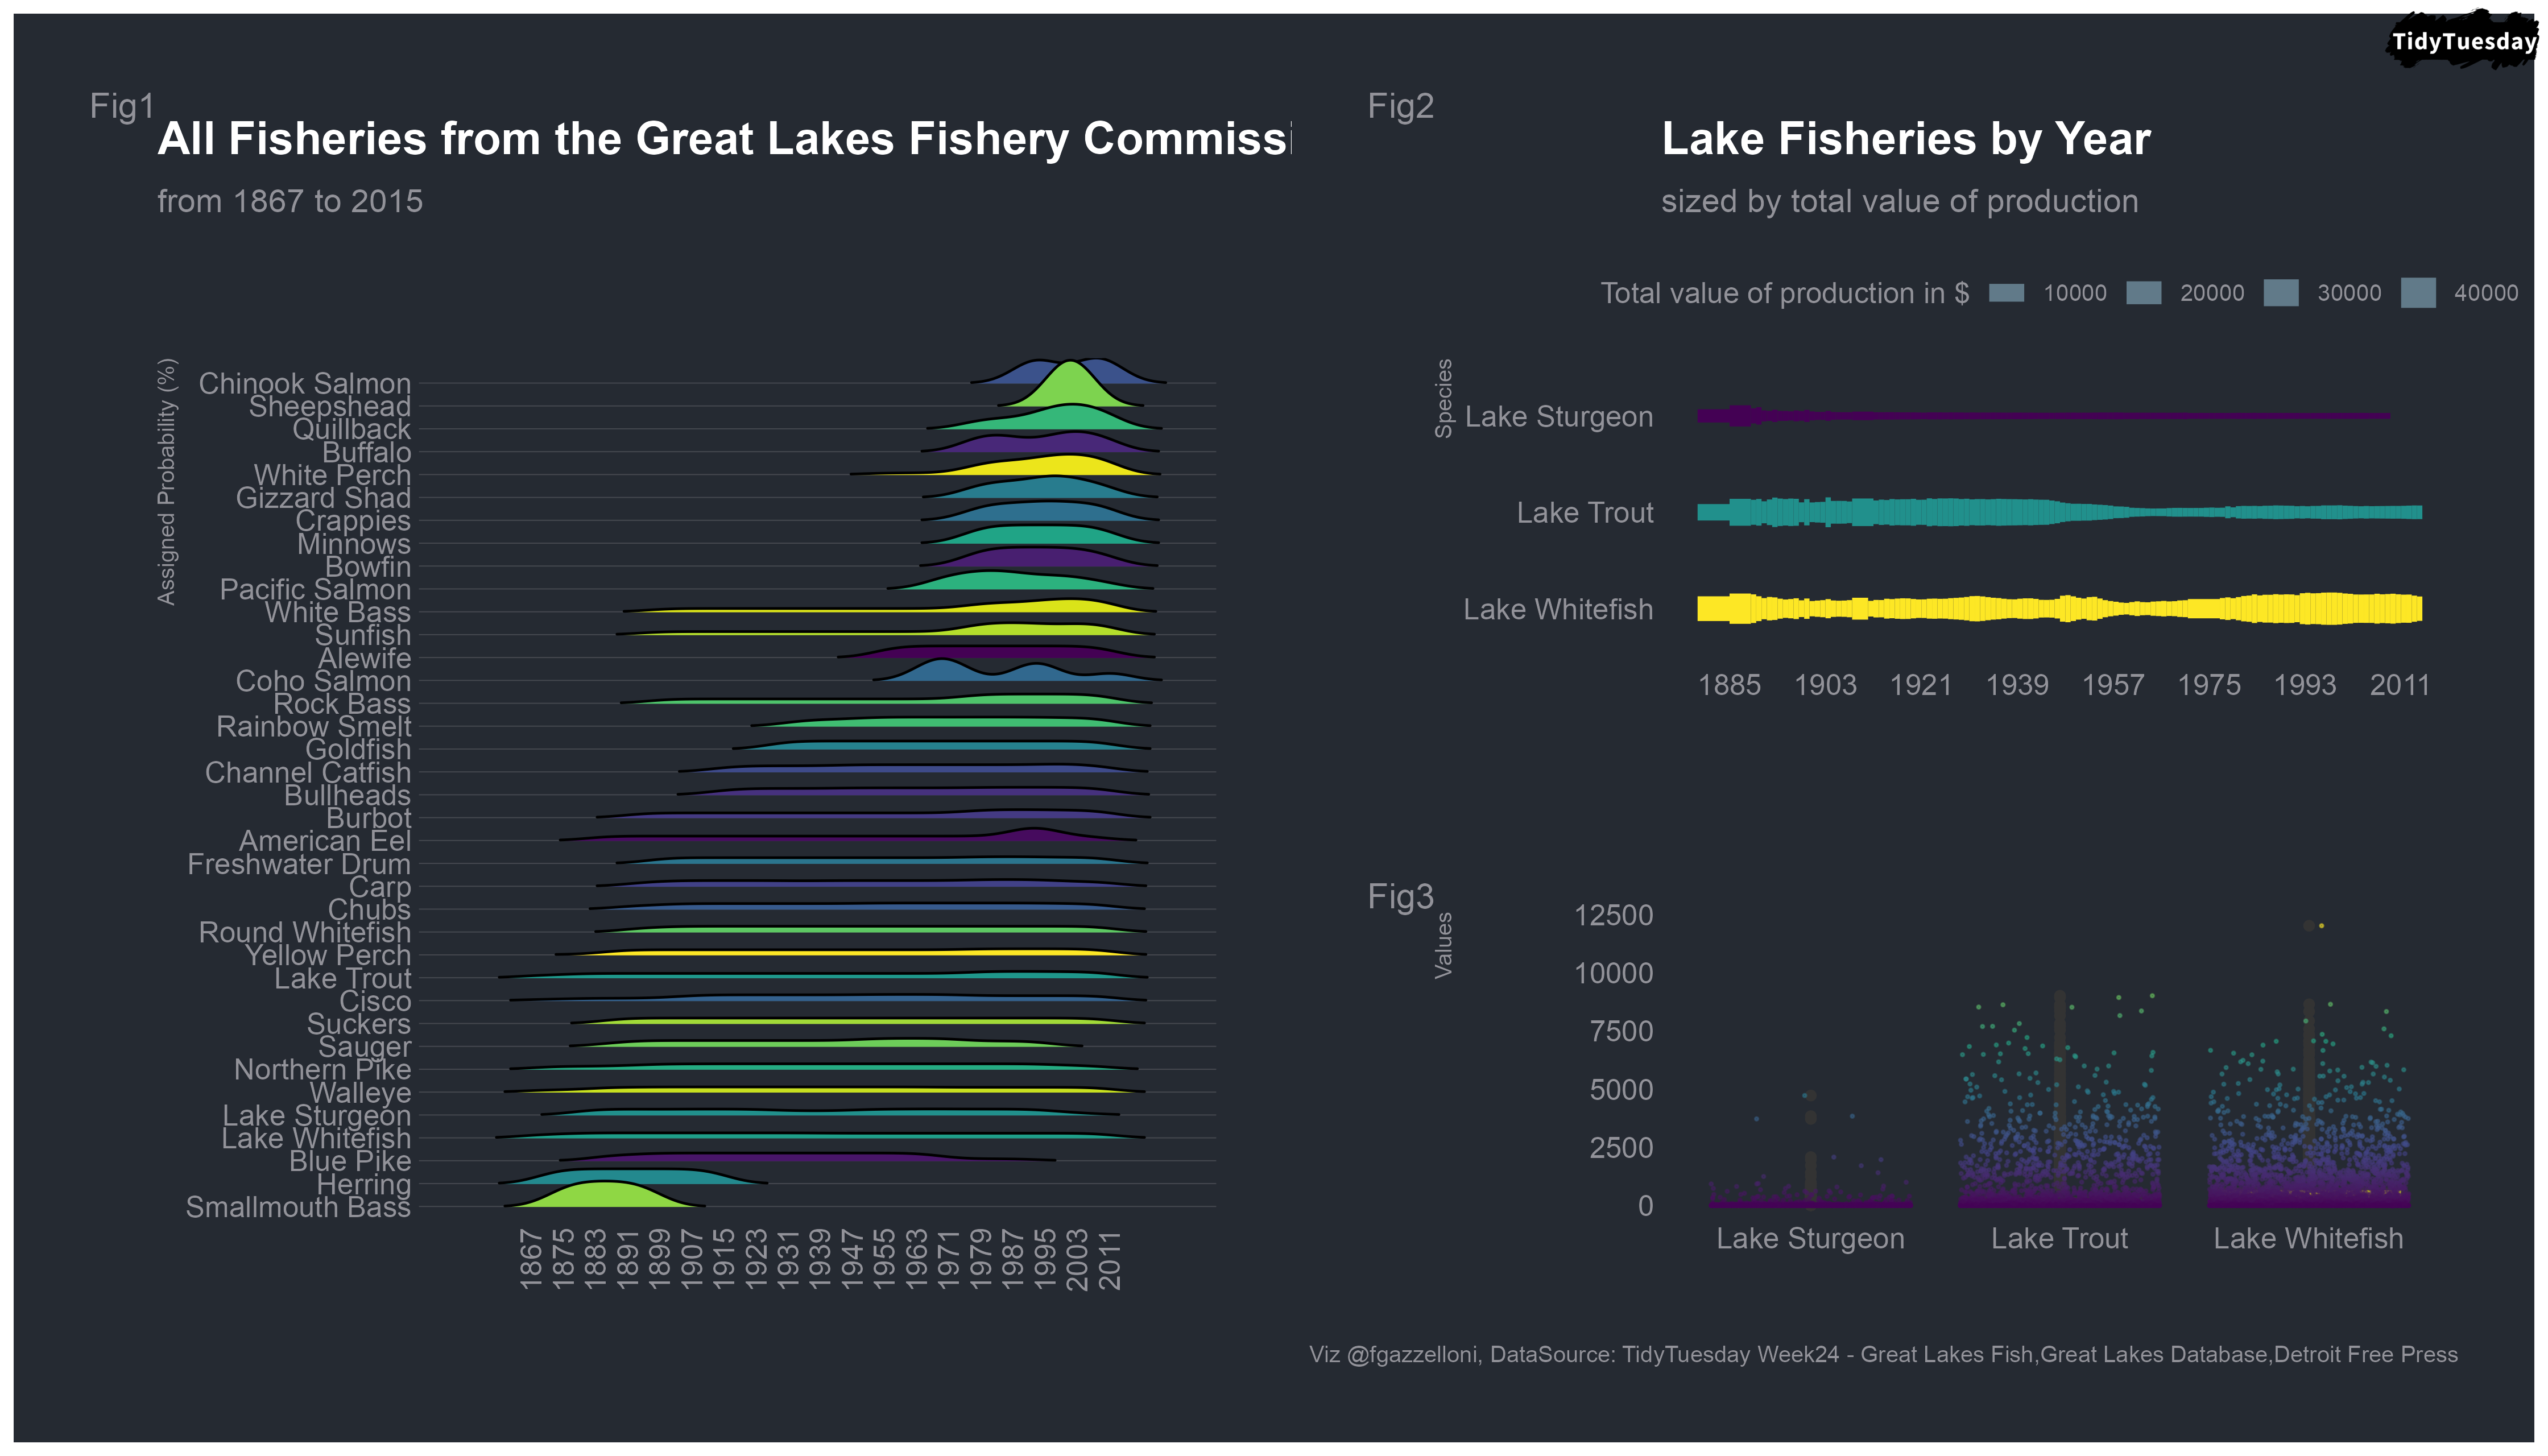
A visualization of fish observations and species across the Great Lakes using Great Lakes Database records.
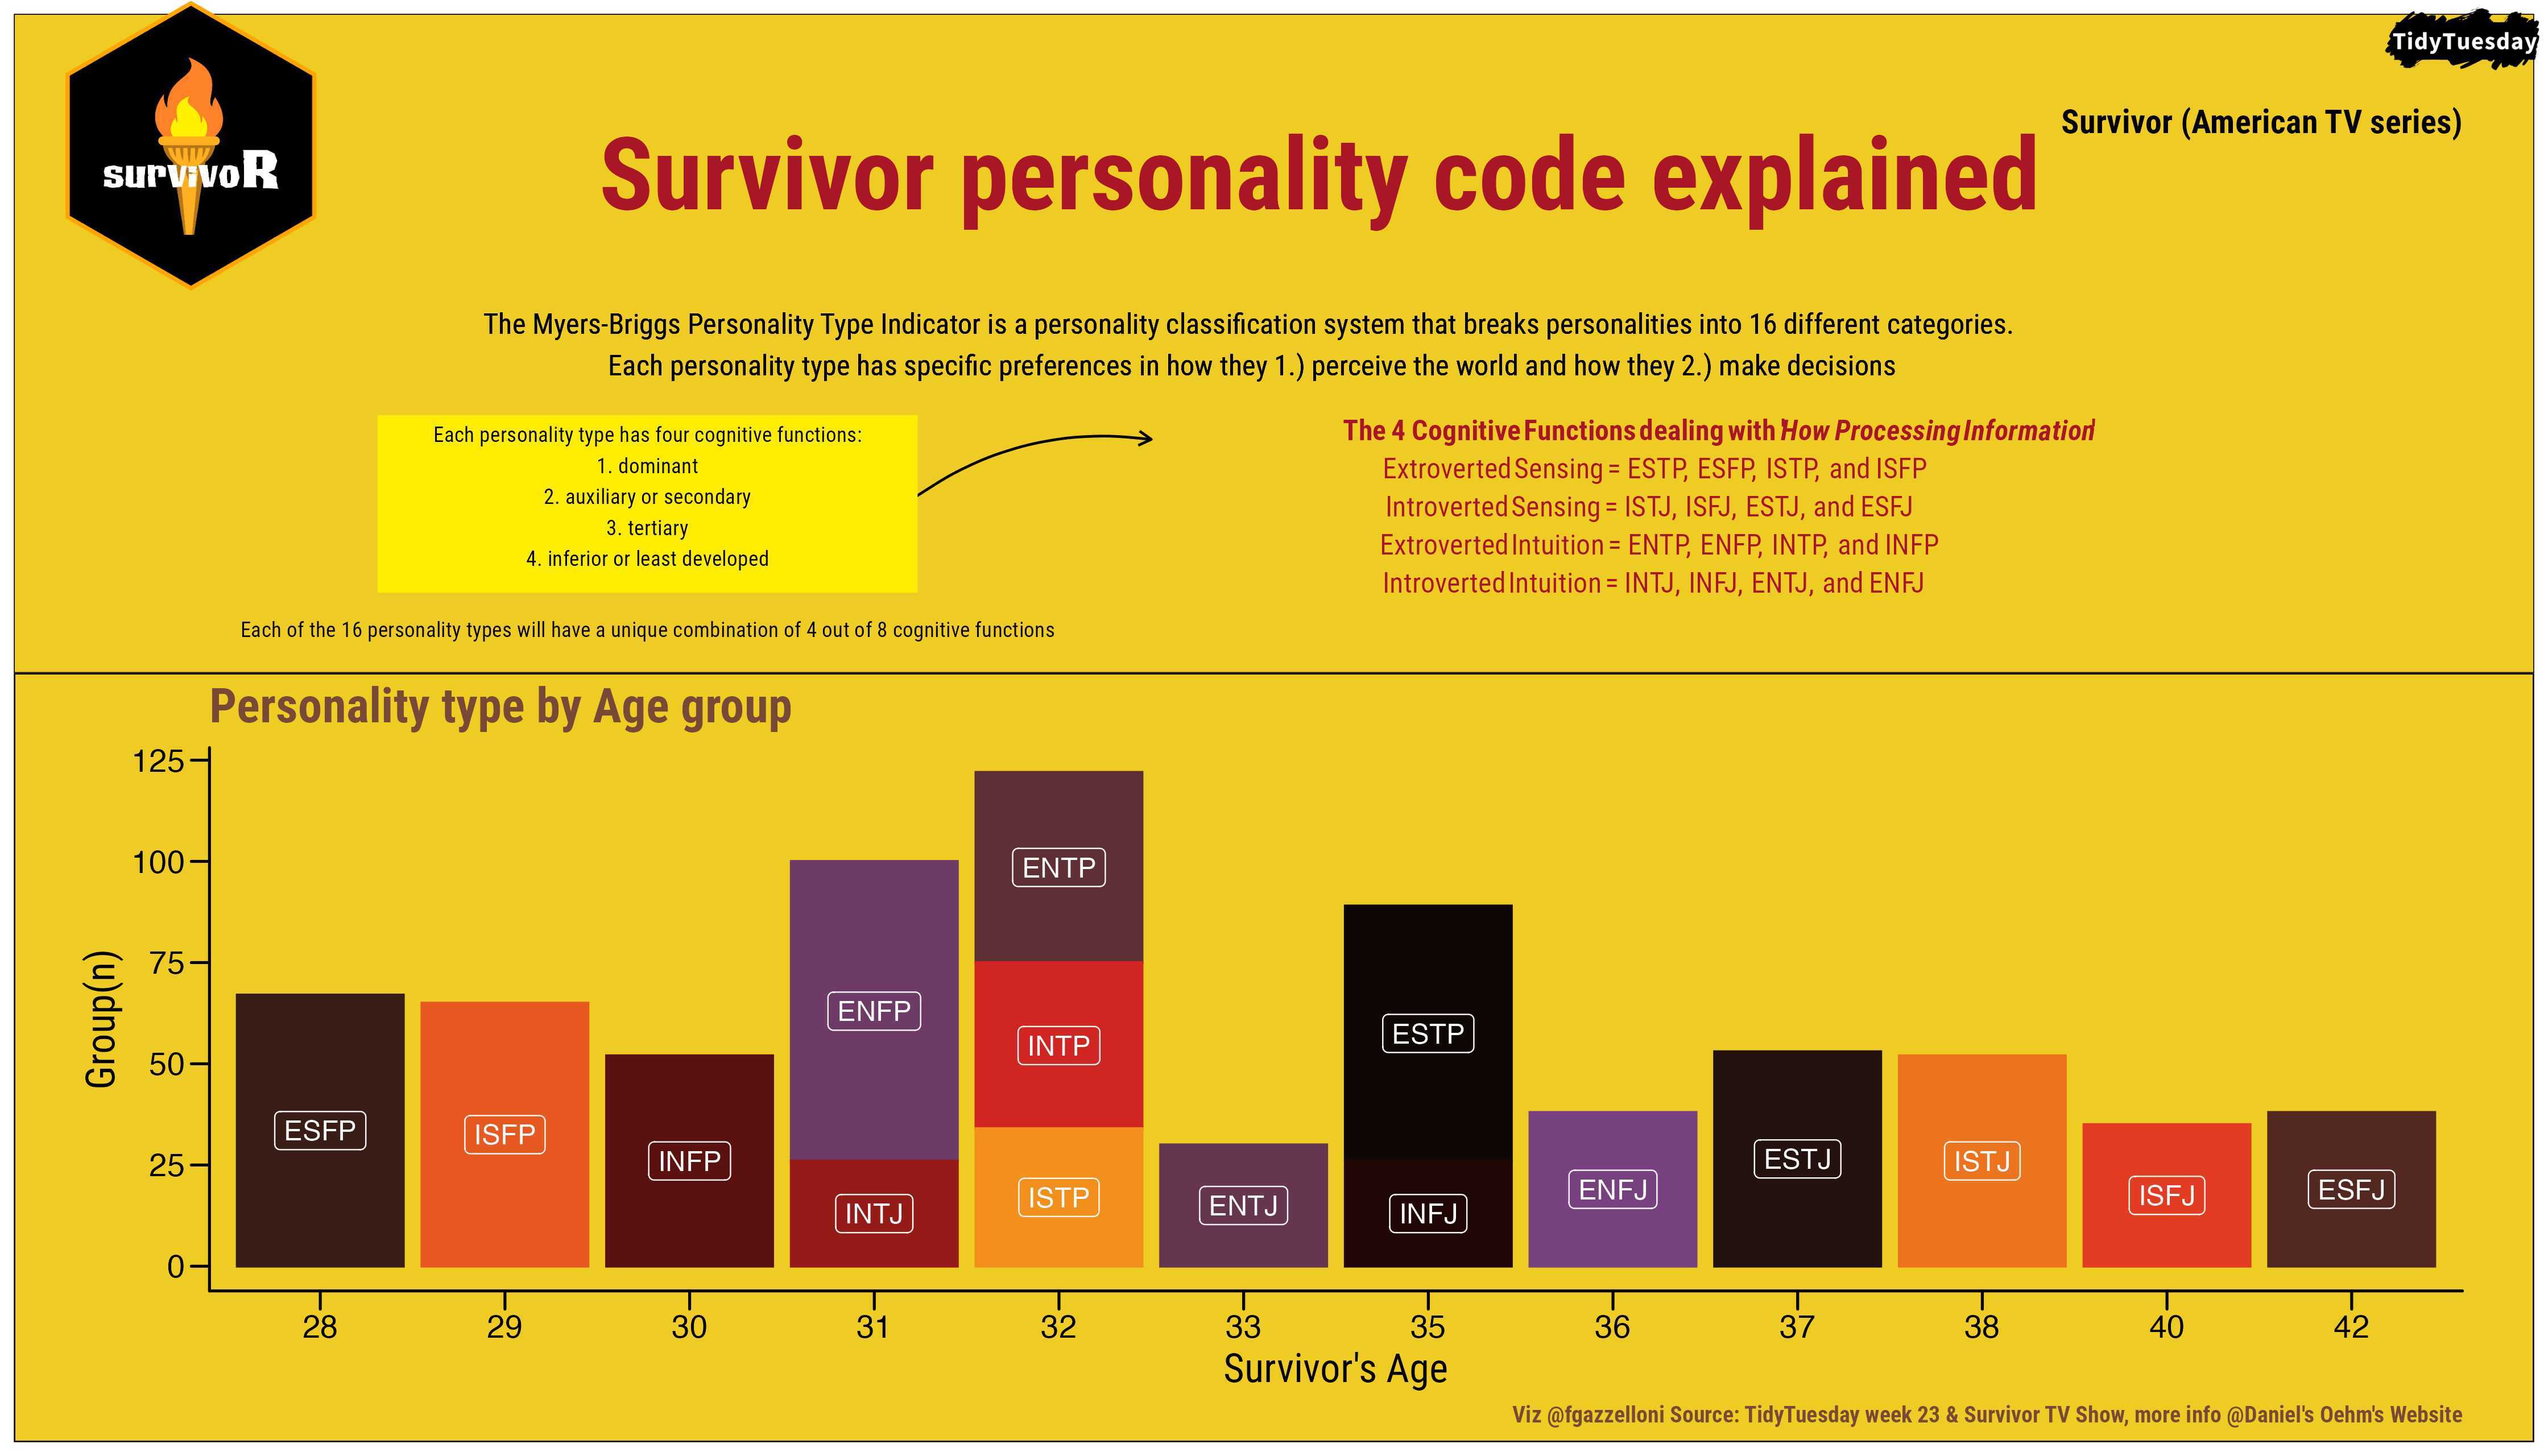
A visualization exploring contestants and events in the Survivor television series dataset.
A comparison of Mario Kart world-record times across tracks and racing categories.
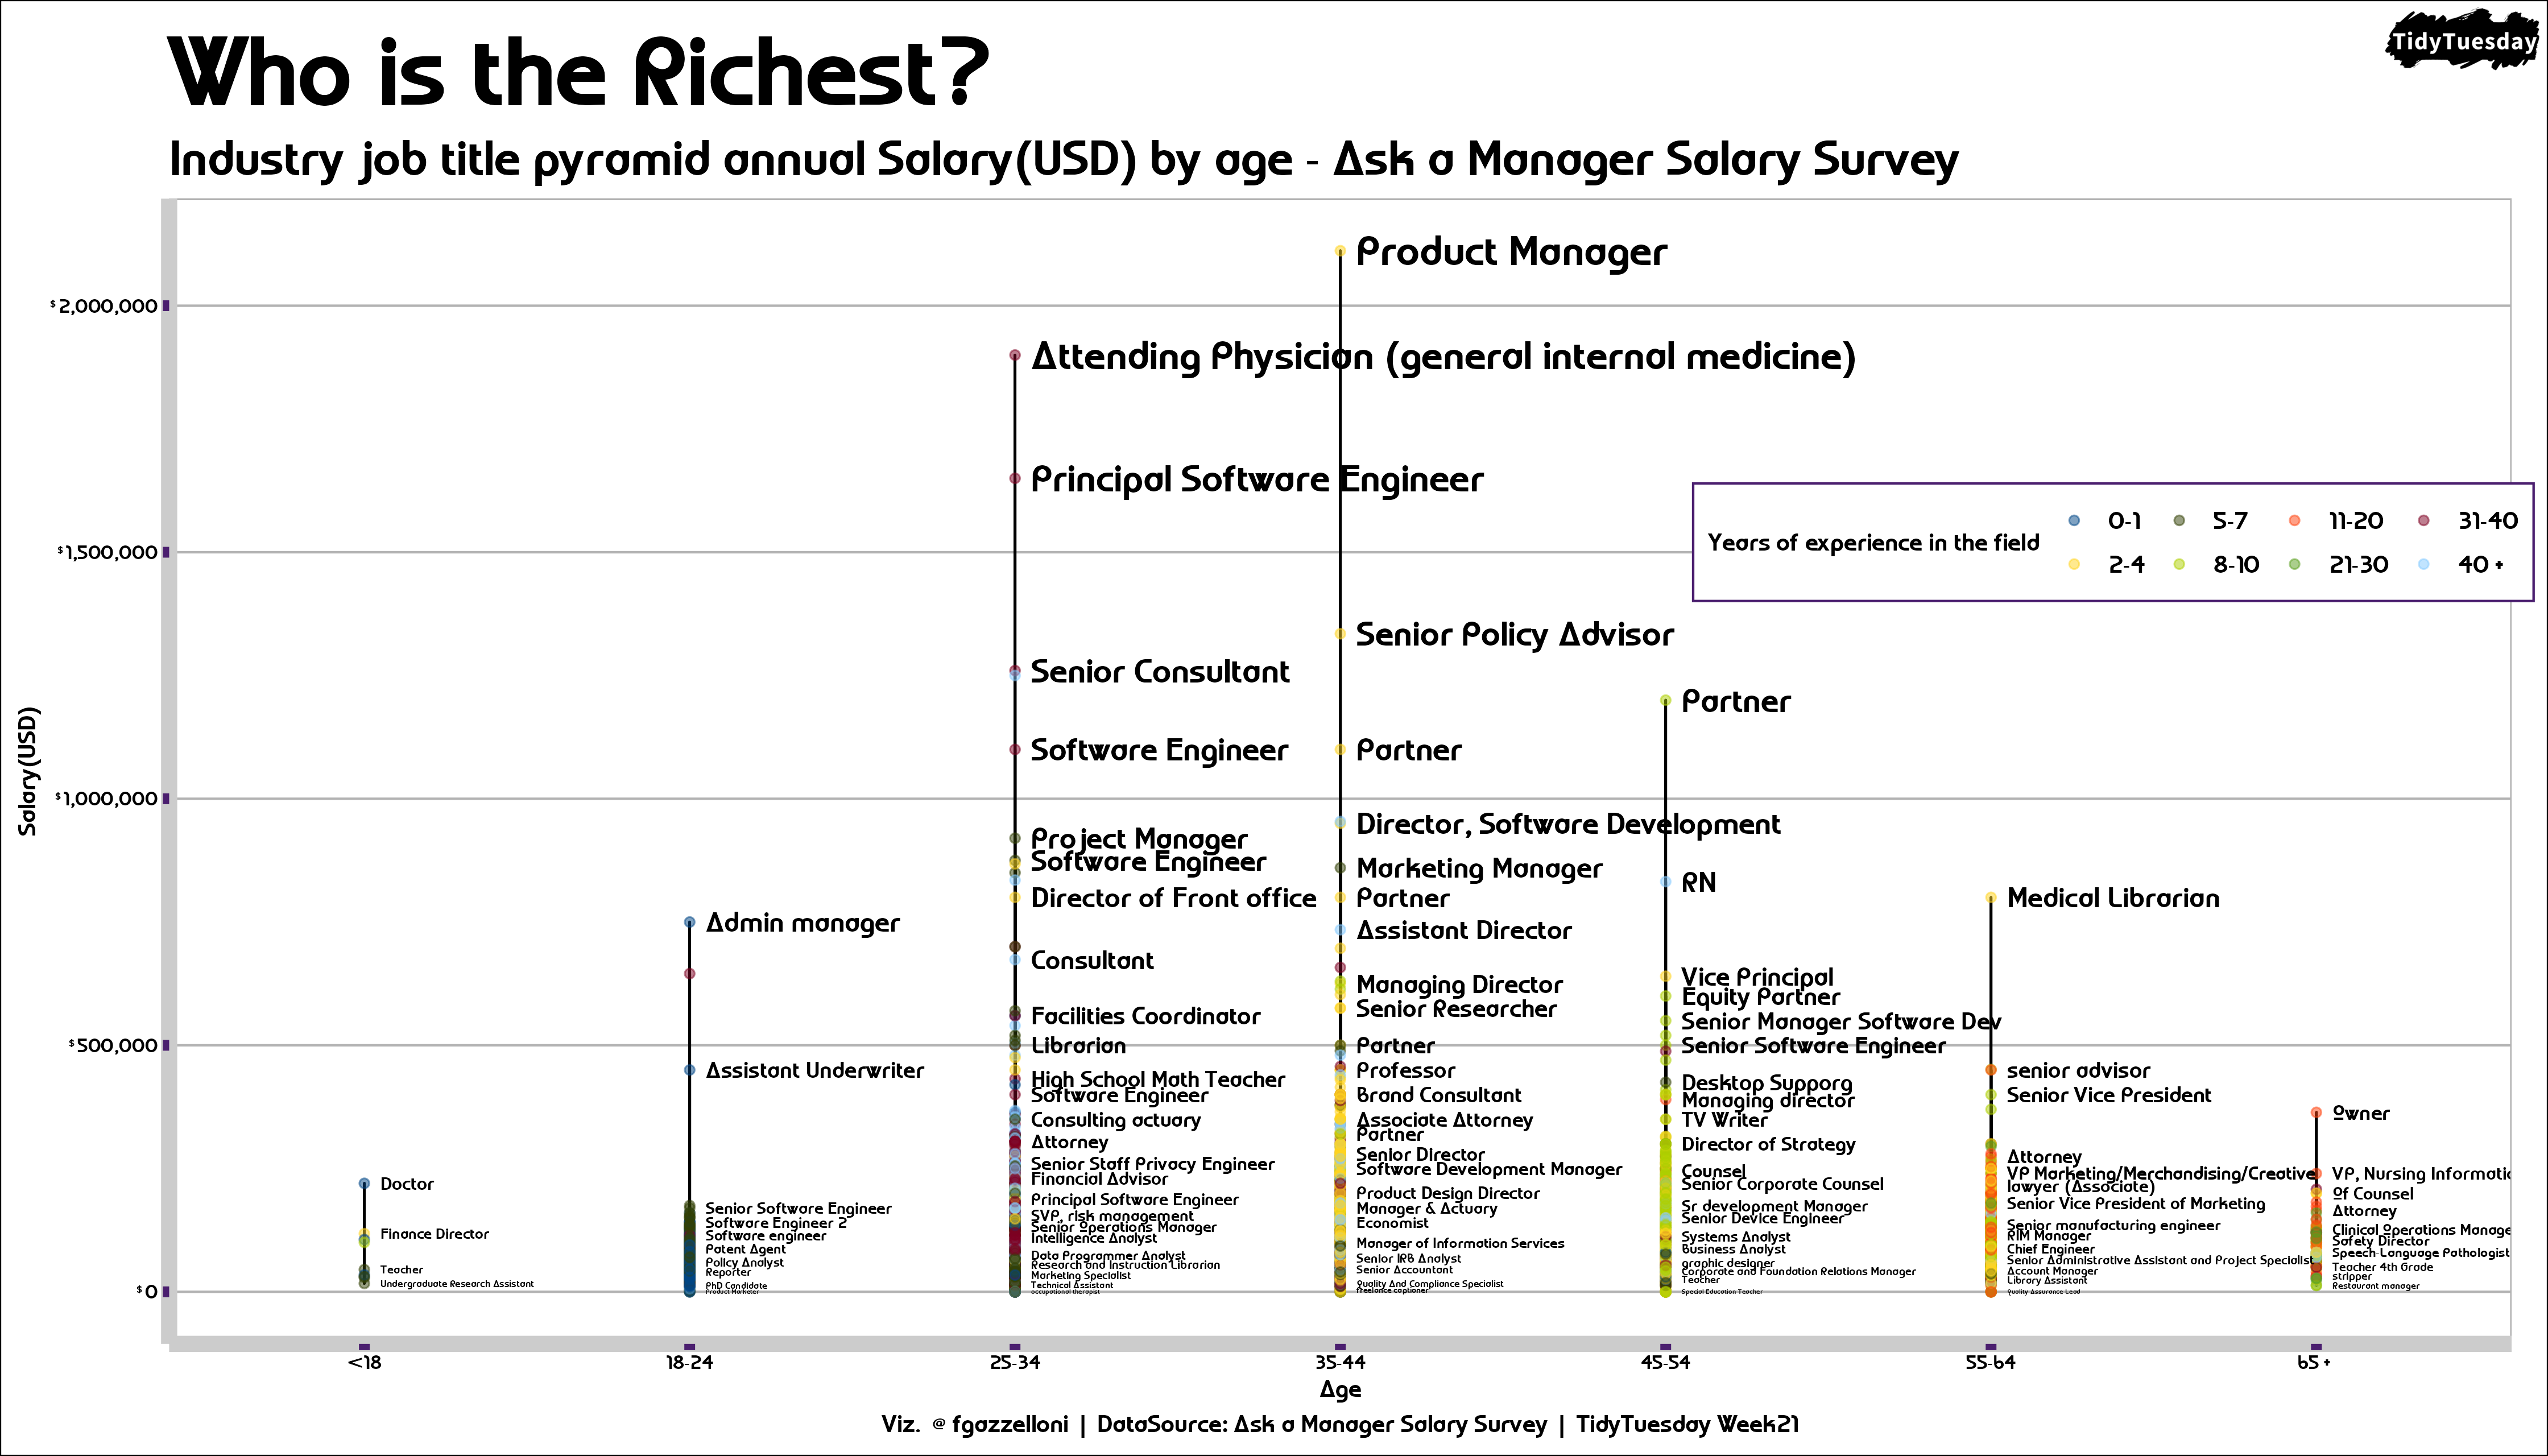
A summary of salary and workplace responses from the Ask a Manager survey.
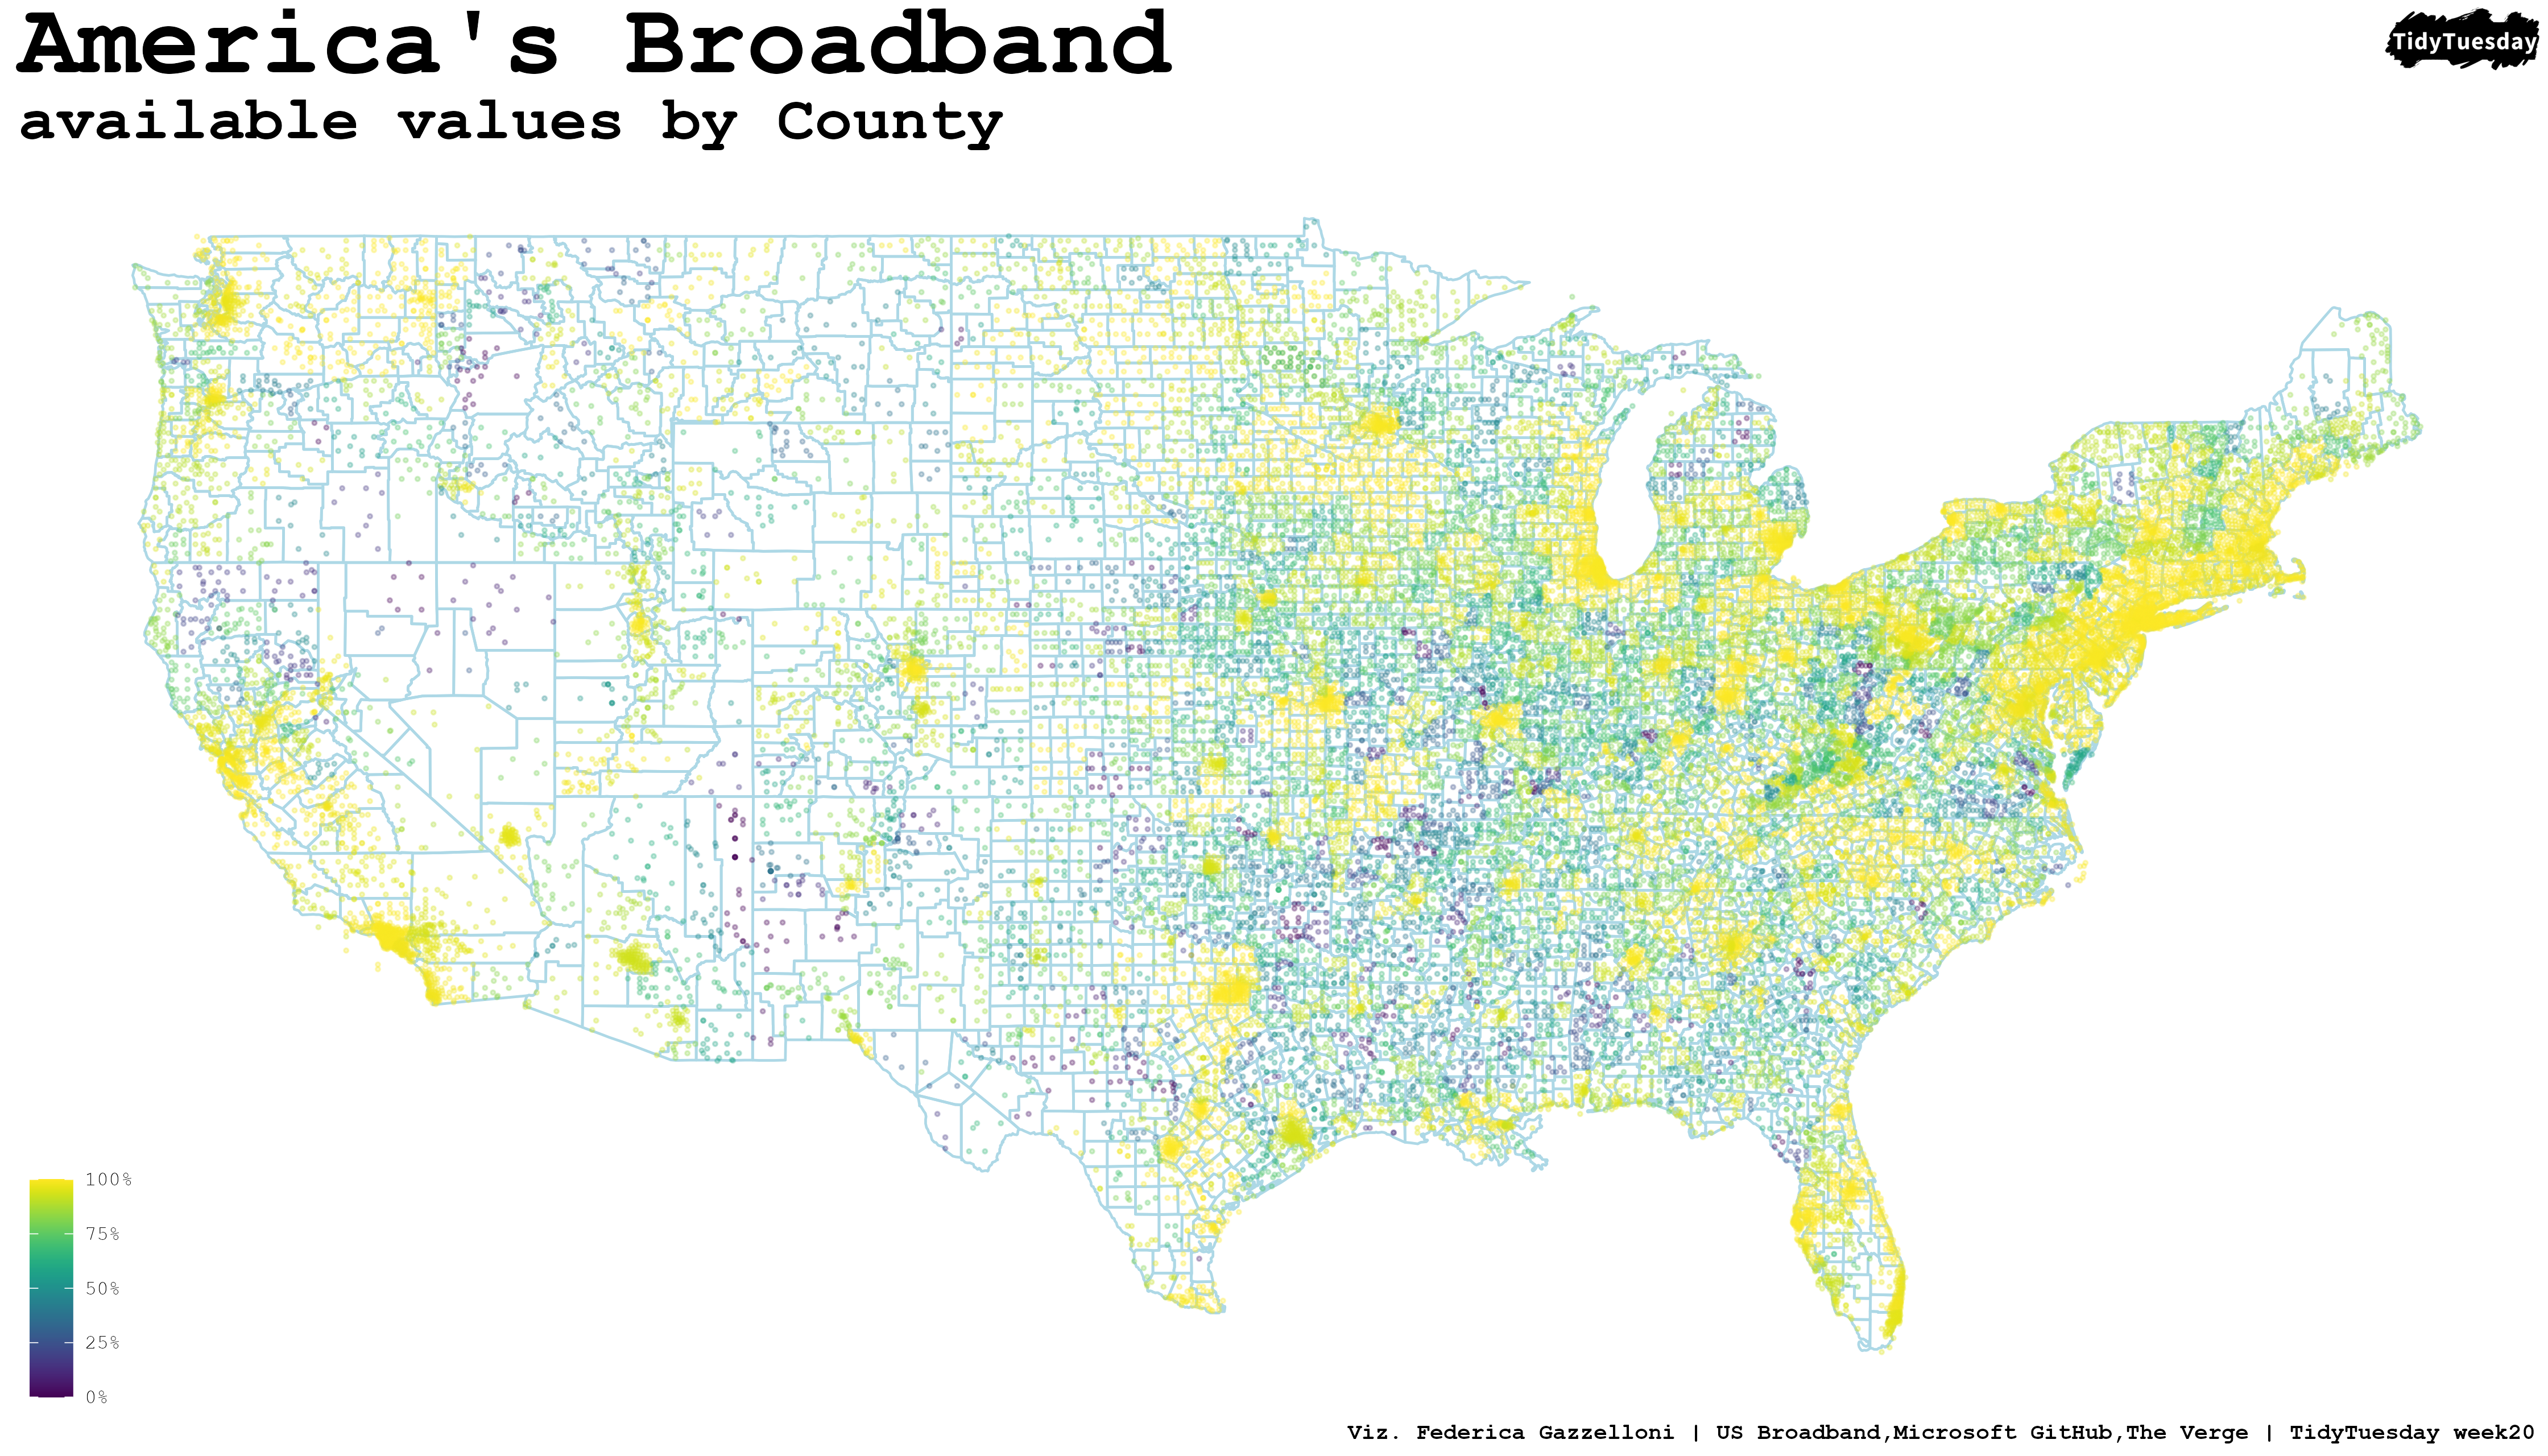
A visualization of broadband access and availability across the United States.
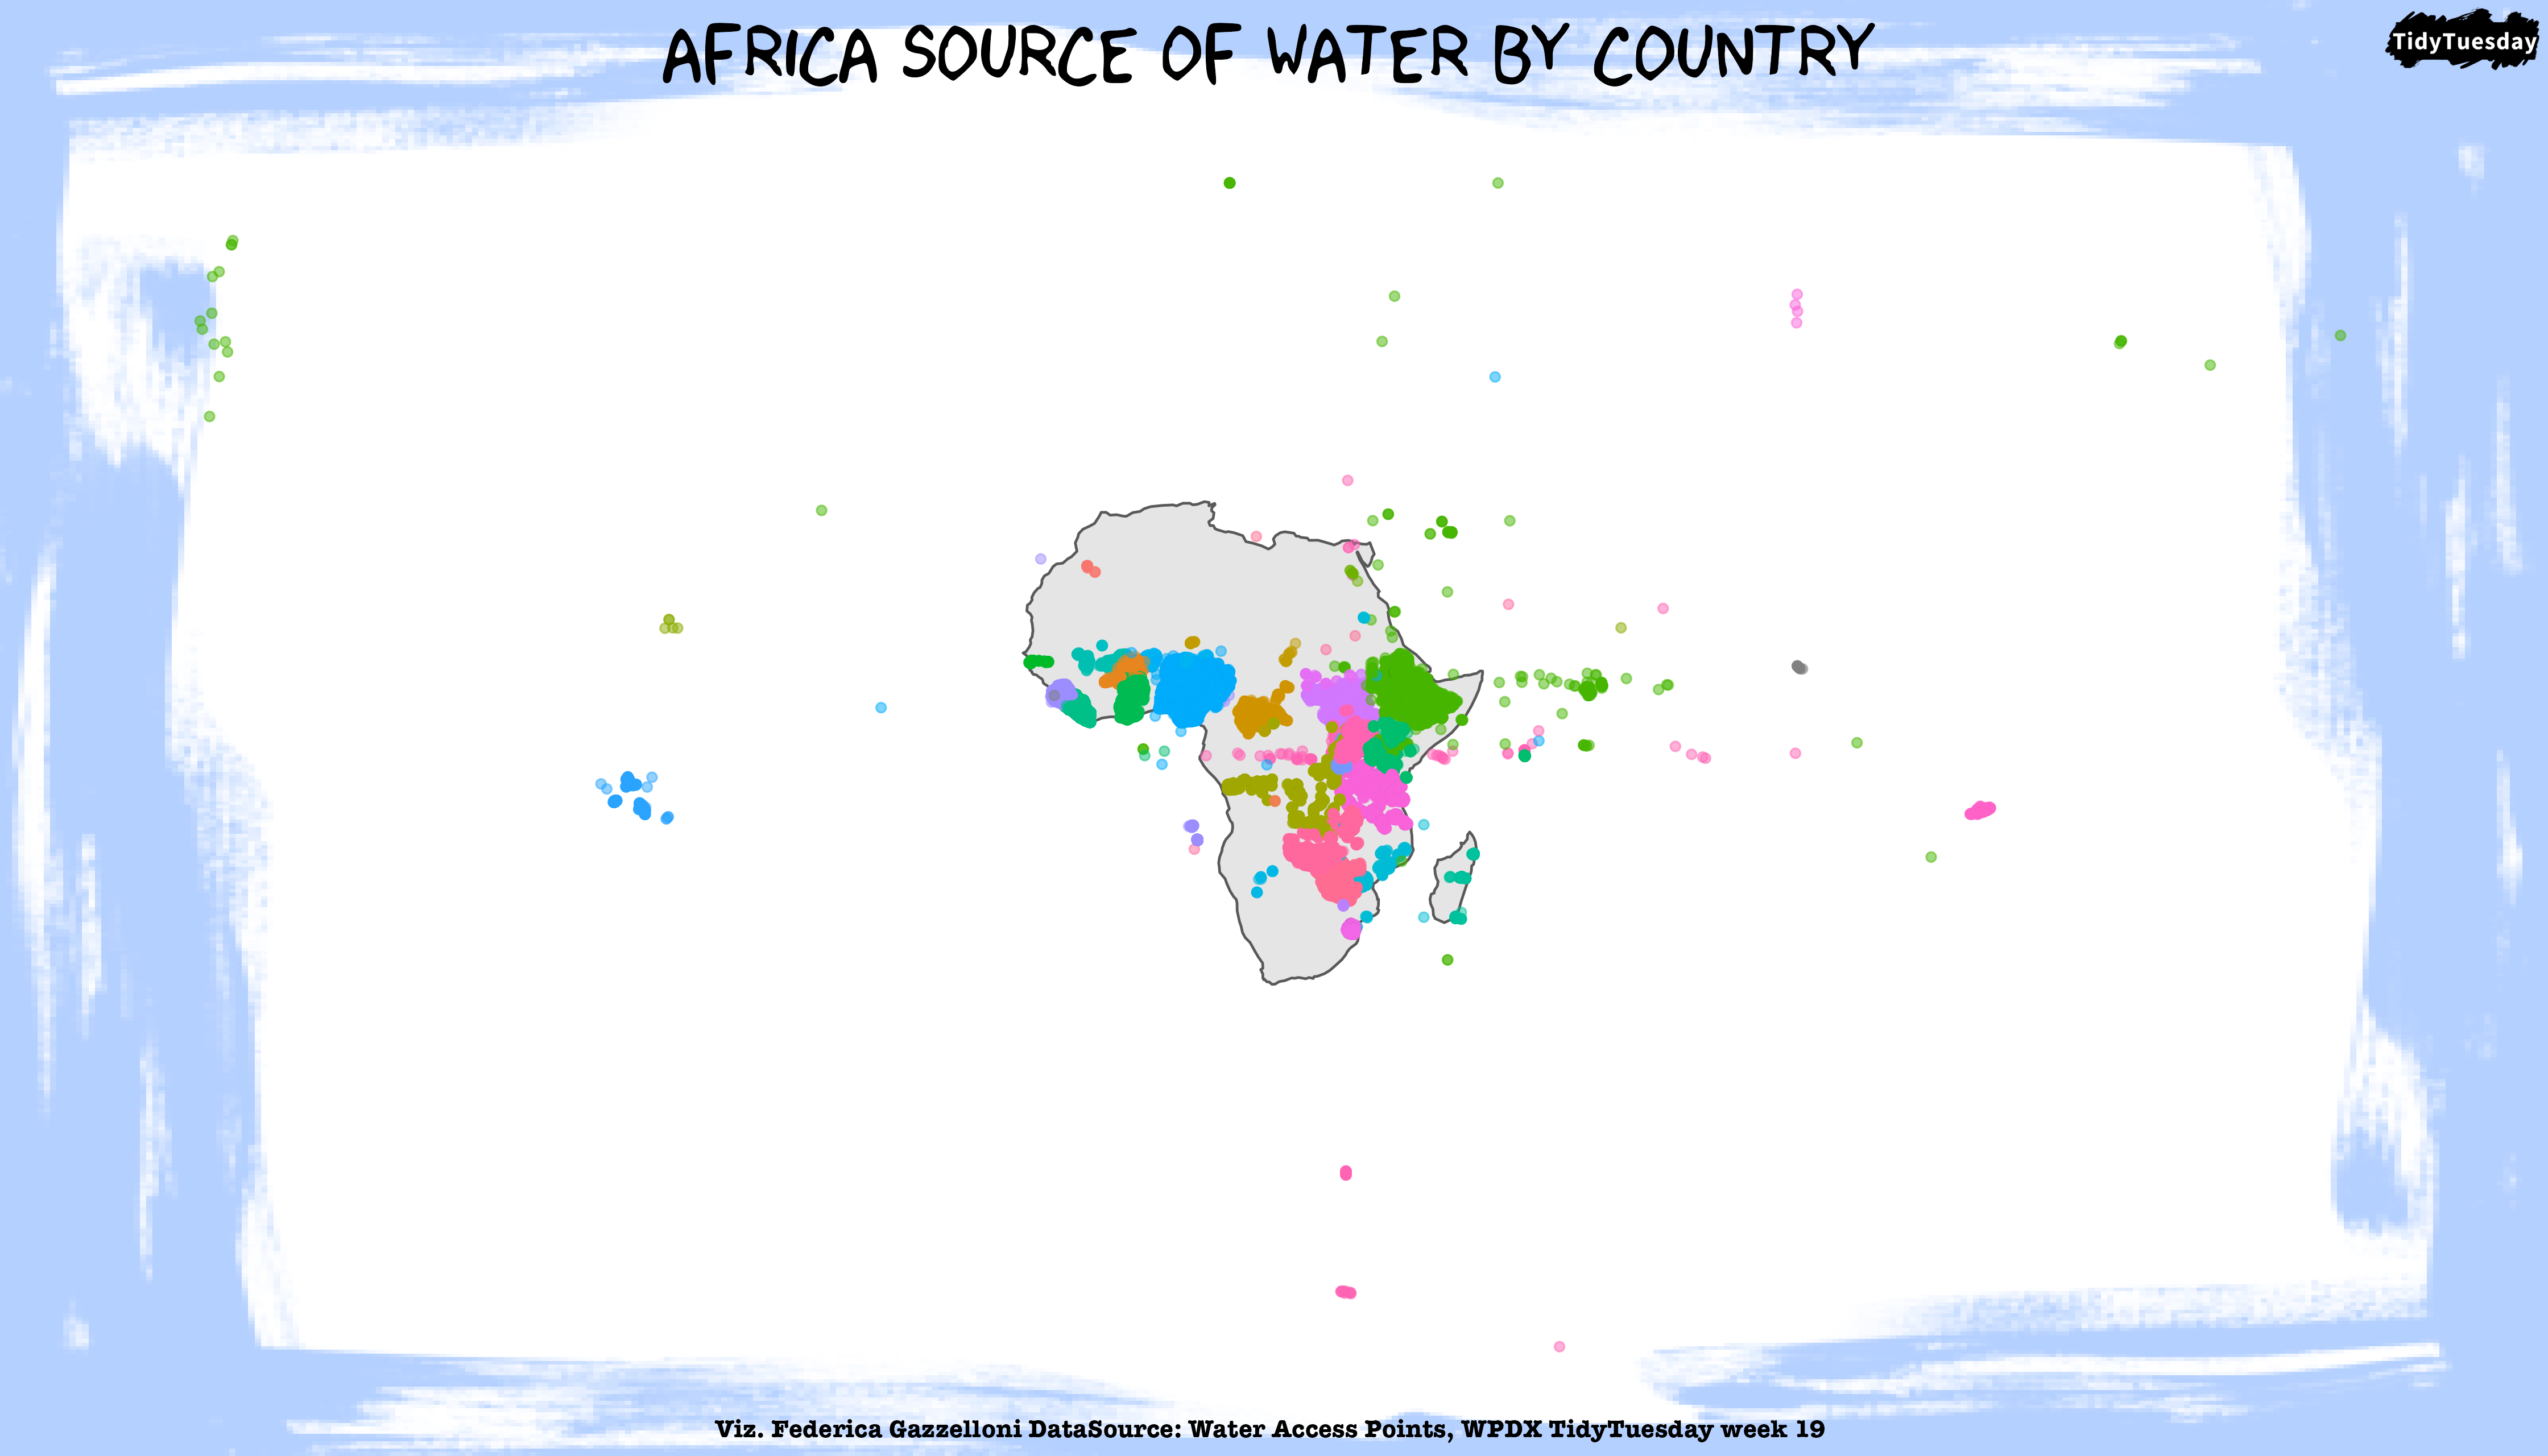
A visualization of access to water points, exploring the distribution of water services in the dataset.
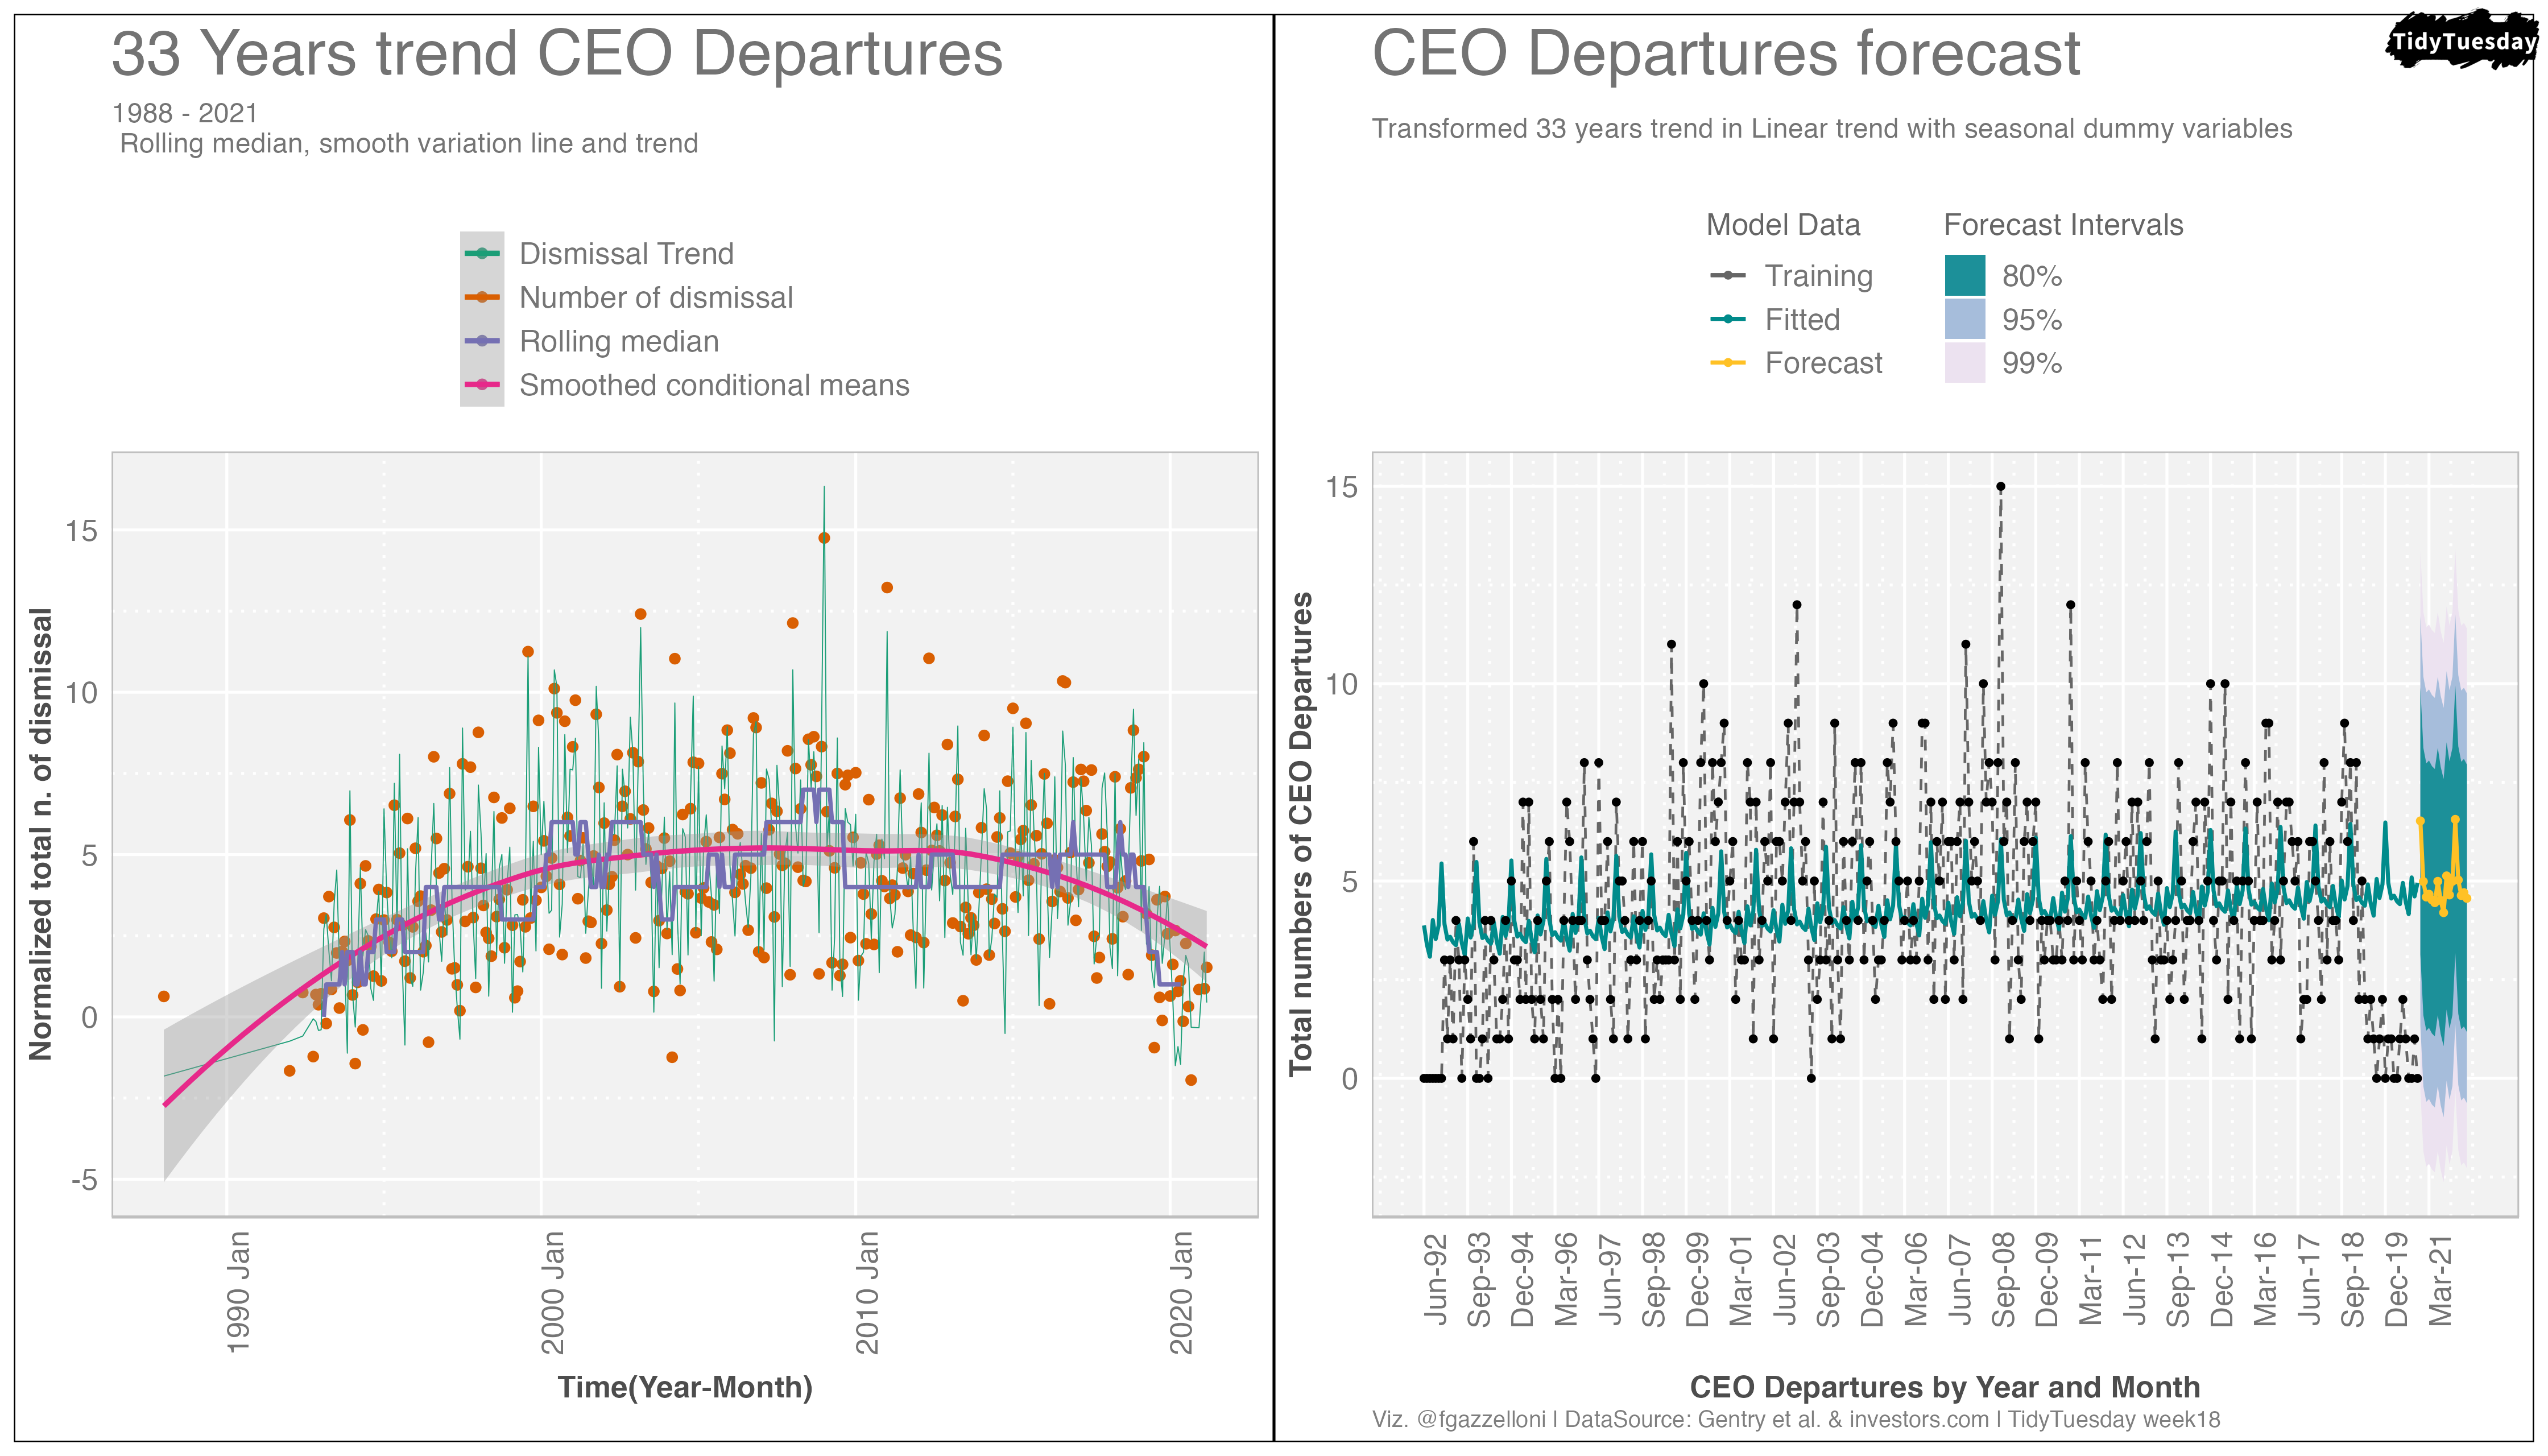
A time-series visualization of CEO departures and dismissal trends using the TidyTuesday dataset.
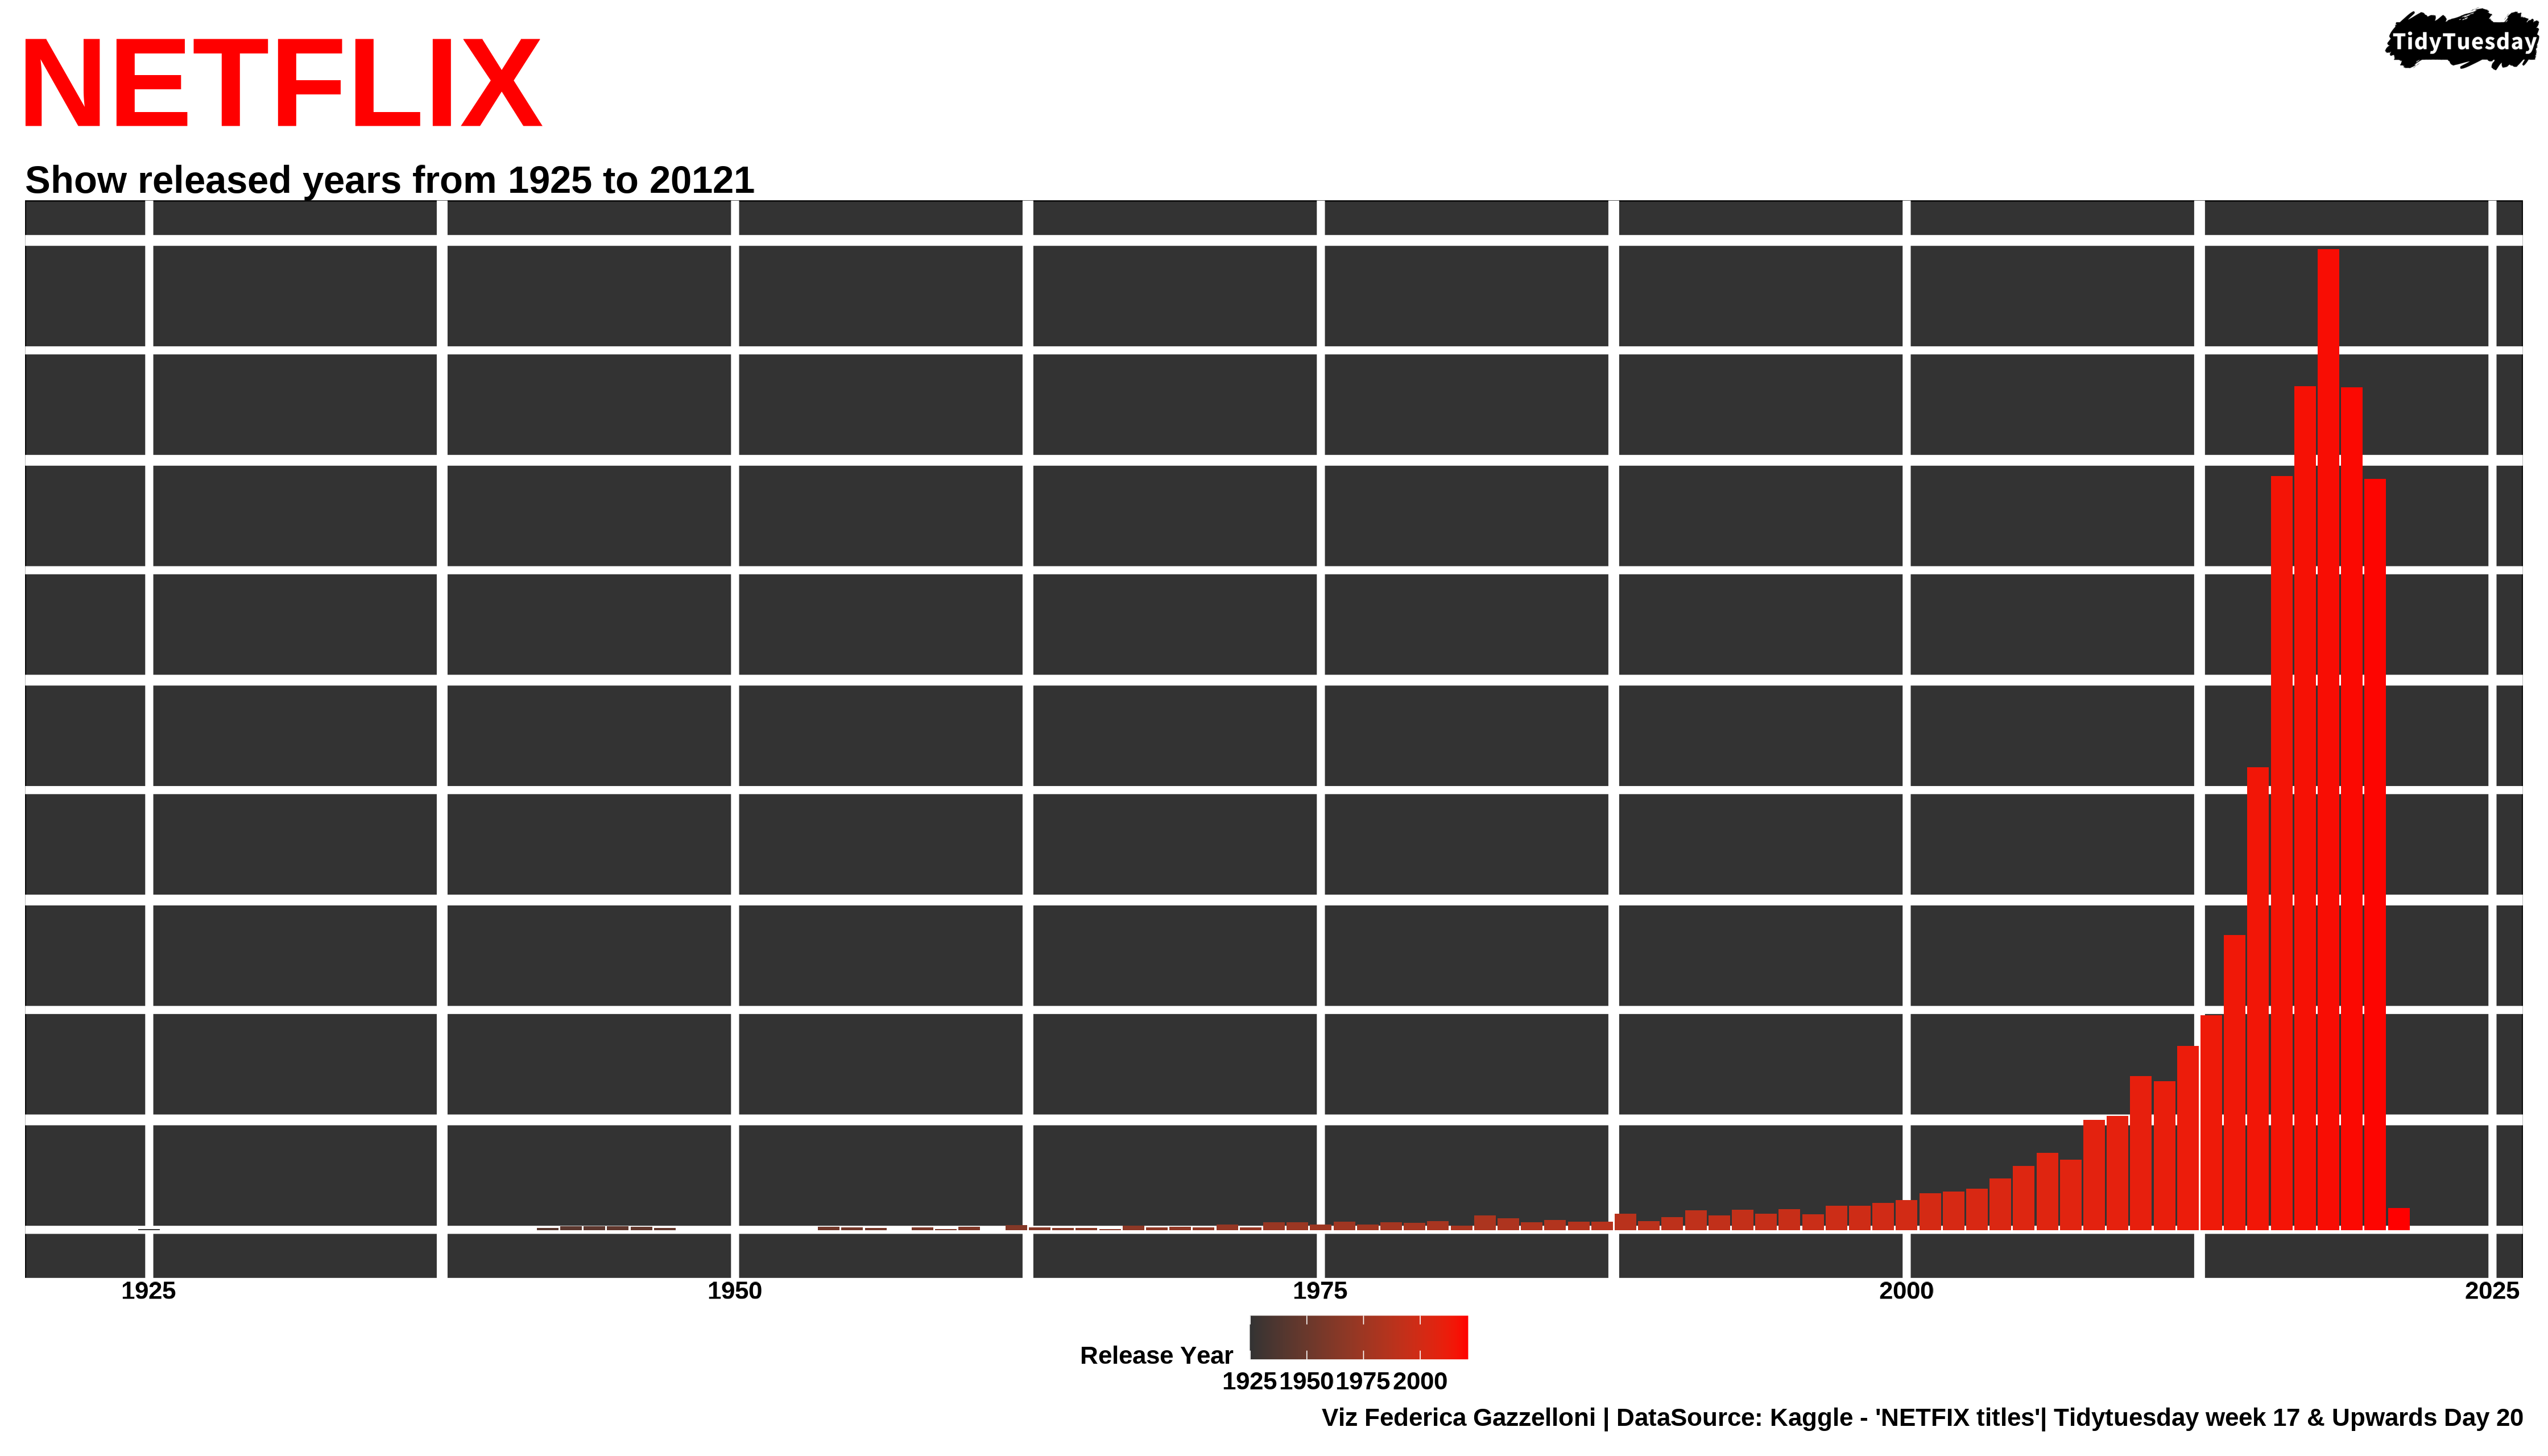
A chart of Netflix titles by release year, exploring changes in the streaming catalog over time.
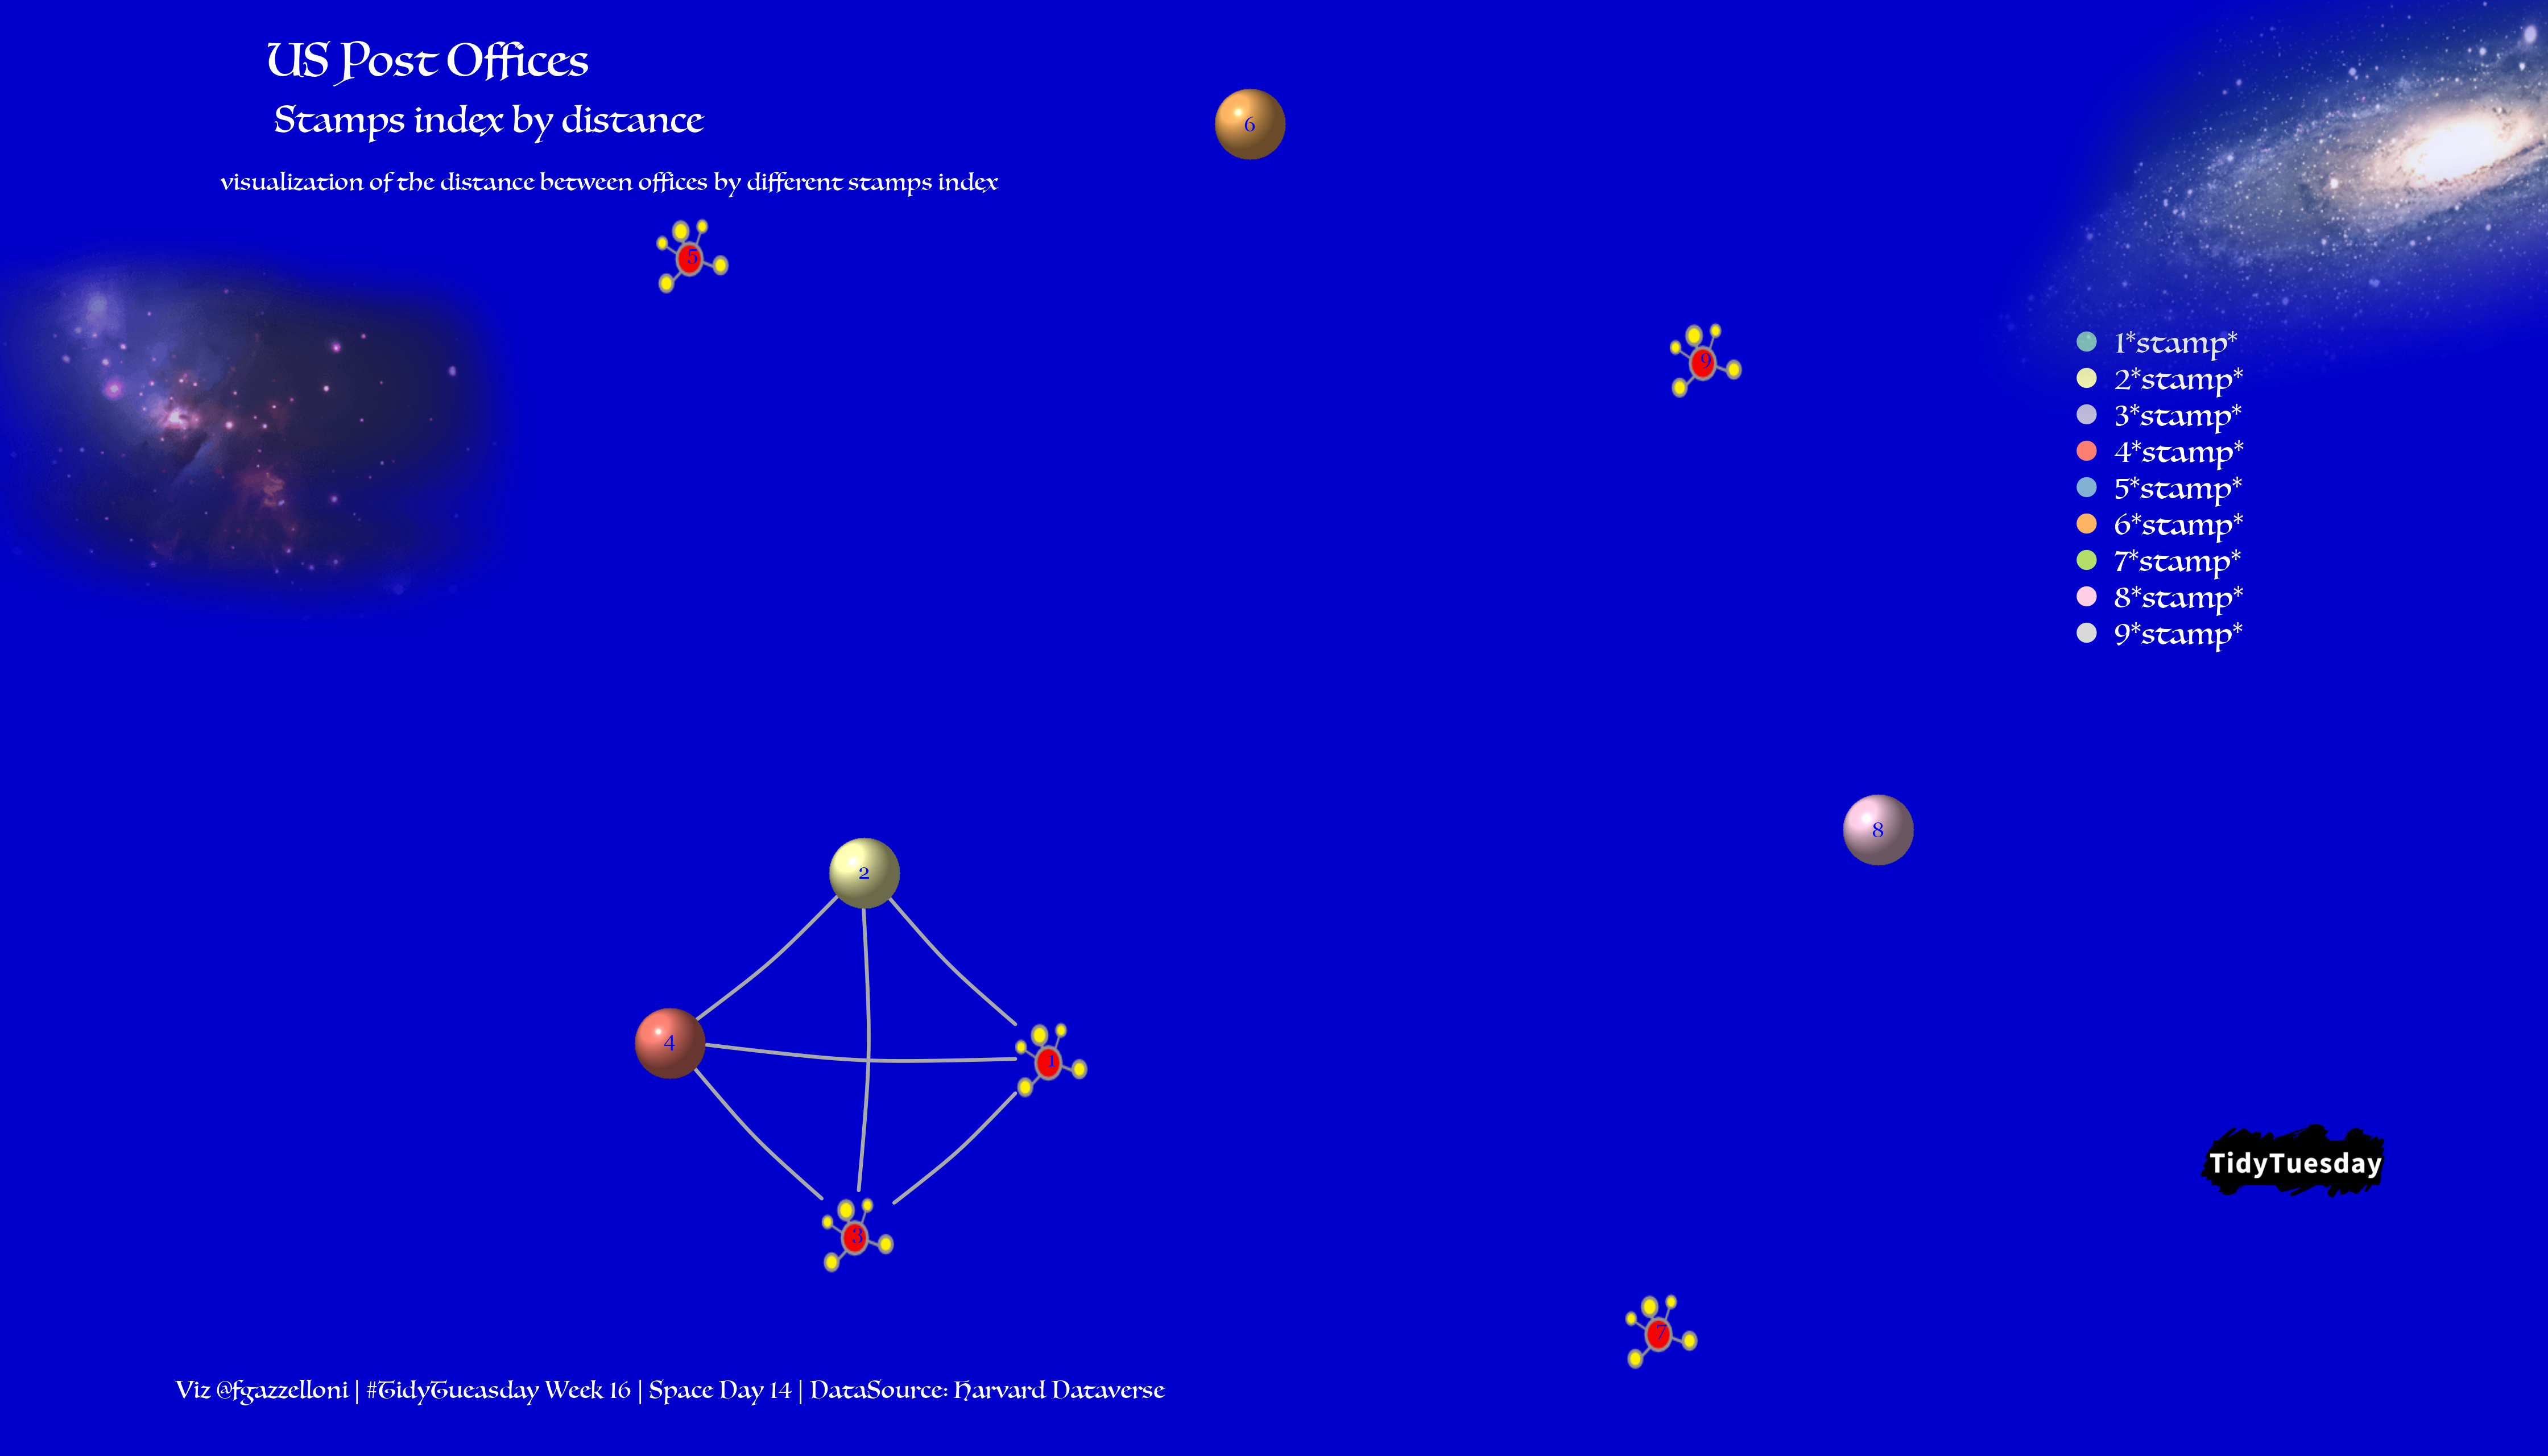
A visualization of US post office locations and characteristics from the TidyTuesday 2021 Week 16 dataset.
Environment
Connections
Social Networks