A waffle chart and data exploration of Star Trek books, stories, episodes, and series timelines.
A visualization comparing weather forecast accuracy using temperature and precipitation data.
A time-series comparison of monthly retail sales across US states.
A visualization exploring elevator data and the characteristics recorded in the dataset.
A visualization of FIFA World Cup teams, matches, and tournament results.
A geographic and statistical overview of museums across the United Kingdom.
A visualization exploring web-page metrics and how the recorded measures vary.
A map-based view of US FM radio stations and their service coverage points.
A comparison of horror films using release, rating, and genre information from the dataset.
A visualization of Great British Bake Off contestants, episodes, and competition results.
A text analysis of dialogue from the Stranger Things television series.
A visualization exploring yarn and knitting-project data from the Ravelry dataset.
A visualization of Product Hunt launches and product characteristics from the TidyTuesday dataset.
A visualization of artists in the United States, exploring their locations and recorded characteristics.
A geographic visualization of hydroelectric and wastewater facilities and their locations.
A map-based exploration of reported Bigfoot sightings and their locations.
A visualization of LEGO sets, comparing their themes, release years, and design attributes.
A comparison of Pell Grant awards and recipients across institutions or reporting years.
A visualization exploring data from the CHIP dataset and its recorded observations.
A text-based visualization of personality descriptions from the Open Source Psychometrics dataset.
A comparison of Ferris wheels using attributes such as location, height, and capacity.
A visualization exploring Oregon spotted frog observations and population data.
A personal data visualization created for the TidyTuesday 2022 bring-your-own-data prompt.
A timeline of technology adoption across more than 150 countries, covering developments since 1800.
A flow-map visualization of European flight routes and connections.
A visualization of San Francisco rental listings, comparing property locations and rental characteristics.
A comparison of the UK gender pay gap across employers and sectors.
A historical visualization using Juneteenth-related data to explore Black history and emancipation.
A map-based view of US drought conditions across states and reporting periods.
A visualization of company scores from the Human Rights Campaign Corporate Equality Index.
A comparison of public reputation ratings for prominent companies from the Axios Harris Poll.
A visualization exploring women’s rugby matches, teams, and results in the dataset.
A comparison of Eurovision entries and contest results across countries and years.
A visualization exploring books listed on the New York Times bestseller lists.
A visualization of solar and wind utilities, comparing renewable energy installations and production.
A boxplot comparison of word frequency in Kaggle Hidden Gems reviews, using notches to compare medians.
A visualization of crossword clues and answers, exploring word patterns in the TidyTuesday dataset.
A comparison of deaths associated with household air pollution from solid fuels across years and populations.
A visualization of digital publication data, comparing publications and their reported characteristics.
A comparison of collegiate athletics budgets across sports programs and institutions.
A word-cloud visualization of baby names from the TidyTuesday 2022 dataset.
A visualization exploring CRAN and Bioconductor package vignettes and their publication details.
A network visualization of Erasmus student mobility between participating countries.
A map-based view of alternative-fuel station locations across the United States.
A country-level comparison of scores in the World Freedom Index.
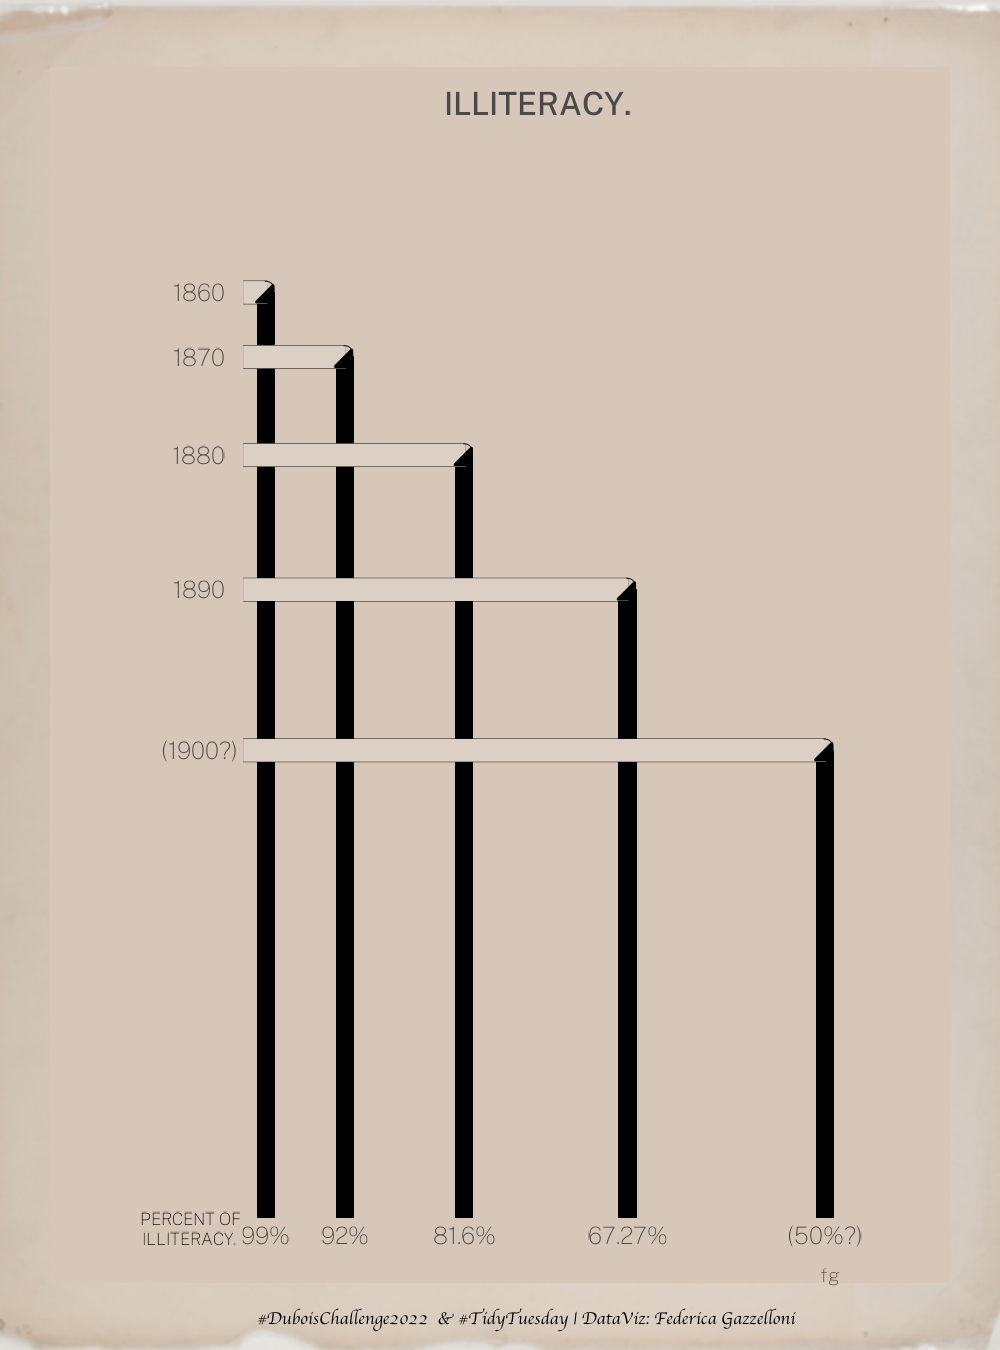
A recreation of W.E.B. Du Bois’s sixth data portrait for the 2022 DuBois Challenge.
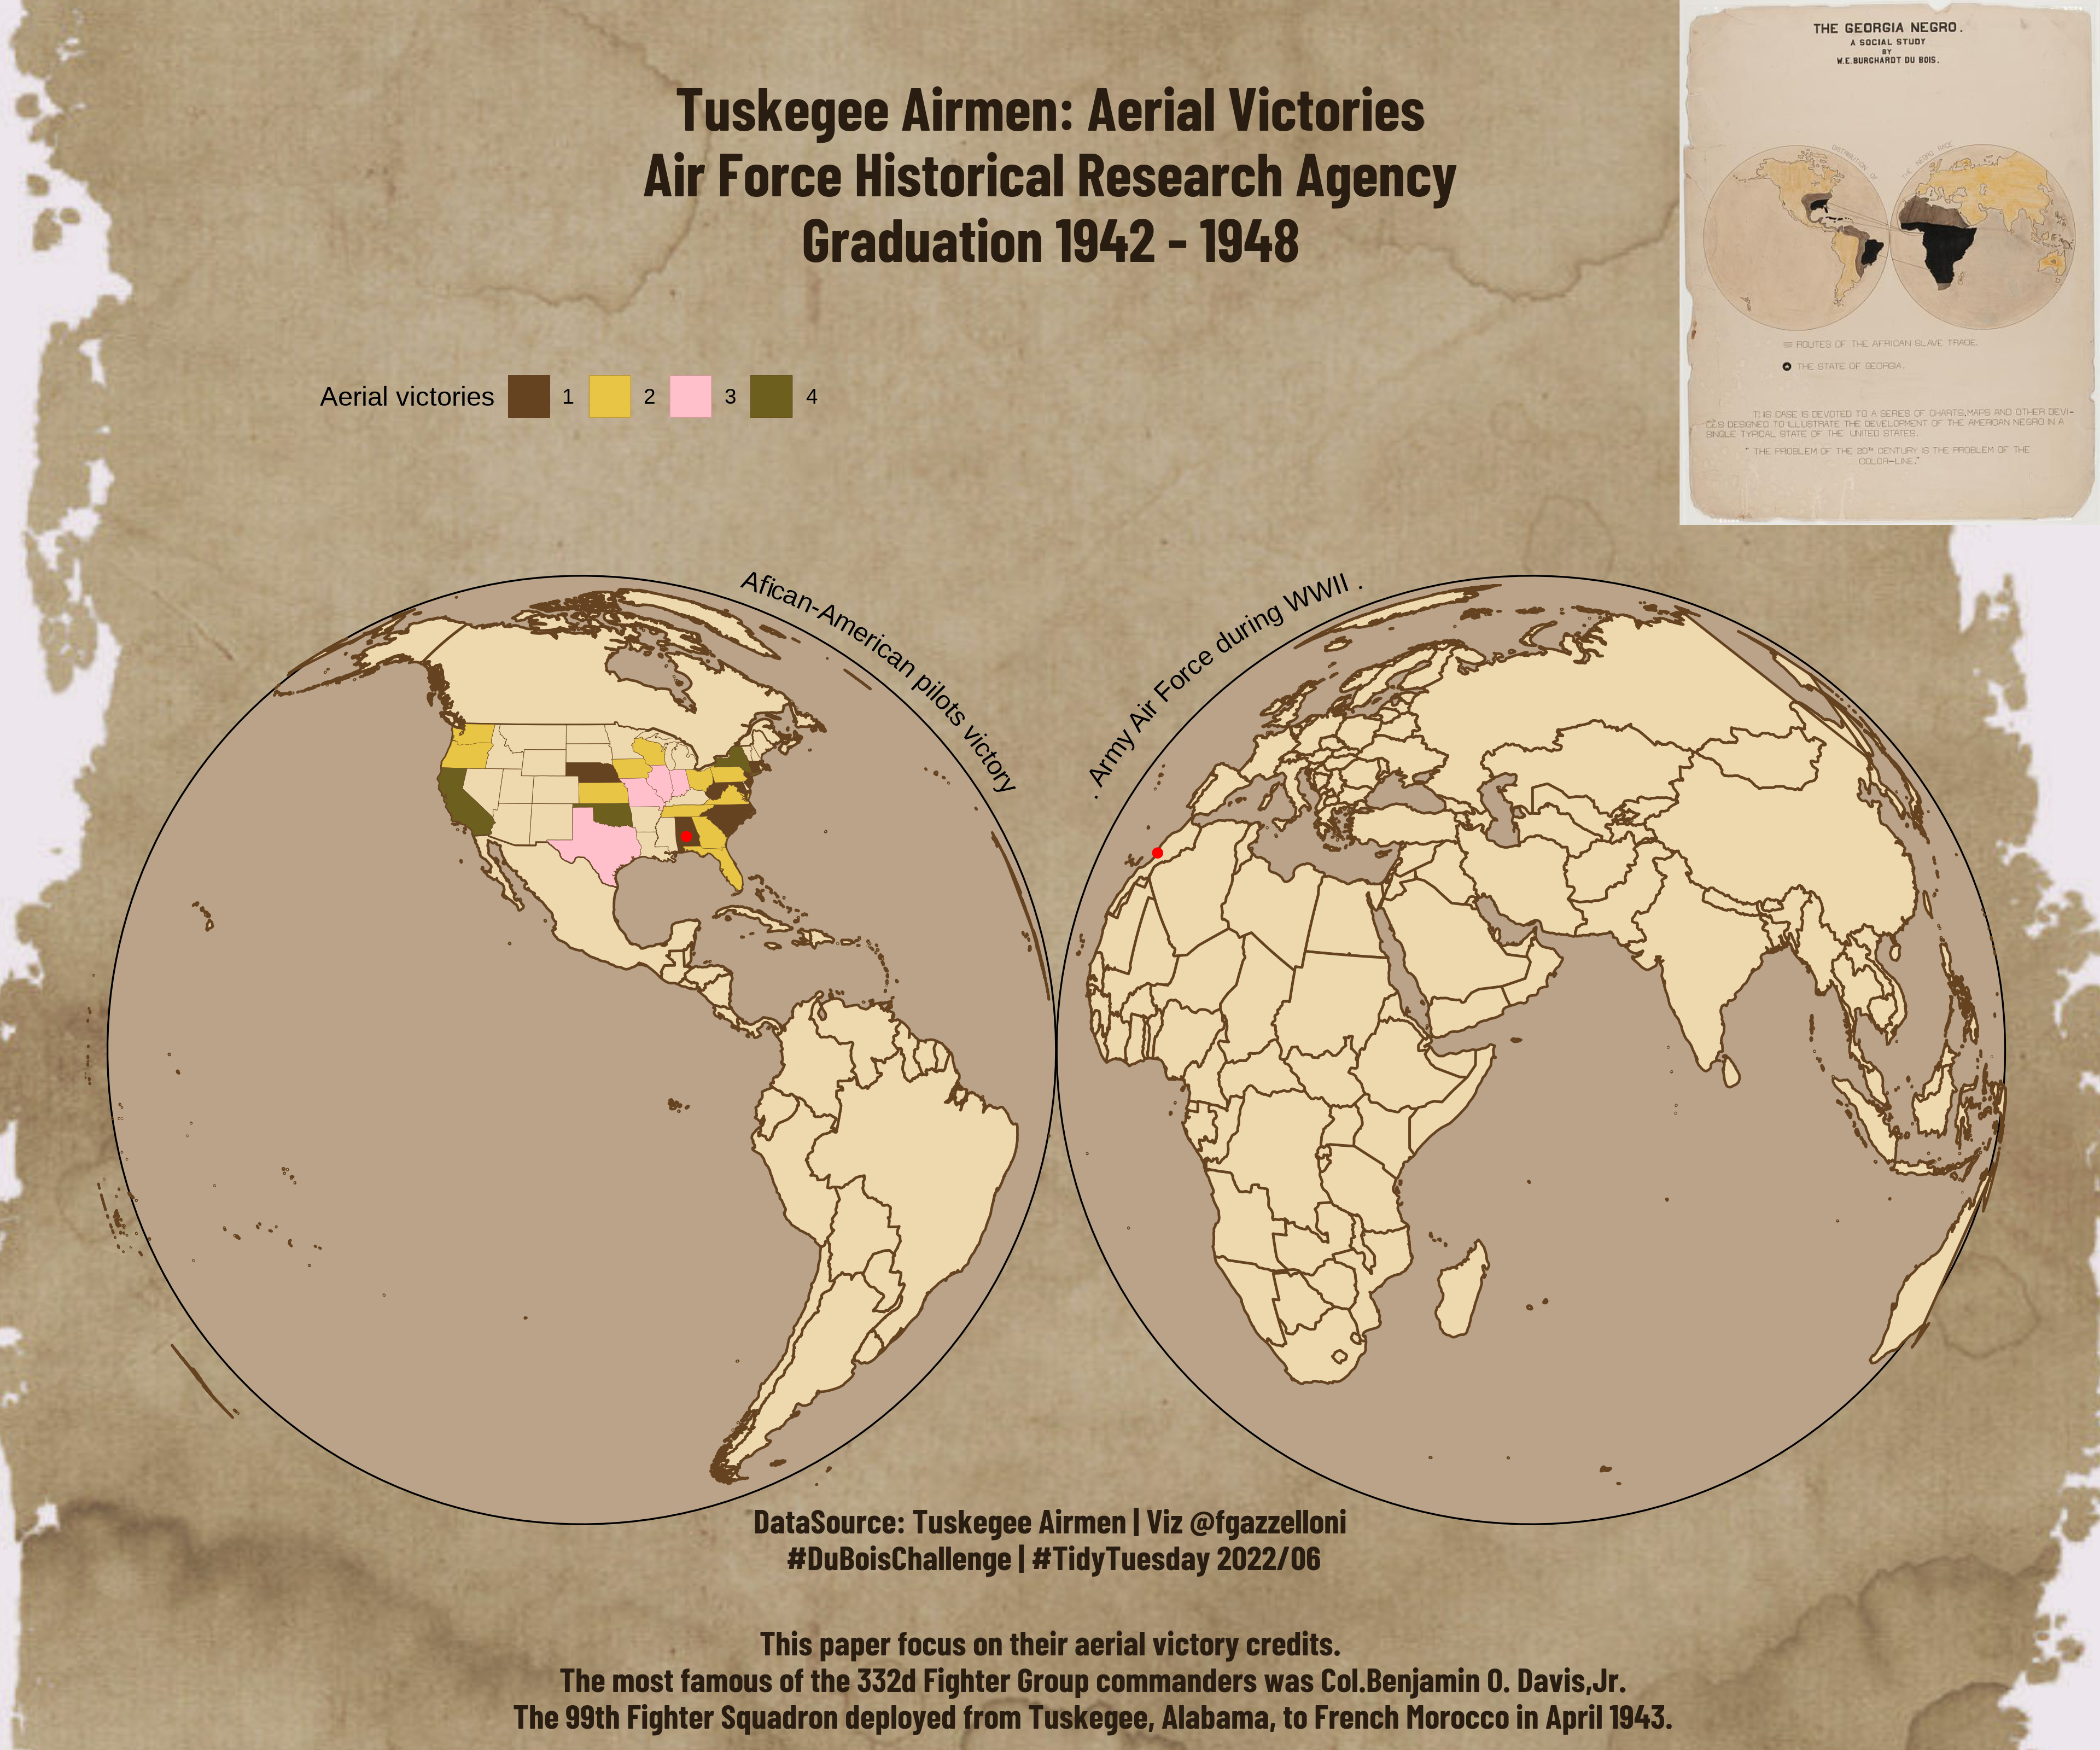
A visualization of the Tuskegee Airmen and historical data about their service.
A comparison of dog breeds using their characteristics and measurements from the TidyTuesday dataset.
A network visualization of board-game mechanics, showing how the network changes with its parameters.
A comparison of chocolate bar ratings by cocoa percentage, maker, and country of origin.
A visualization of reported honey bee colony losses across locations and reporting periods.
A visualization based on the author’s chosen dataset for the TidyTuesday 2022 bring-your-own-data week.