Code
library(ggplot2)
theme_set(theme_minimal(base_size = 13))
training_data <- data.frame(
x = 1:8,
y = c(2.9, 3.4, 4.5, 5.0, 6.3, 6.7, 7.8, 8.1)
)
training_data x y
1 1 2.9
2 2 3.4
3 3 4.5
4 4 5.0
5 5 6.3
6 6 6.7
7 7 7.8
8 8 8.1A blended teaching workflow combining the mechanics of learning with a real WNV prediction problem
Perspectives:
The goal is to understand both the mathematical idea of learning and the practical pipeline used in applied work.
Open the 12-slide presentation Download the editable PowerPoint
The slide deck introduces the broader multi-model workflow. The model-performance and variable-importance values shown in the deck are illustrative. The executable notebook below contains the observed results.
By the end, we should be able to answer four questions:
The central message is:
Learning means using data to determine a model’s parameters or structure. Optimisation is the procedure used to find useful values or structures according to an objective.
These terms are connected, but they are not interchangeable.
| Concept | Question | Example |
|---|---|---|
| Model | How are inputs turned into predictions? | \(\hat y = wx + b\) |
| Loss | How wrong are the predictions? | Mean squared error |
| Optimisation | How do we search for a better model? | Gradient descent |
| Learning | What changes because of the data? | Values of \(w\) and \(b\) |
The learning cycle is:
training data
     |
     v
make predictions with the current model
     |
     v
calculate the loss
     |
     v
use an optimisation rule to update the model
     |
     +-------------------- repeat for another epoch
Optimisation is therefore not an extra step after learning. In many models, it is the mechanism through which learning happens.
To make learning concrete, we begin with a tiny regression example.
library(ggplot2)

theme_set(theme_minimal(base_size = 13))

training_data <- data.frame(
  x = 1:8,
  y = c(2.9, 3.4, 4.5, 5.0, 6.3, 6.7, 7.8, 8.1)
)

training_data
x y
1 1 2.9
2 2 3.4
3 3 4.5
4 4 5.0
5 5 6.3
6 6 6.7
7 7 7.8
8 8 8.1The model is:
\[ \hat y_i = wx_i + b, \]
where:
At the start, both parameters are set to zero.
w <- 0
b <- 0

training_data$initial_prediction <- w * training_data$x + b
training_data
x y initial_prediction
1 1 2.9 0
2 2 3.4 0
3 3 4.5 0
4 4 5.0 0
5 5 6.3 0
6 6 6.7 0
7 7 7.8 0
8 8 8.1 0We need a way to measure the gap between the observed values and the predictions. We use mean squared error:
\[ \operatorname{MSE}(w,b) = \frac{1}{n}\sum_{i=1}^{n}\left(\hat y_i-y_i\right)^2. \]
mse <- function(observed, predicted) {
  mean((predicted - observed)^2)
}

initial_loss <- mse(
  observed = training_data$y,
  predicted = training_data$initial_prediction
)

initial_loss
[1] 34.53125A loss value tells us how well the current parameters fit the training data. It does not update the parameters by itself.
Example from the article: ml-in-epidemiology-article
Gradient descent asks: in which direction should each parameter move to reduce the loss?
For MSE, the gradients are:
\[ \frac{\partial \operatorname{MSE}}{\partial w} = \frac{2}{n}\sum_{i=1}^{n}(\hat y_i-y_i)x_i \]
and
\[ \frac{\partial \operatorname{MSE}}{\partial b} = \frac{2}{n}\sum_{i=1}^{n}(\hat y_i-y_i). \]
The update rule is:
\[ w_{t+1}=w_t-\eta\frac{\partial \operatorname{MSE}}{\partial w}, \qquad b_{t+1}=b_t-\eta\frac{\partial \operatorname{MSE}}{\partial b}, \]
where \(\eta\) is the learning rate.
This is batch gradient descent because every update uses all observations.
# Starting values
w <- 0
b <- 0

learning_rate <- 0.01
n_epochs <- 5000 # 1 epoch = 1 gradient update

training_loss_history <- data.frame(
  epoch = 0:n_epochs,
  loss = NA_real_,
  w = NA_real_,
  b = NA_real_
)

starting_prediction <- w * training_data$x + b

training_loss_history[1, ] <- c(
  epoch = 0,
  loss = mse(training_data$y, starting_prediction),
  w = w,
  b = b
)

for (epoch in 1:n_epochs) {
  prediction <- w * training_data$x + b
  error <- prediction - training_data$y

  gradient_w <- mean(2 * error * training_data$x)
  gradient_b <- mean(2 * error)

  w <- w - learning_rate * gradient_w
  b <- b - learning_rate * gradient_b

  updated_prediction <- w * training_data$x + b
  training_loss_history[epoch + 1, ] <- c(
    epoch = epoch,
    loss = mse(training_data$y, updated_prediction),
    w = w,
    b = b
  )
}

learned_w <- w
learned_b <- b

data.frame(
  parameter = c("intercept b", "slope w"),
  learned_value = c(learned_b, learned_w)
)
parameter learned_value
1 intercept b 2.0357143
2 slope w 0.7892857The code follows the repeated pattern:
predict -> calculate loss-related gradients -> update w and b -> repeatThis is the essence of the learning procedure:
source("app.R")
shinyApp(
  ui = ui,
  server = server
)Base R can fit the same linear model directly.
lm_fit <- lm(y ~ x, data = training_data)
lm_coefficients <- coef(lm_fit)

coefficient_comparison <- data.frame(
  parameter = c("intercept b", "slope w"),
  gradient_descent = c(learned_b, learned_w),
  lm = c(unname(lm_coefficients[1]), unname(lm_coefficients[2]))
)

coefficient_comparison$difference <-
  coefficient_comparison$gradient_descent - coefficient_comparison$lm

coefficient_comparison
parameter gradient_descent lm difference
1 intercept b 2.0357143 2.0357143 -3.780563e-09
2 slope w 0.7892857 0.7892857 6.724220e-10stopifnot(
abs(learned_b - unname(lm_coefficients[1])) < 0.001,
abs(learned_w - unname(lm_coefficients[2])) < 0.001,
tail(training_loss_history$loss, 1) < training_loss_history$loss[1]
)This shows that different numerical routes can produce the same fitted model.
The same general ideas appear in real public-health prediction tasks.
The central question is:
Can state-level surveillance information predict whether West Nile virus activity will be observed in the next four weeks?
The goal is not causation. The goal is to learn a pattern from historical data and check whether that pattern generalizes to new observations.
In supervised learning, the model learns a mapping from features \(x\) to an outcome \(y\):
\[ \hat{f}: X \rightarrow Y. \]
We now move from the abstract learning example to a real epidemiology workflow.
# Basic libraries
library(ggplot2)
library(dplyr)
library(data.table)
library(maps)
library(pROC)wnv_path <- "data/processed/wnv_state_week.csv"# Read the processed WNV dataset
wnv <- read.csv(wnv_path, stringsAsFactors = FALSE)
# Keep useful columns
wnv <- wnv %>%
filter(week >= 18, week <= 44) %>%
select(state, region, year, week,
cases_last4, active_weeks_last8,
activity_next_4w)
# Rename columns
names(wnv) <- c("state", "region", "year", "week",
"recent_cases", "recent_active_weeks", "outcome")
# Prepare the target for classification
wnv$region <- factor(wnv$region)
wnv$outcome <- factor(wnv$outcome, levels = c("no", "yes"))
# Explore the class distribution
table(wnv$outcome)
  no  yes
4936 572 round(prop.table(table(wnv$outcome)), 3)
   no   yes
0.896 0.104
We split the data into training and holdout test periods.
# Split into training and test data
train <- subset(wnv, year <= 2024)
test <- subset(wnv, year == 2025)This is a classic supervised learning setup: a model learns from historical state-week observations and predicts future activity.
model <- glm(
  outcome ~ week + recent_cases + recent_active_weeks + region,
  data = train,
  family = binomial)

summary(model)
Call:
glm(formula = outcome ~ week + recent_cases + recent_active_weeks +
    region, family = binomial, data = train)

Coefficients:
                     Estimate Std. Error z value Pr(>|z|)
(Intercept)         -3.120715   0.282813 -11.035  < 2e-16 ***
week                 0.009273   0.007968   1.164 0.244515
recent_cases         0.278467   0.066101   4.213 2.52e-05 ***
recent_active_weeks  0.478830   0.080663   5.936 2.92e-09 ***
regionNortheast     -0.311733   0.224622  -1.388 0.165195
regionSouth          0.614242   0.161219   3.810 0.000139 ***
regionWest           0.107259   0.181644   0.590 0.554862
---
Signif. codes:  0 '***' 0.001 '**' 0.01 '*' 0.05 '.' 0.1 ' ' 1

(Dispersion parameter for binomial family taken to be 1)

    Null deviance: 2685.4  on 4130  degrees of freedom
Residual deviance: 2209.2  on 4124  degrees of freedom
AIC: 2223.2

Number of Fisher Scoring iterations: 6# Predict probabilities on unseen data
prob_yes <- predict(model, newdata = test, type = "response")
# Convert probabilities to class labels
predicted <- ifelse(prob_yes >= 0.5, "yes", "no")
predicted <- factor(predicted, levels = c("no", "yes"))
# Compare predictions with reality
confusion <- table(Actual = test$outcome, Predicted = predicted)
confusion Predicted
Actual no yes
no 1206 12
yes 112 47accuracy <- sum(diag(confusion)) / sum(confusion)
cat("Accuracy:", round(accuracy, 3), "\n")Accuracy: 0.91 This workflow shows the classic machine-learning cycle:
The more modern workflow compares multiple learners and uses probabilities directly.
library(data.table)
library(mlr3)
library(mlr3learners)wnv_ml <- fread(wnv_path) |> # Similar to read.csv() and read.delim()
filter(week >= 18, week <= 44) |>
select(state, region, year, week,
cases_lag1, cases_lag2, cases_lag4,
cases_last4, cases_last8, active_weeks_last8,
week_sin, week_cos, activity_next_4w) |>
mutate(
region = factor(region,
levels = c("Northeast", "South",
"North Central", "West")),
activity_next_4w = factor(activity_next_4w,
levels = c("no", "yes")))
feature_columns <- c(
"region",
"cases_lag1",
"cases_lag2",
"cases_lag4",
"cases_last4",
"cases_last8",
"active_weeks_last8",
"week_sin",
"week_cos"
)
train_data <- wnv_ml |> filter(year <= 2024)
test_data <- wnv_ml |> filter(year == 2025)
train_task <- TaskClassif$new(
id = "wnv-train",
backend = train_data[, c("activity_next_4w", feature_columns),
with = FALSE],
target = "activity_next_4w",
positive = "yes")
test_task <- TaskClassif$new(
id = "wnv-test",
backend = test_data[, c("activity_next_4w", feature_columns),
with = FALSE],
target = "activity_next_4w",
positive = "yes")learner_logistic <- lrn(
"classif.log_reg",
id = "Logistic regression",
predict_type = "prob")
learner_tree <- lrn(
"classif.rpart",
id = "Decision tree",
predict_type = "prob",
cp = 0.01,
maxdepth = 5,
minsplit = 40,
xval = 0)
learner_forest <- lrn(
"classif.ranger",
id = "Random forest",
predict_type = "prob",
num.trees = 500,
mtry = 3,
min.node.size = 10,
importance = "permutation",
num.threads = 1,
seed = 20260927)
learners <- list(
logistic = learner_logistic,
tree = learner_tree,
forest = learner_forest)
fitted <- lapply(learners, function(l) {
l$clone(deep = TRUE)$train(train_task)
})holdout_predictions <- rbindlist(lapply(names(fitted), function(model_name) {
pred <- fitted[[model_name]]$predict(test_task)
data.table(
model = model_name,
state = test_data$state,
year = test_data$year,
week = test_data$week,
truth = pred$truth,
probability = pred$prob[, "yes"]
)
}))
holdout_predictions model state year week truth probability
<char> <char> <int> <int> <fctr> <num>
1: logistic ALABAMA 2025 18 no 0.009258751
2: logistic ALABAMA 2025 19 no 0.047667738
3: logistic ALABAMA 2025 20 no 0.047859948
4: logistic ALABAMA 2025 21 no 0.060949608
5: logistic ALABAMA 2025 22 no 0.061731995
---
4127: forest WYOMING 2025 40 no 0.039651107
4128: forest WYOMING 2025 41 no 0.040403288
4129: forest WYOMING 2025 42 no 0.048072318
4130: forest WYOMING 2025 43 no 0.052365987
4131: forest WYOMING 2025 44 no 0.044181855summarise_model <- function(df, threshold = 0.5) {
response <- ifelse(df$probability >= threshold, "yes", "no")
response <- factor(response, levels = c("no", "yes"))
truth <- factor(df$truth, levels = c("no", "yes"))
tp <- sum(truth == "yes" & response == "yes")
fn <- sum(truth == "yes" & response == "no")
tn <- sum(truth == "no" & response == "no")
fp <- sum(truth == "no" & response == "yes")
sensitivity <- tp / (tp + fn)
specificity <- tn / (tn + fp)
accuracy <- (tp + tn) / length(truth)
bacc <- mean(c(sensitivity, specificity))
data.table(
threshold = threshold,
sensitivity = sensitivity,
specificity = specificity,
accuracy = accuracy,
balanced_accuracy = bacc,
tp = tp,
fp = fp,
tn = tn,
fn = fn
)
}summary_table <- rbindlist(lapply(split(holdout_predictions, by = "model", keep.by = TRUE), function(x) {
summarise_model(x, threshold = 0.5)
}), idcol = "model")
summary_table model threshold sensitivity specificity accuracy balanced_accuracy tp
<char> <num> <num> <num> <num> <num> <int>
1: logistic 0.5 0.2893082 0.9876847 0.9070443 0.6384965 46
2: tree 0.5 0.3144654 0.9860427 0.9084967 0.6502541 50
3: forest 0.5 0.3459119 0.9827586 0.9092229 0.6643353 55
fp tn fn
<int> <int> <int>
1: 15 1203 113
2: 17 1201 109
3: 21 1197 104This is framing of supervised learning and model evaluation: compare models, use probabilities, and evaluate generalization on unseen data.
library(pROC)roc_data <- rbindlist(lapply(unique(holdout_predictions$model),
function(m) {
pred <- holdout_predictions[model == m]
obj <- roc(pred$truth, pred$probability,
levels = c("no", "yes"), quiet = TRUE)
data.table(
model = m,
fpr = rev(obj$specificities),
tpr = rev(obj$sensitivities)
)
}))
ggplot(roc_data, aes(x = 1 - fpr, y = tpr, colour = model)) +
geom_line(linewidth = 1) +
geom_abline(intercept = 0, slope = 1,
linetype = 2, colour = "grey55") +
labs(
title = "ROC curves for WNV prediction models",
x = "False-positive rate",
y = "Sensitivity",
colour = "Model"
) +
theme_minimal()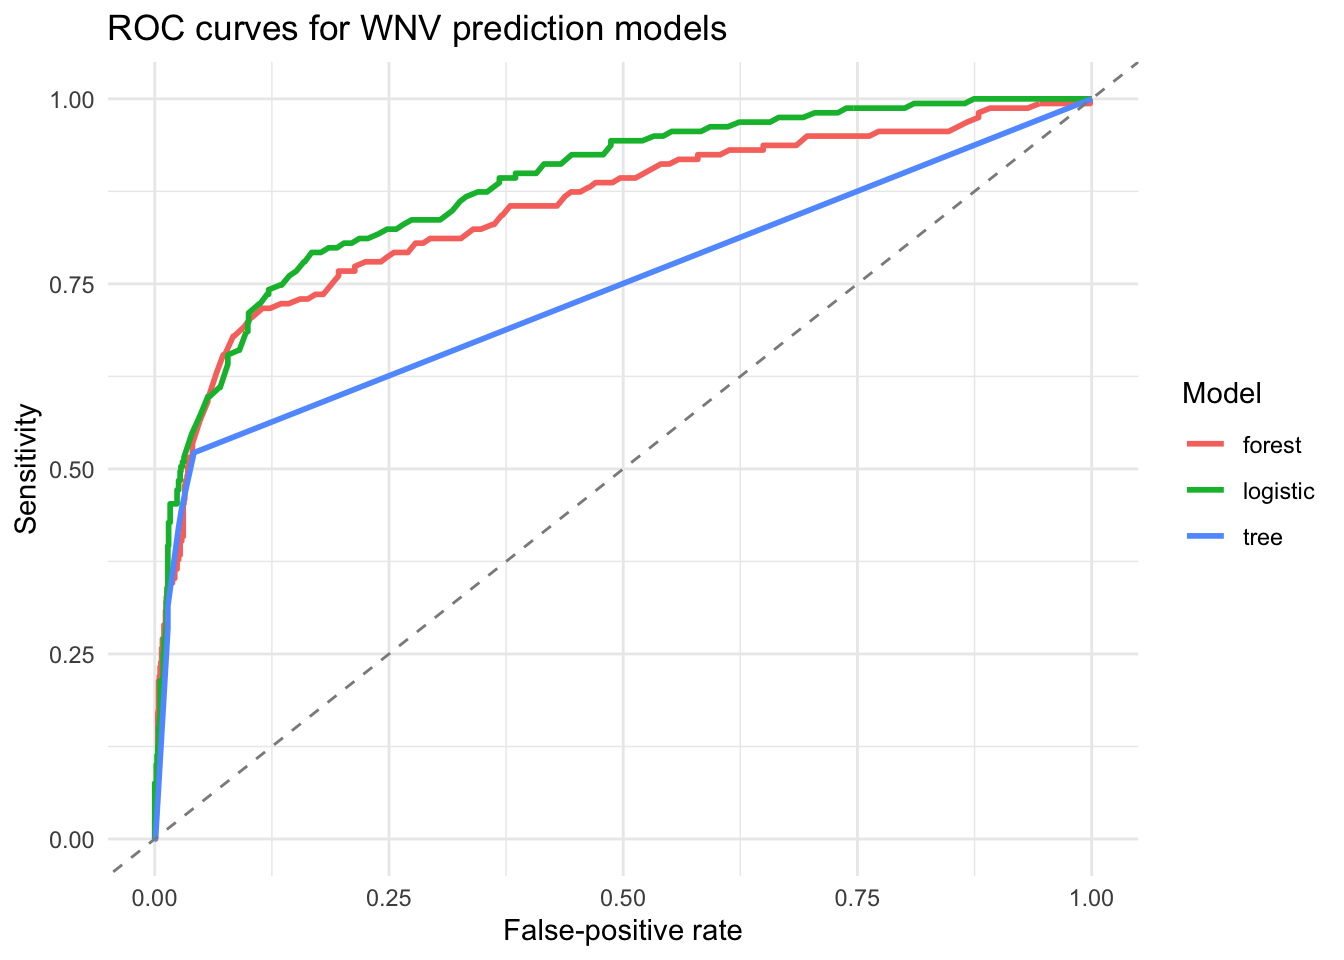
confusion_data <- rbindlist(lapply(unique(holdout_predictions$model), function(m) {
  pred <- holdout_predictions[model == m]
  pred$response <- ifelse(pred$probability >= 0.5, "yes", "no")
  tab <- table(Actual = pred$truth, Predicted = pred$response)
  data.table(
    model = m,
    truth = rep(c("no", "yes"), each = 2),
    response = rep(c("no", "yes"), times = 2),
    count = as.vector(tab)
  )
}))

ggplot(confusion_data, aes(response, truth, fill = count)) +
  geom_tile(color = "white") +
  geom_text(aes(label = count), fontface = "bold") +
  scale_fill_gradient(low = "#F3E8FF", high = "#6D28D9") +
  facet_wrap(~ model) +
  labs(
    title = "Confusion matrices on the 2025 holdout set",
    x = "Predicted class",
    y = "Observed class",
    fill = "Count"
  ) +
  theme_minimal()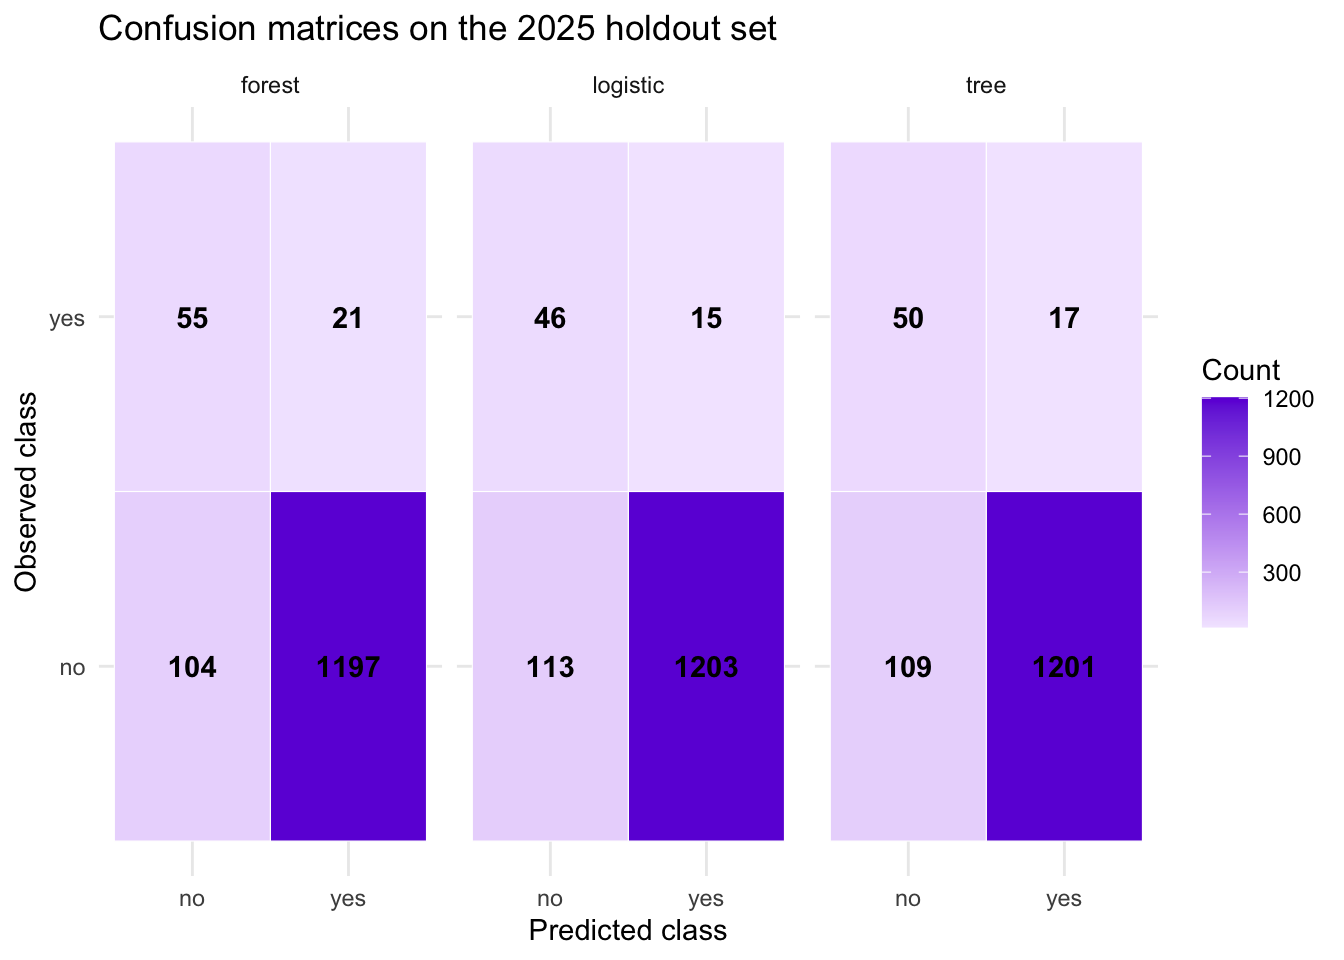
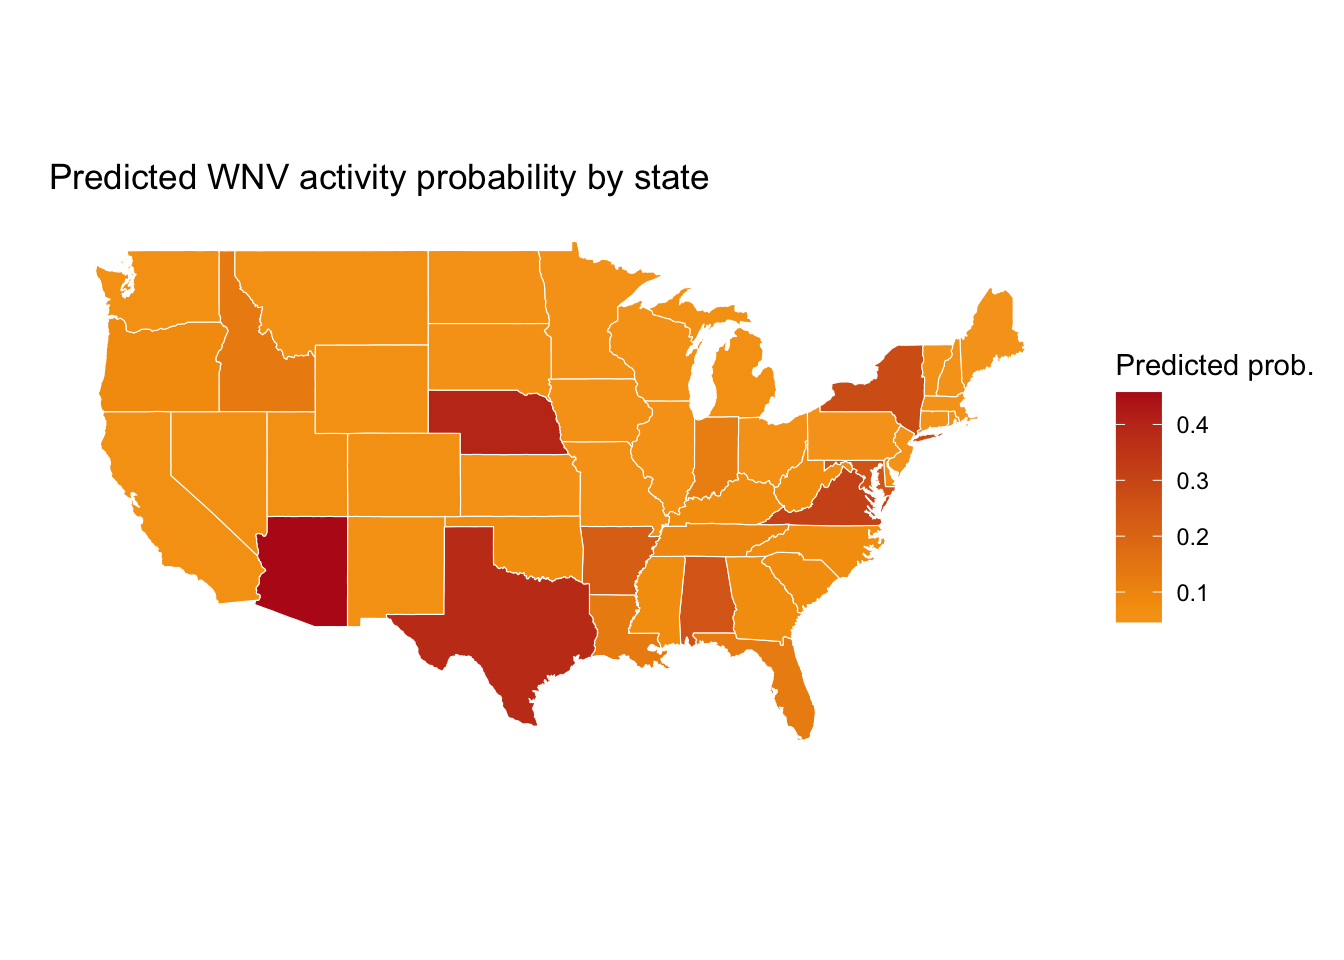
state_predictions <- holdout_predictions |>
  group_by(state) |>
  summarise(predicted_probability = mean(probability), .groups = "drop")

state_map <- map_data("state")
state_map <- state_map |>
  rename(state = region) |>
  left_join(
    state_predictions |> mutate(state = tolower(state)),
    by = "state"
  )

ggplot(state_map, aes(long, lat, group = group, fill = predicted_probability)) +
  geom_polygon(color = "white", linewidth = 0.2) +
  coord_map() +
  scale_fill_gradient2(
    low = "#FDE68A",
    mid = "#F59E0B",
    high = "#B91C1C",
    midpoint = median(state_map$predicted_probability, na.rm = TRUE)
  ) +
  labs(
    title = "Predicted WNV activity probability by state",
    x = "",
    y = "",
    fill = "Predicted prob."
  ) +
  theme_minimal() +
  theme(
    panel.grid = element_blank(),
    axis.text = element_blank(),
    axis.ticks = element_blank()
  )
The point of the workflow is not only to fit a model but to explain how machine learning works in practice.
A typical sequence is:
This is the bridge between the abstract learning cycle and applied epidemiology.
The conceptual notebook shows that learning is about using data to update model parameters or structure according to a loss function and an optimization scheme.
The epidemiology workflow shows how the same logic is used in a real decision problem: predict whether WNV activity will be observed in future weeks using information available at the current time.
The same essential pattern appears in both:
data -> model -> predictions -> loss -> update -> repeat -> evaluationThat is the heart of machine learning.