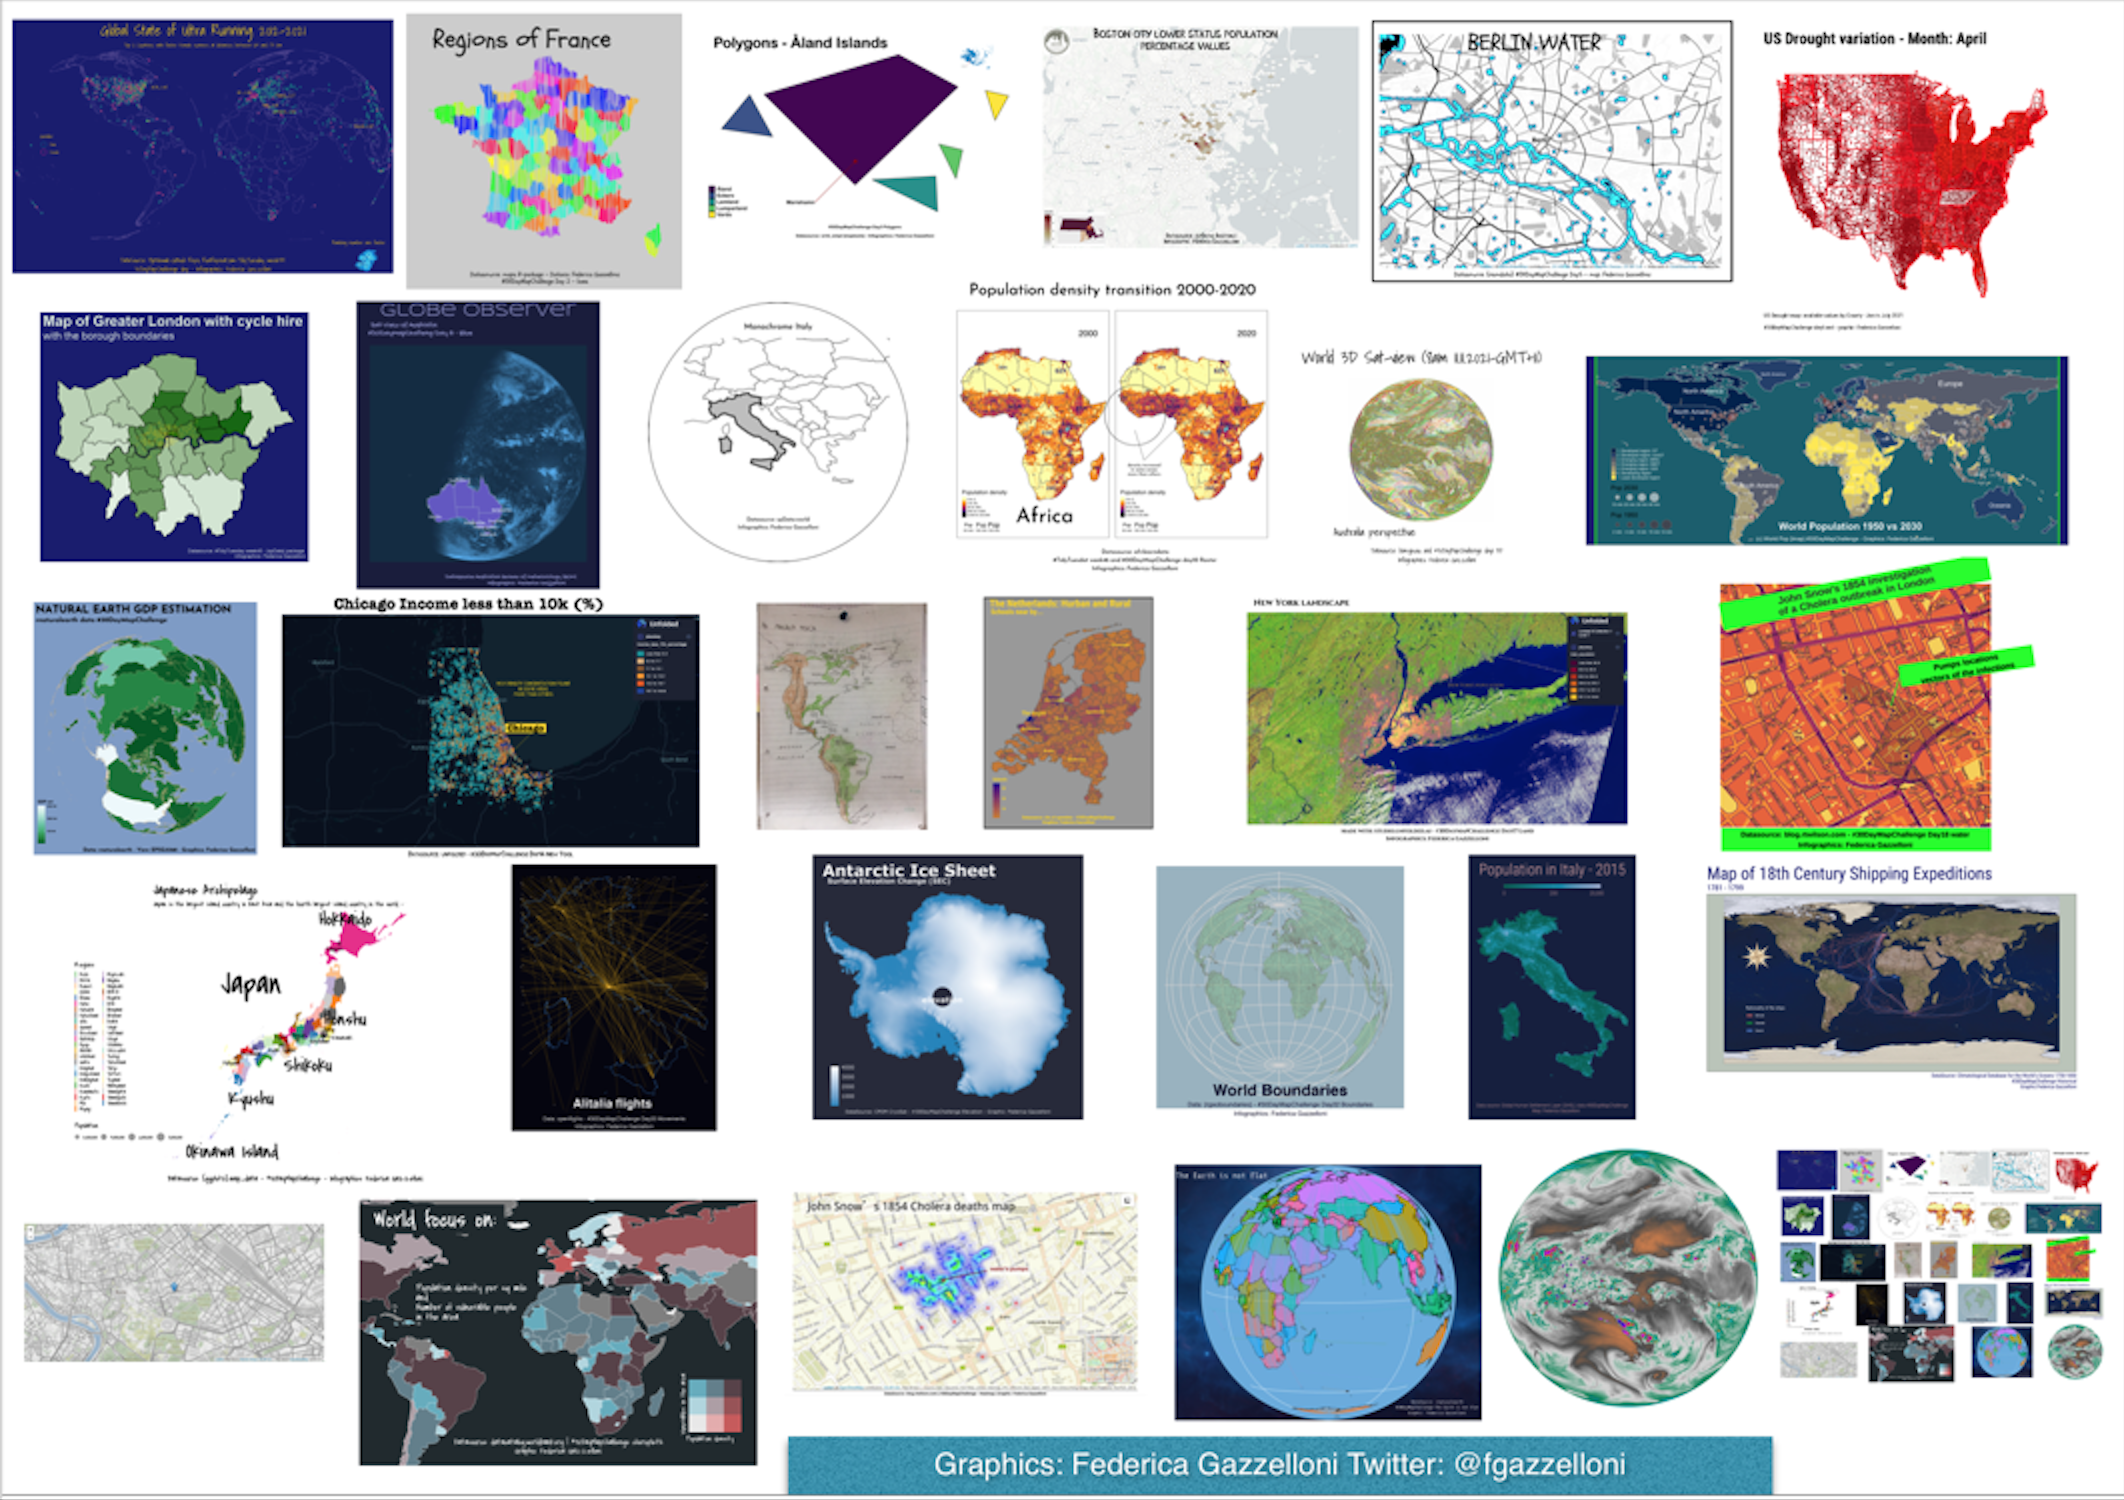
Metamapping: a collage of all maps made for 2021
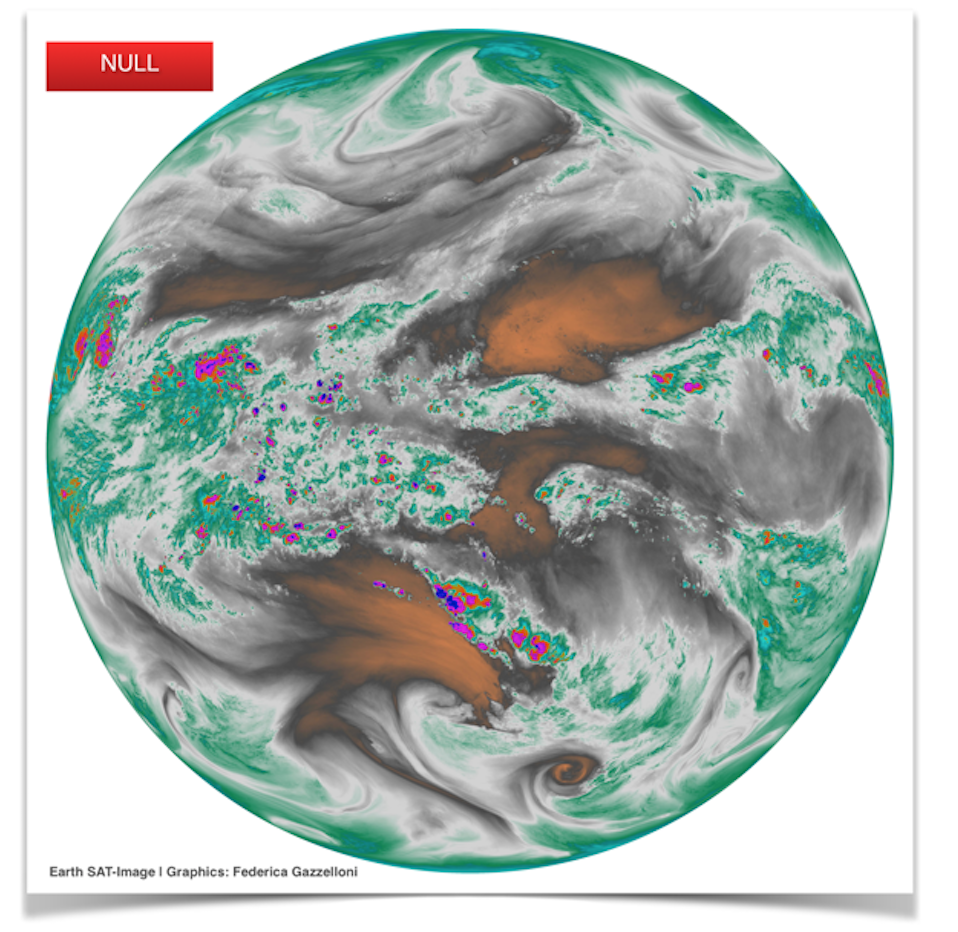
Earth .tif image from Earth-SAT
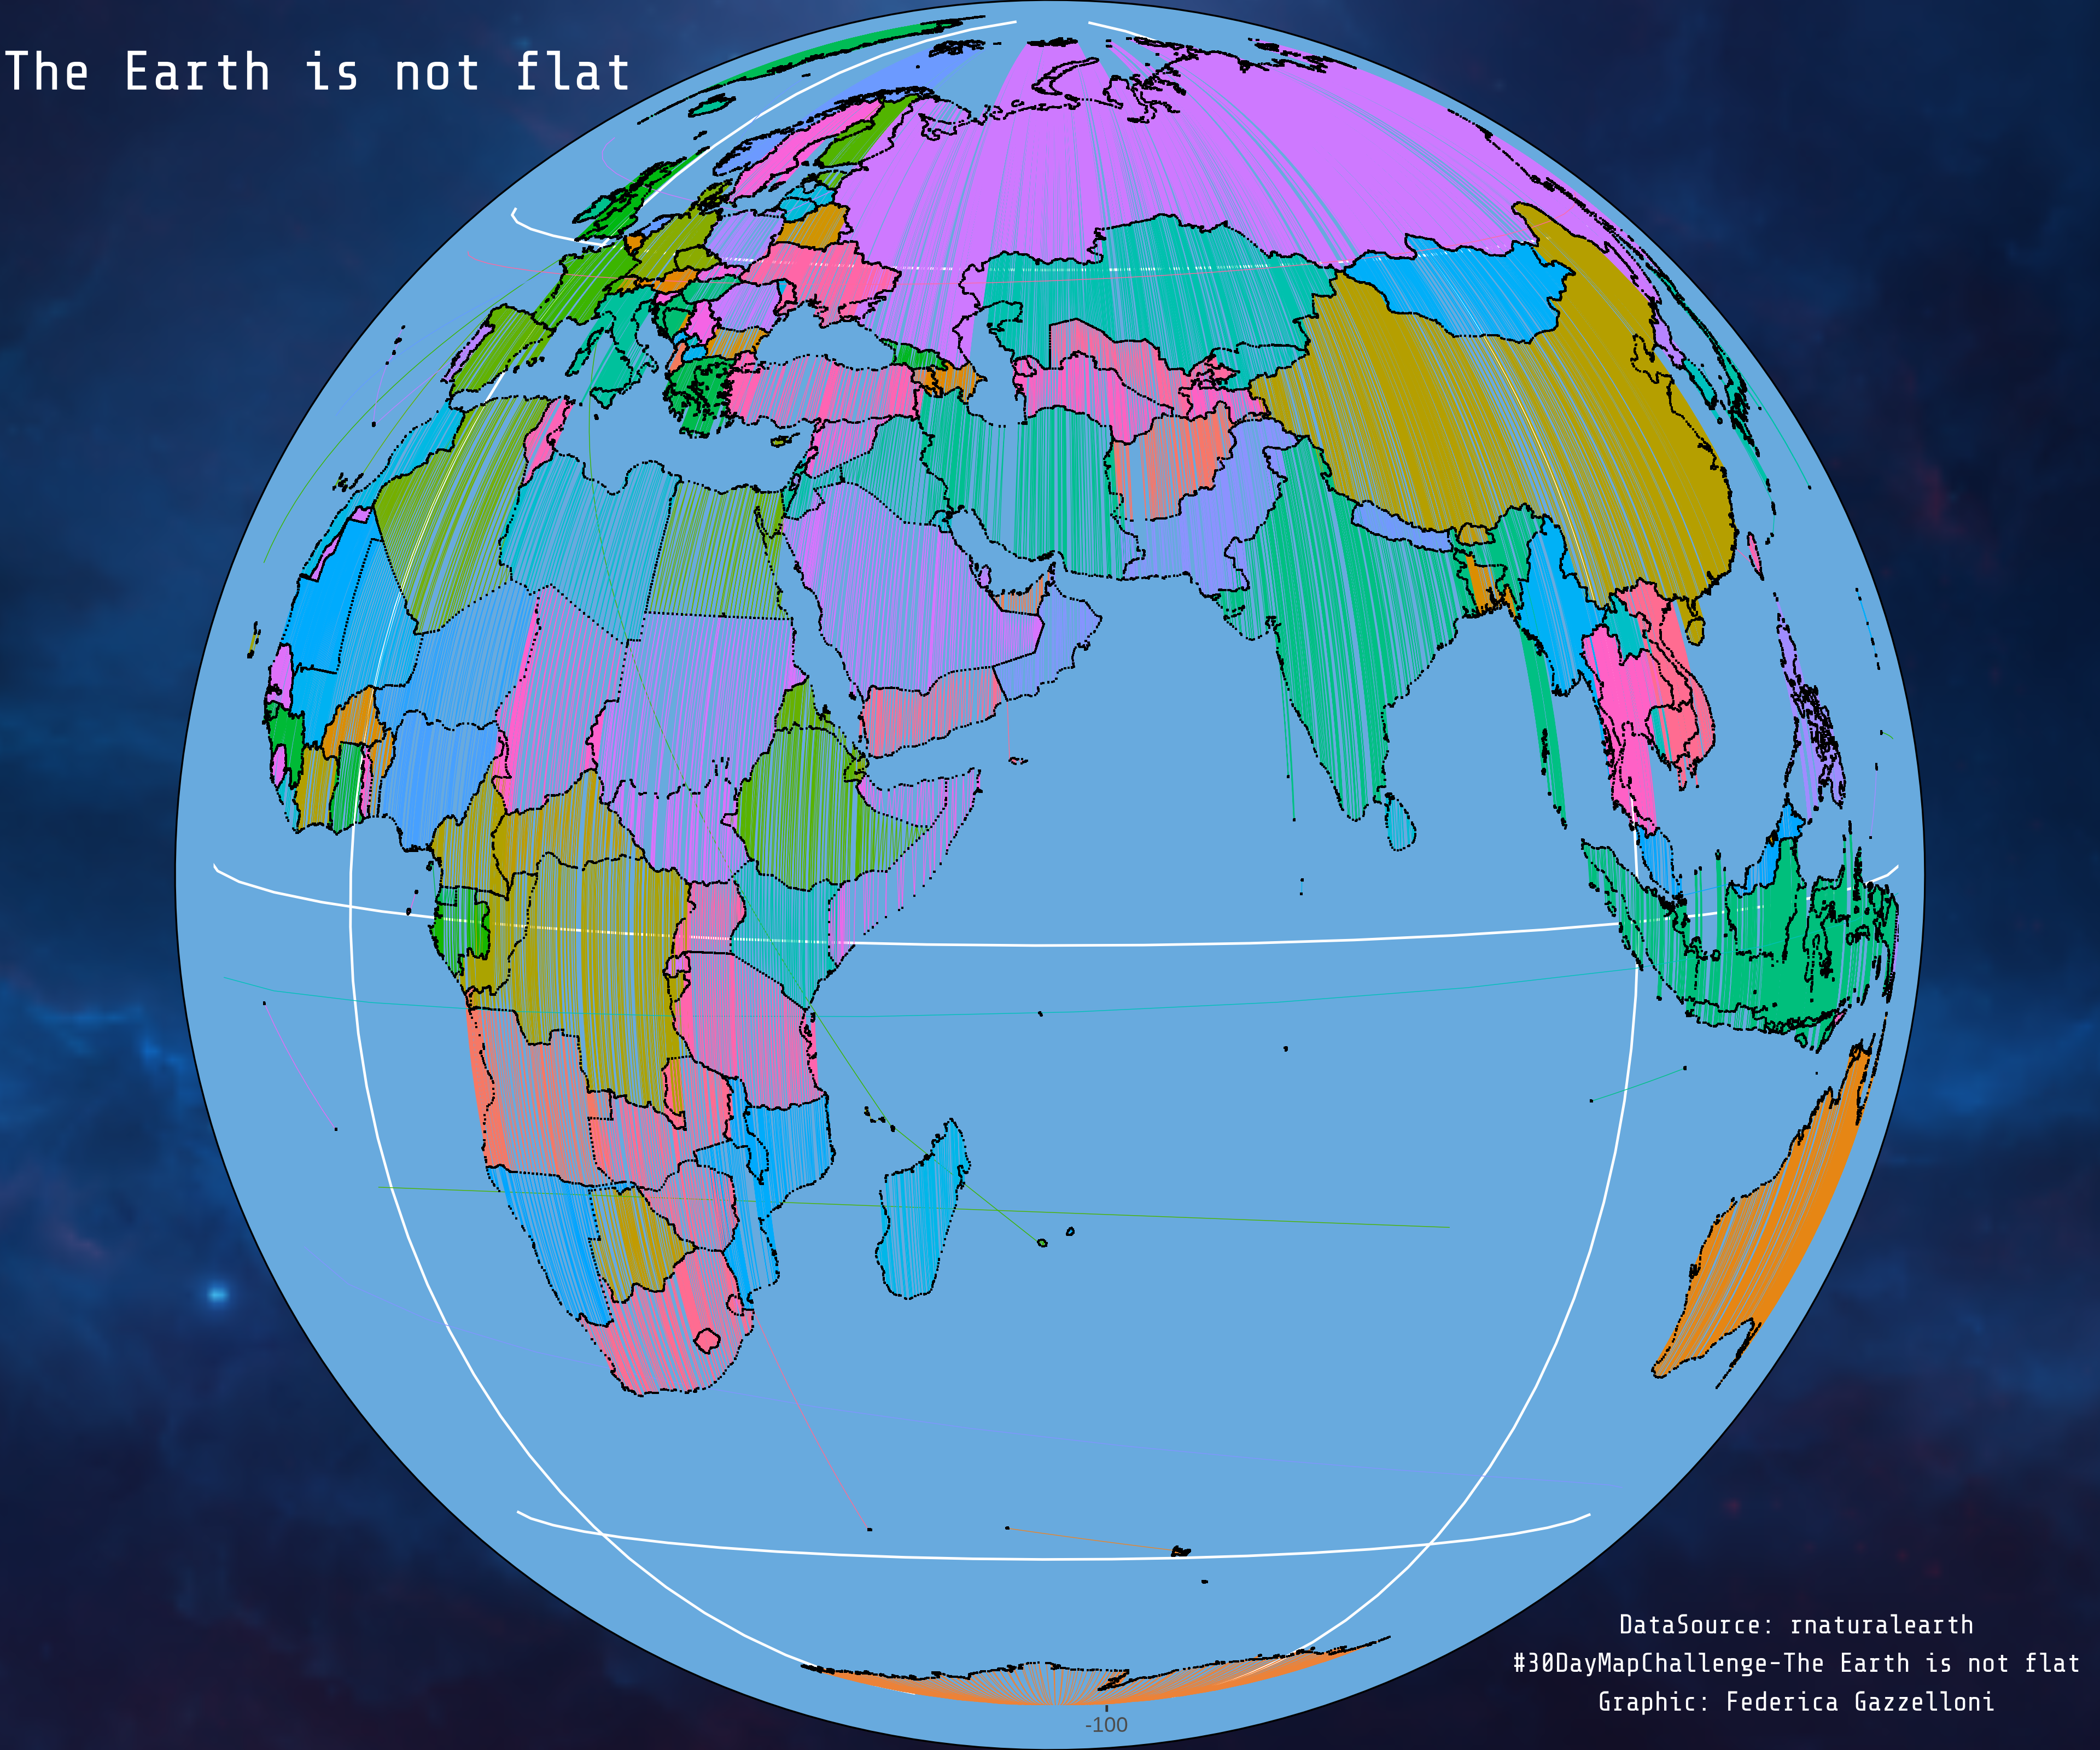
Globe map, data is from rnaturalearth.
Globe
rnaturalearth
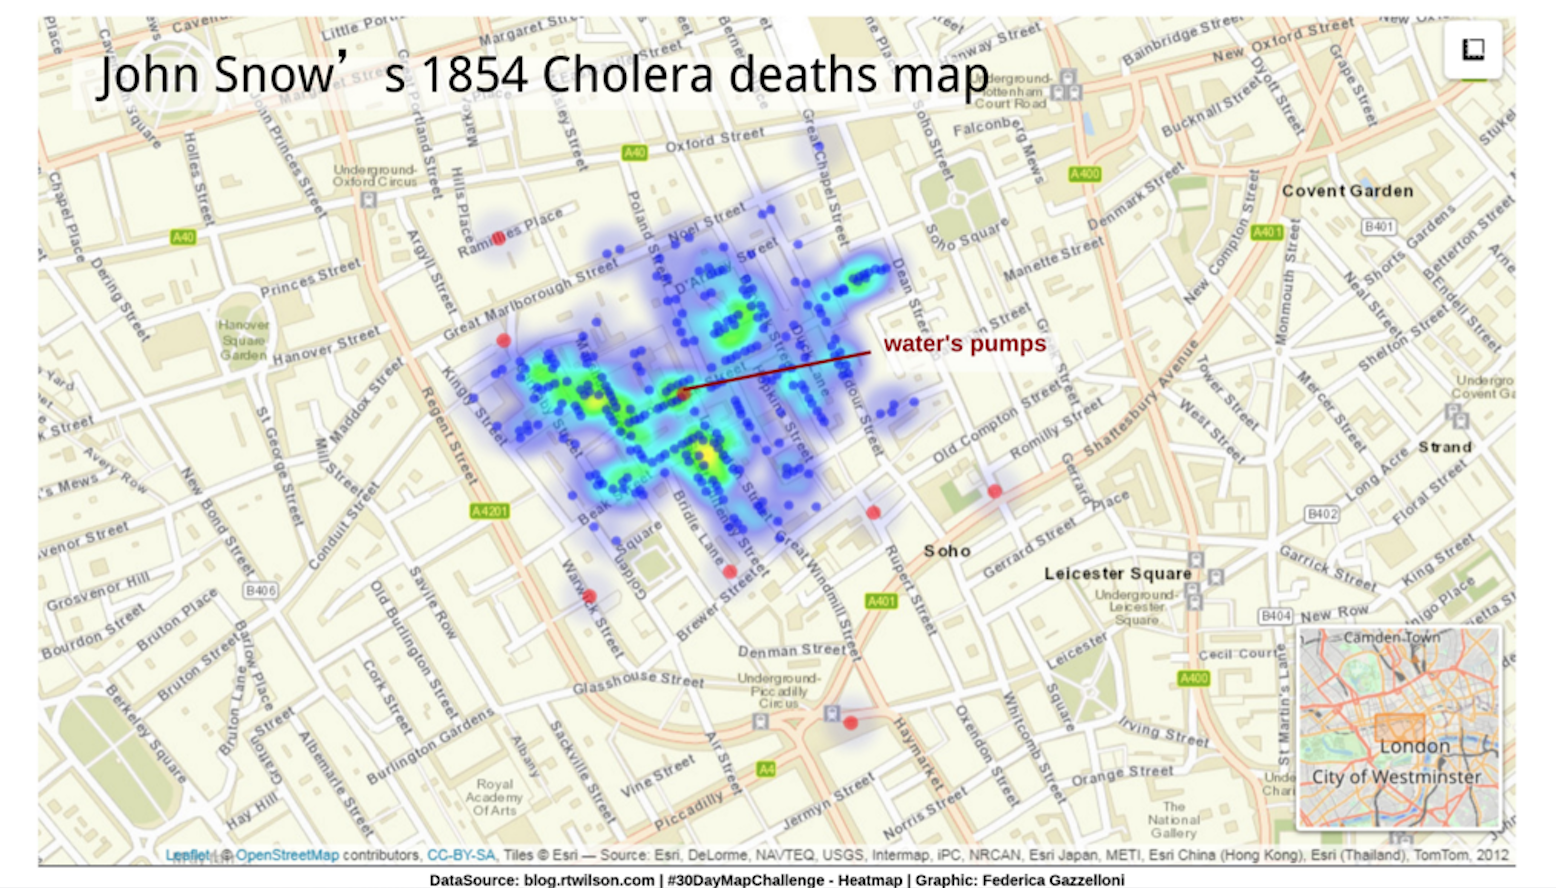
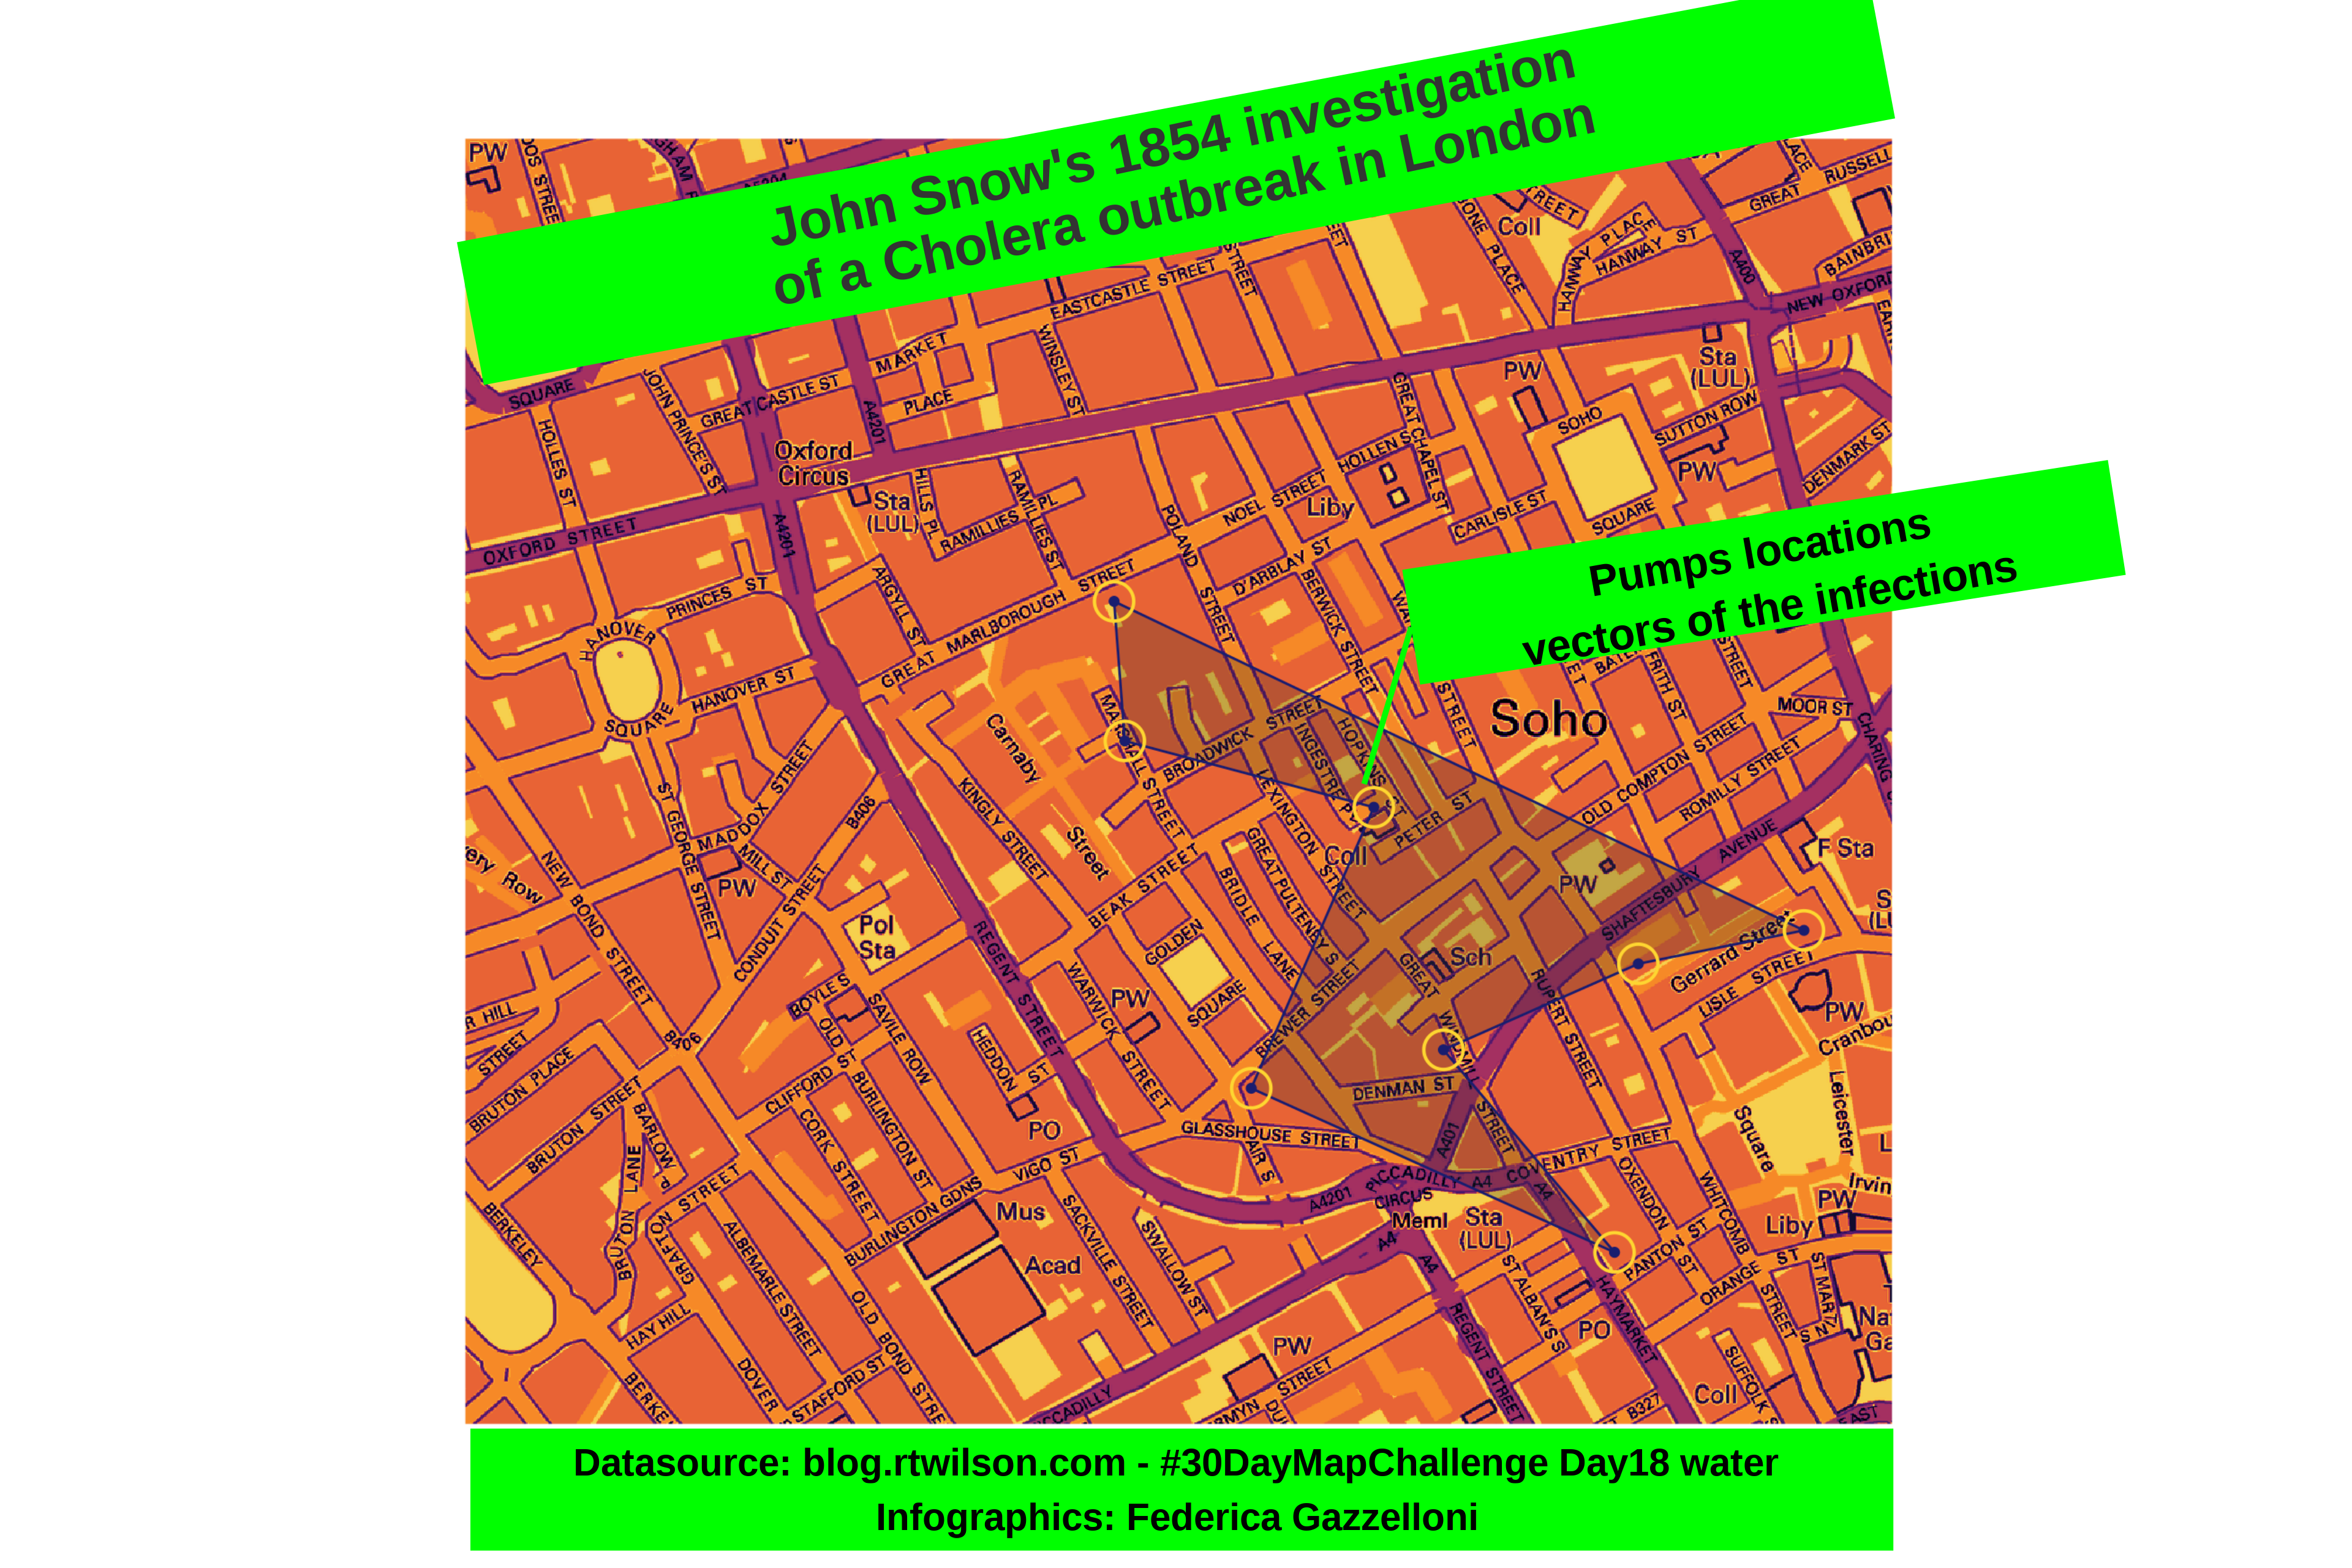
A map-based heatmap of London cholera deaths in 1854, based on John Snow’s historic dataset.
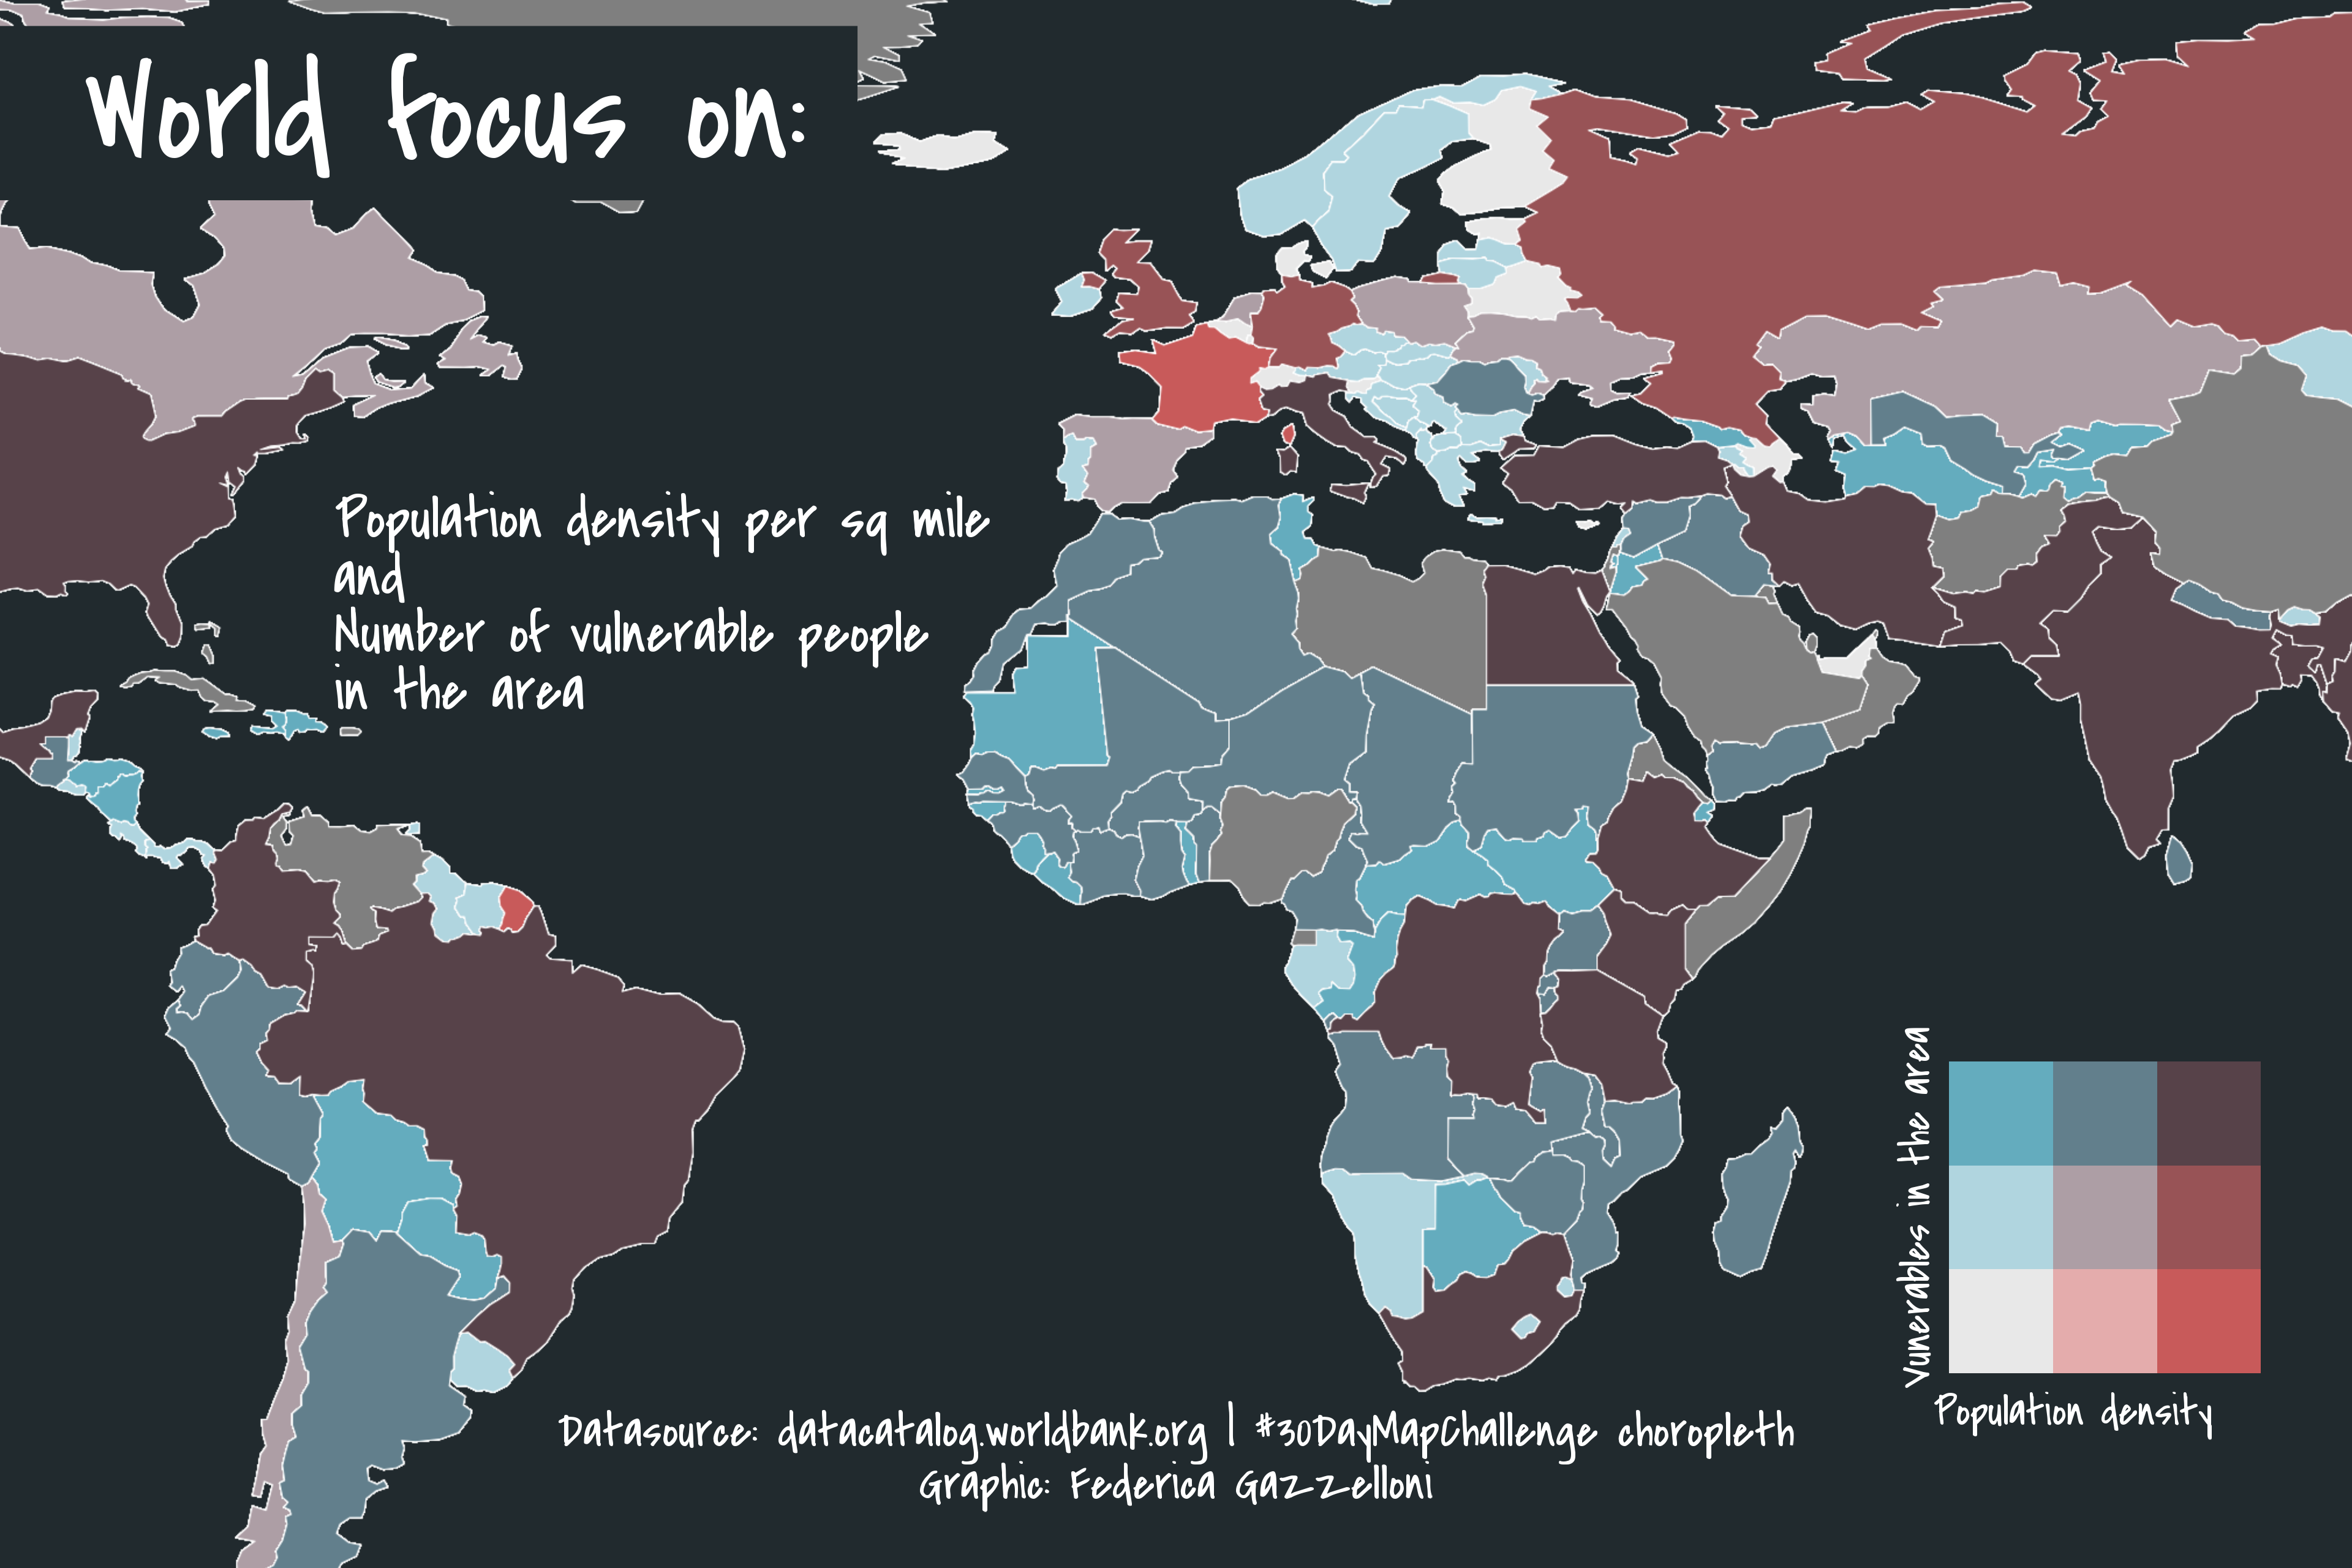
A world choropleth mapping population density per square mile alongside the number of people vulnerable in each area.
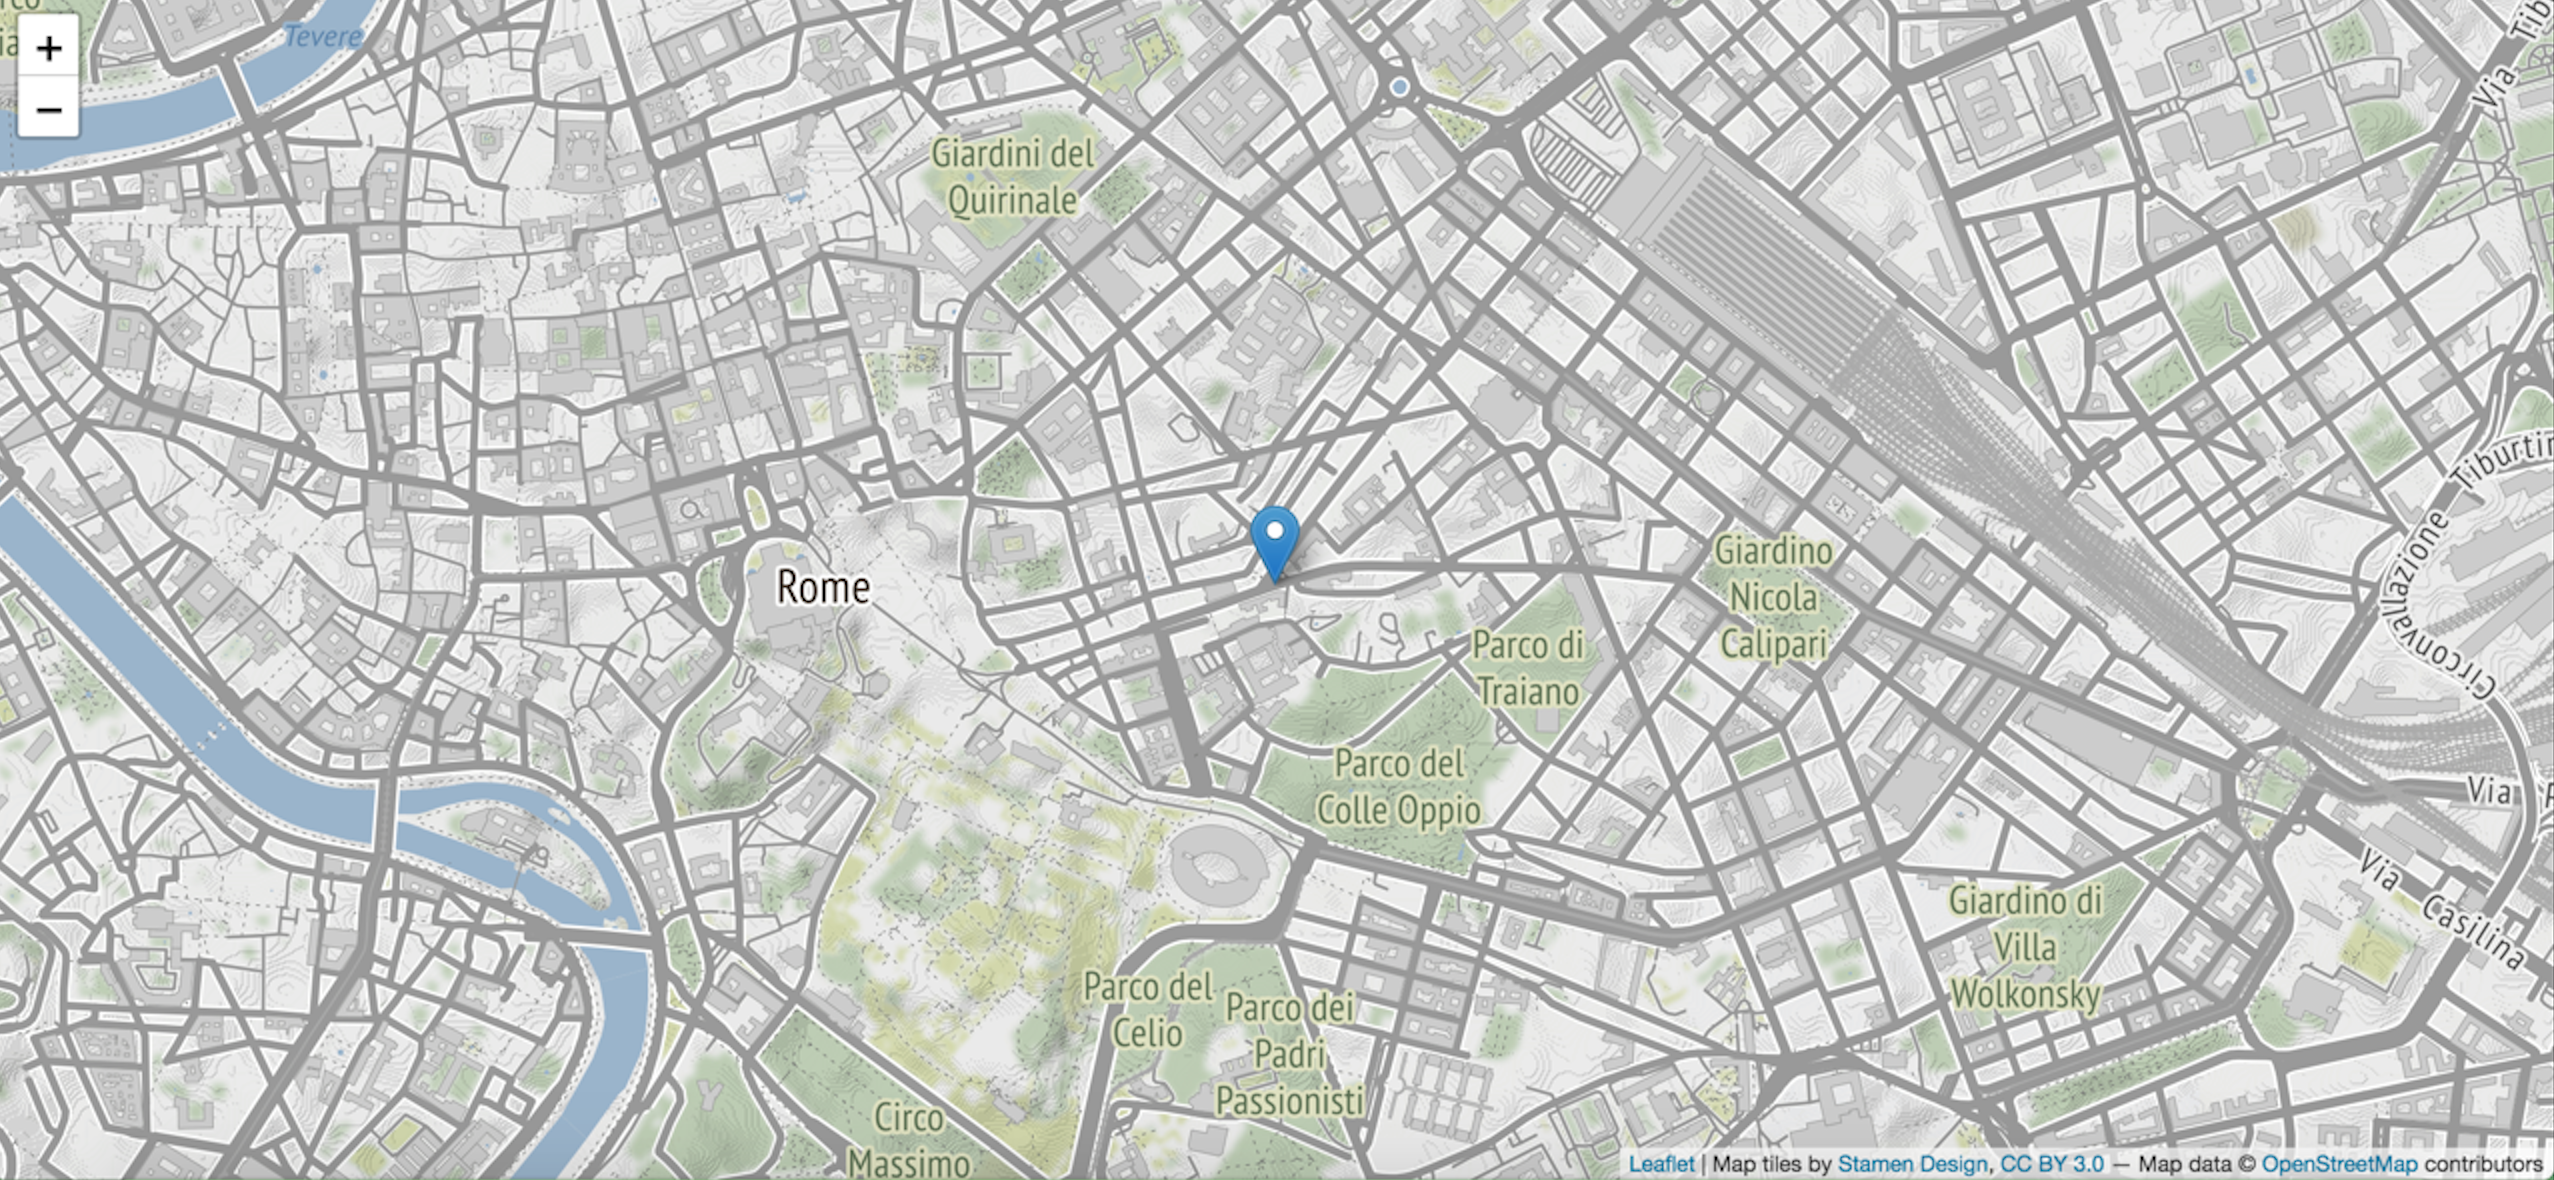
An interactive Leaflet map marking the author’s birthplace in Rome.
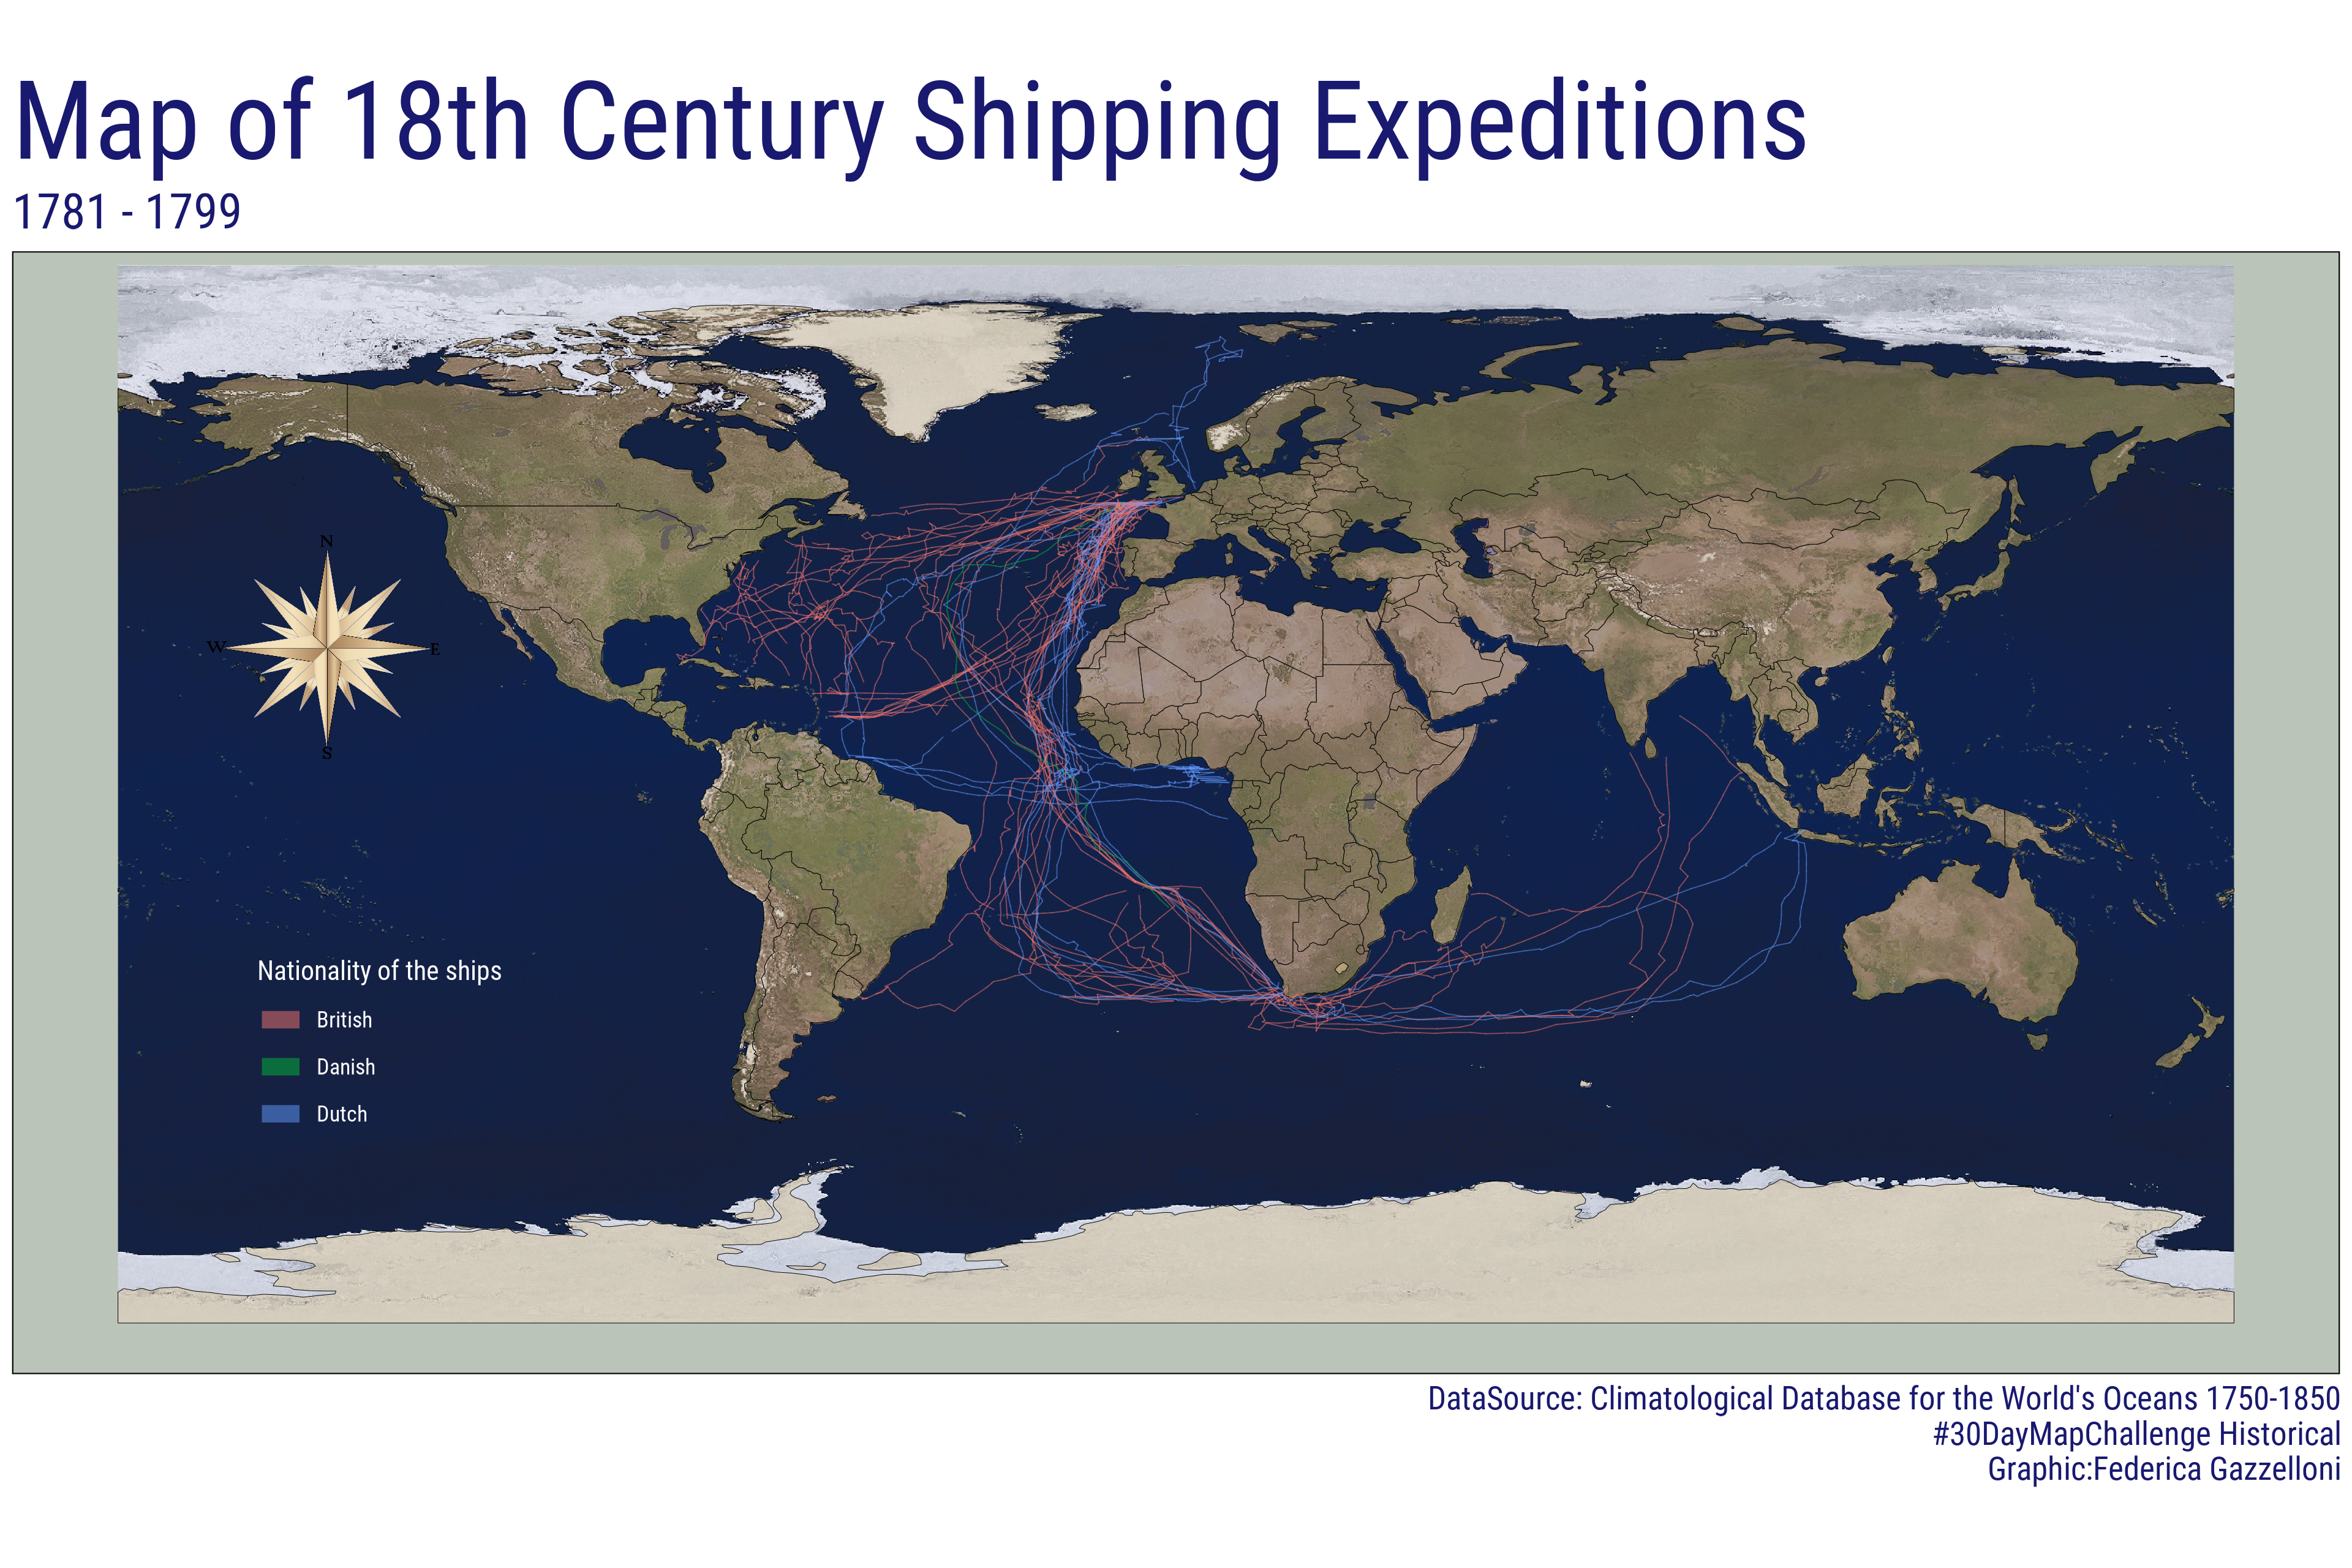
A historical map of ocean shipping expeditions from 1781 to 1799 using the Climatological Database for the World’s Oceans.
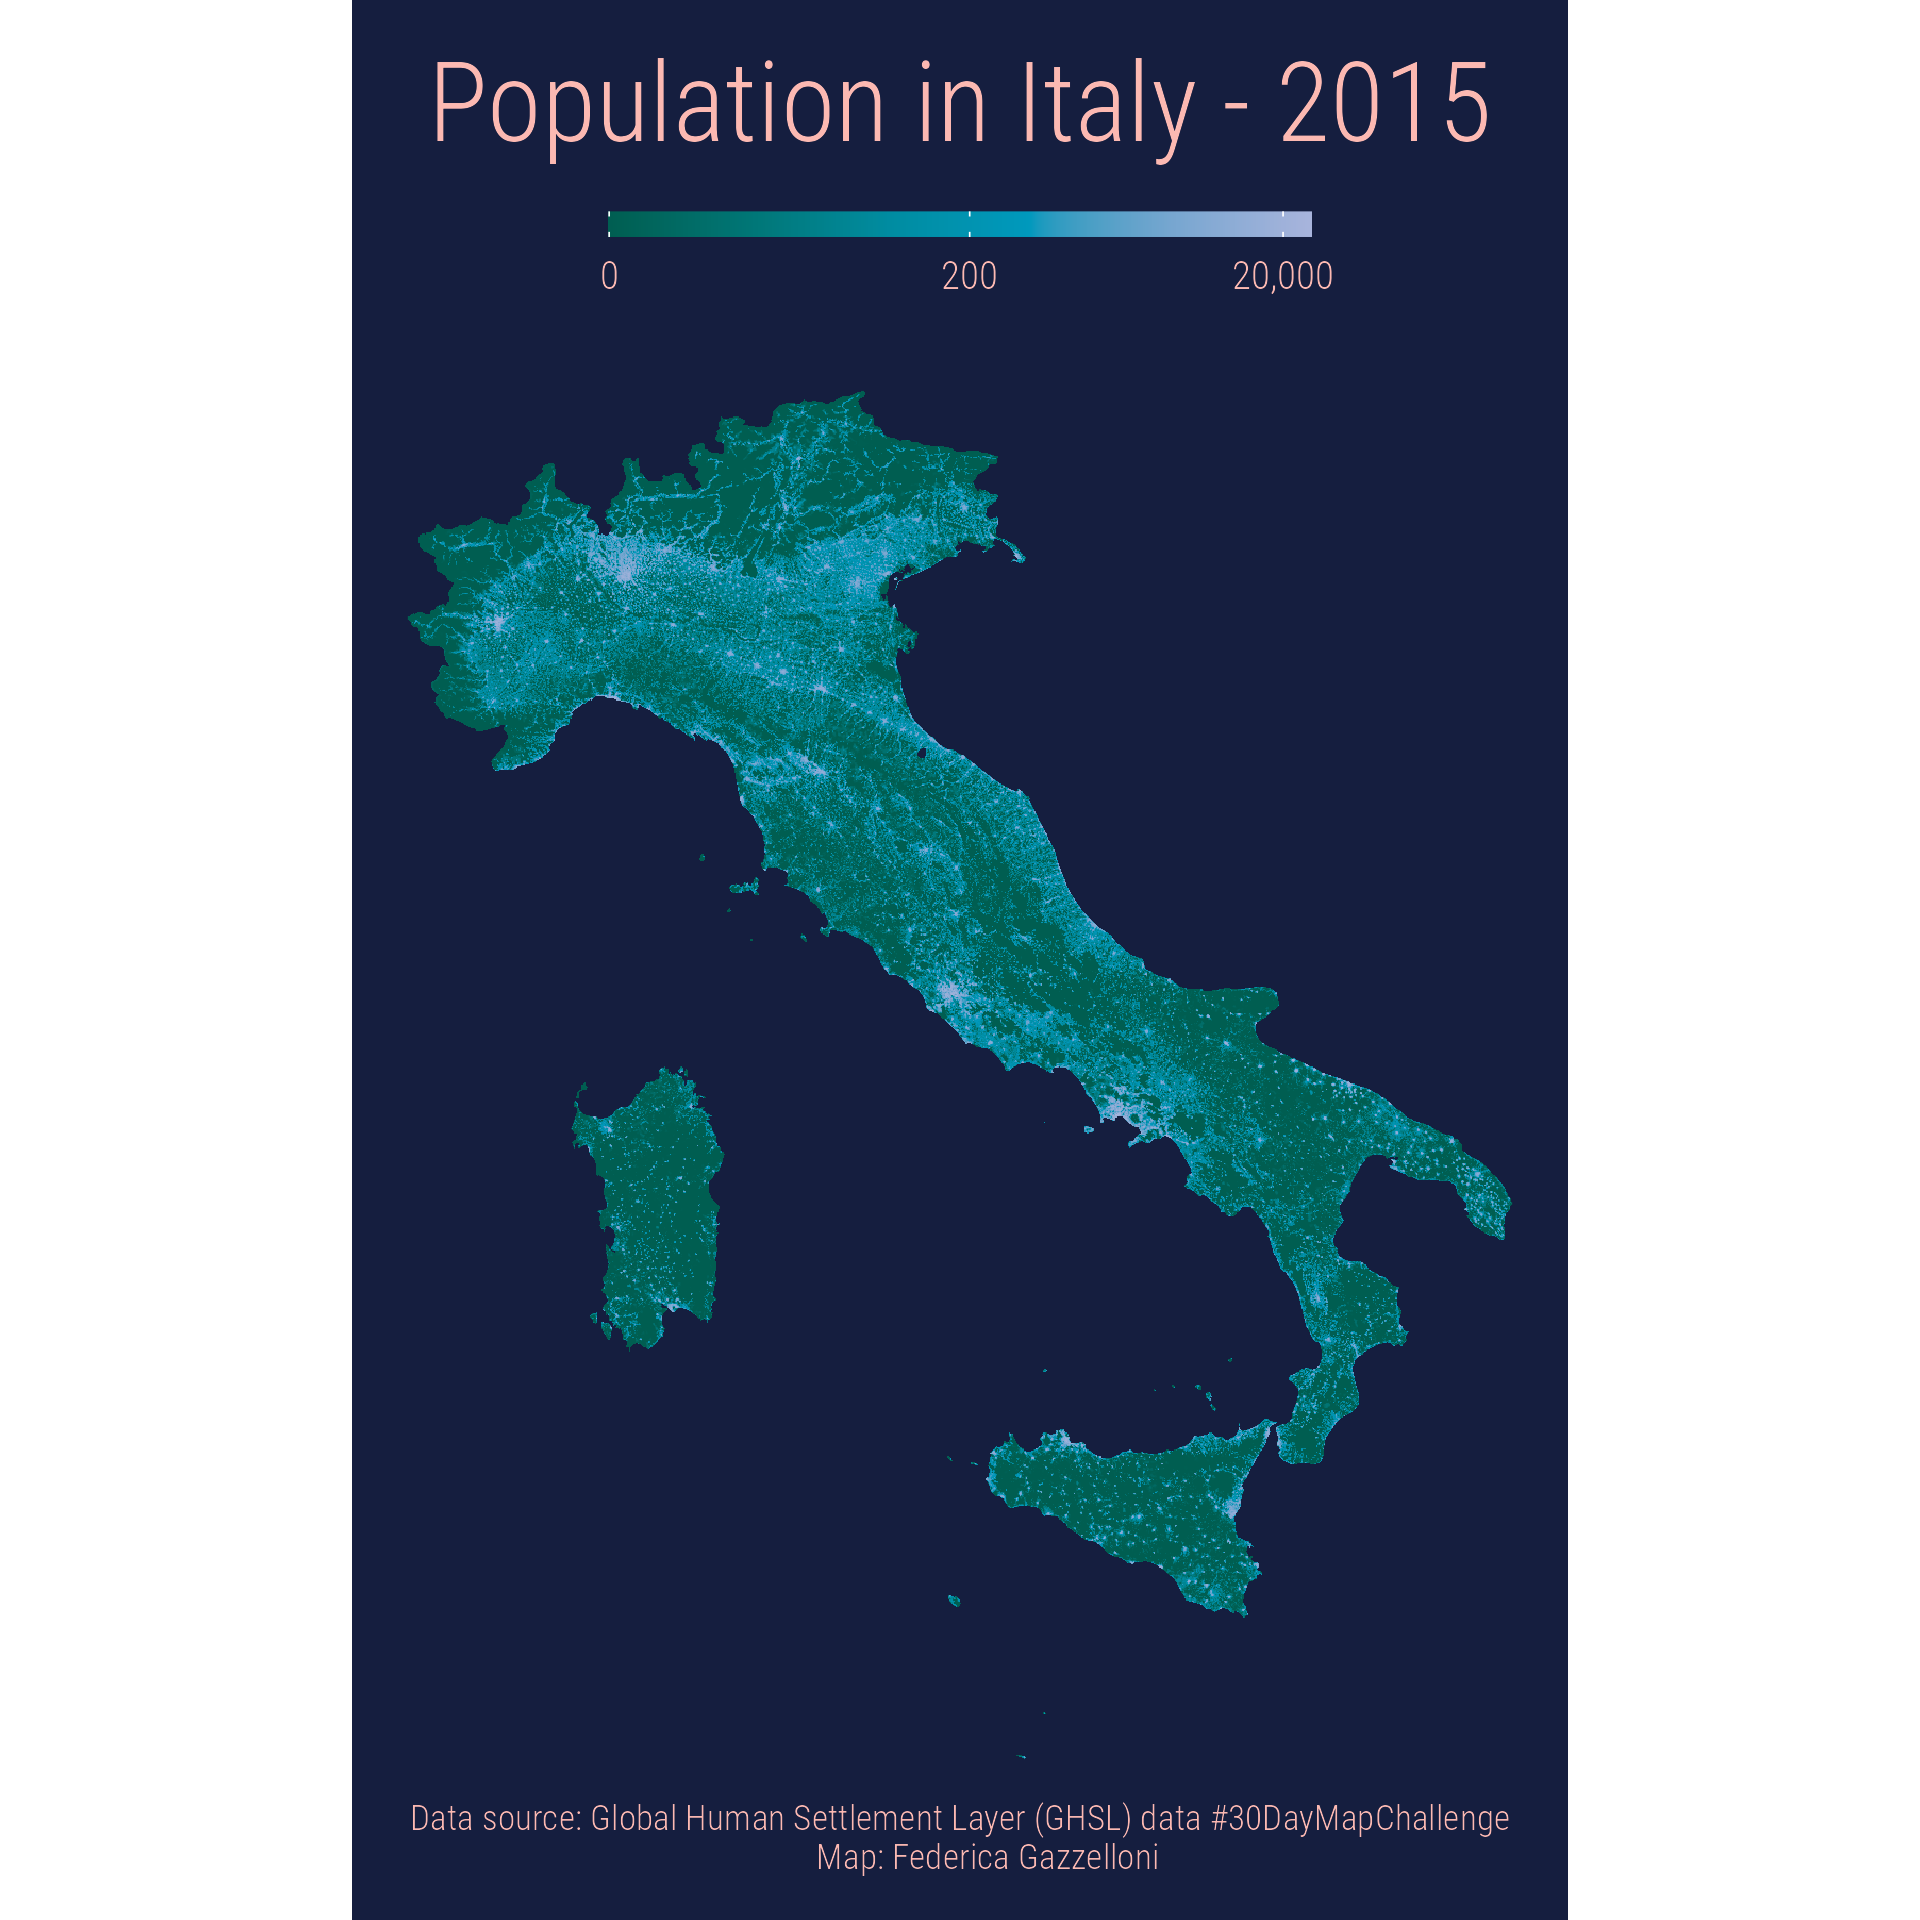
A 1-kilometer-resolution map of Italy showing 2015 population from the Global Human Settlement Layer.
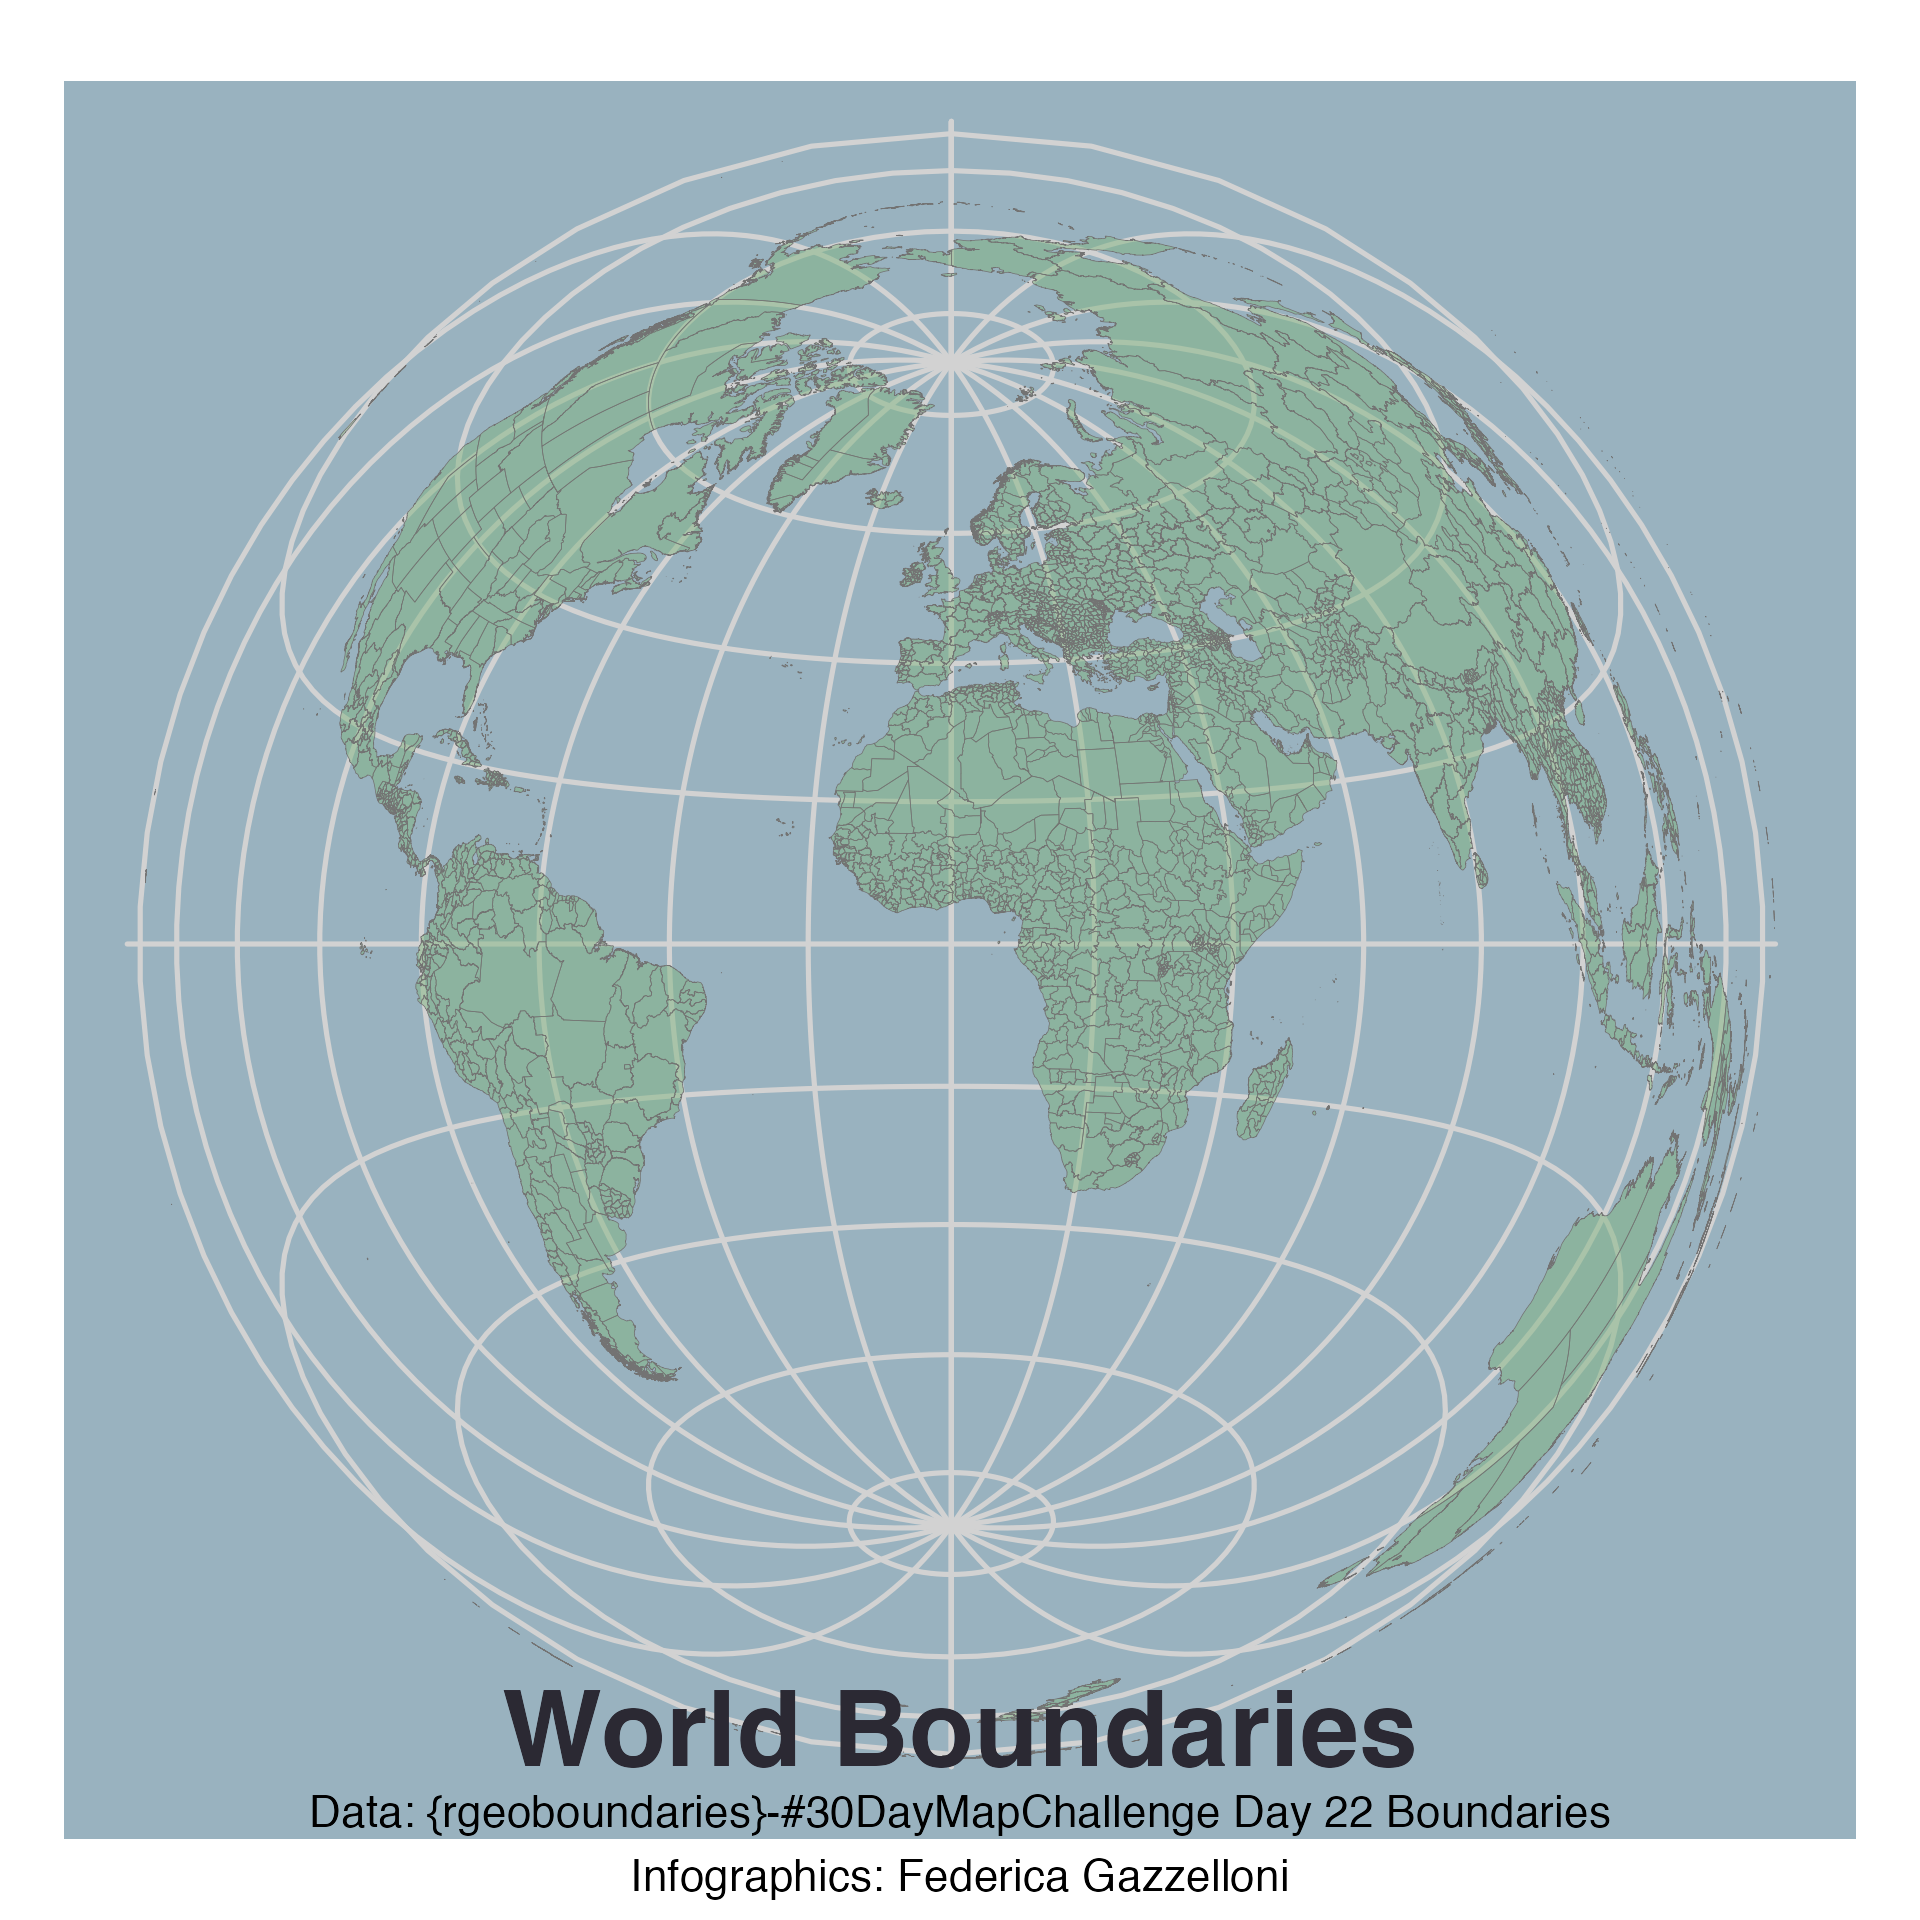
A world map outlining international boundaries with data from the rgeoboundaries package.
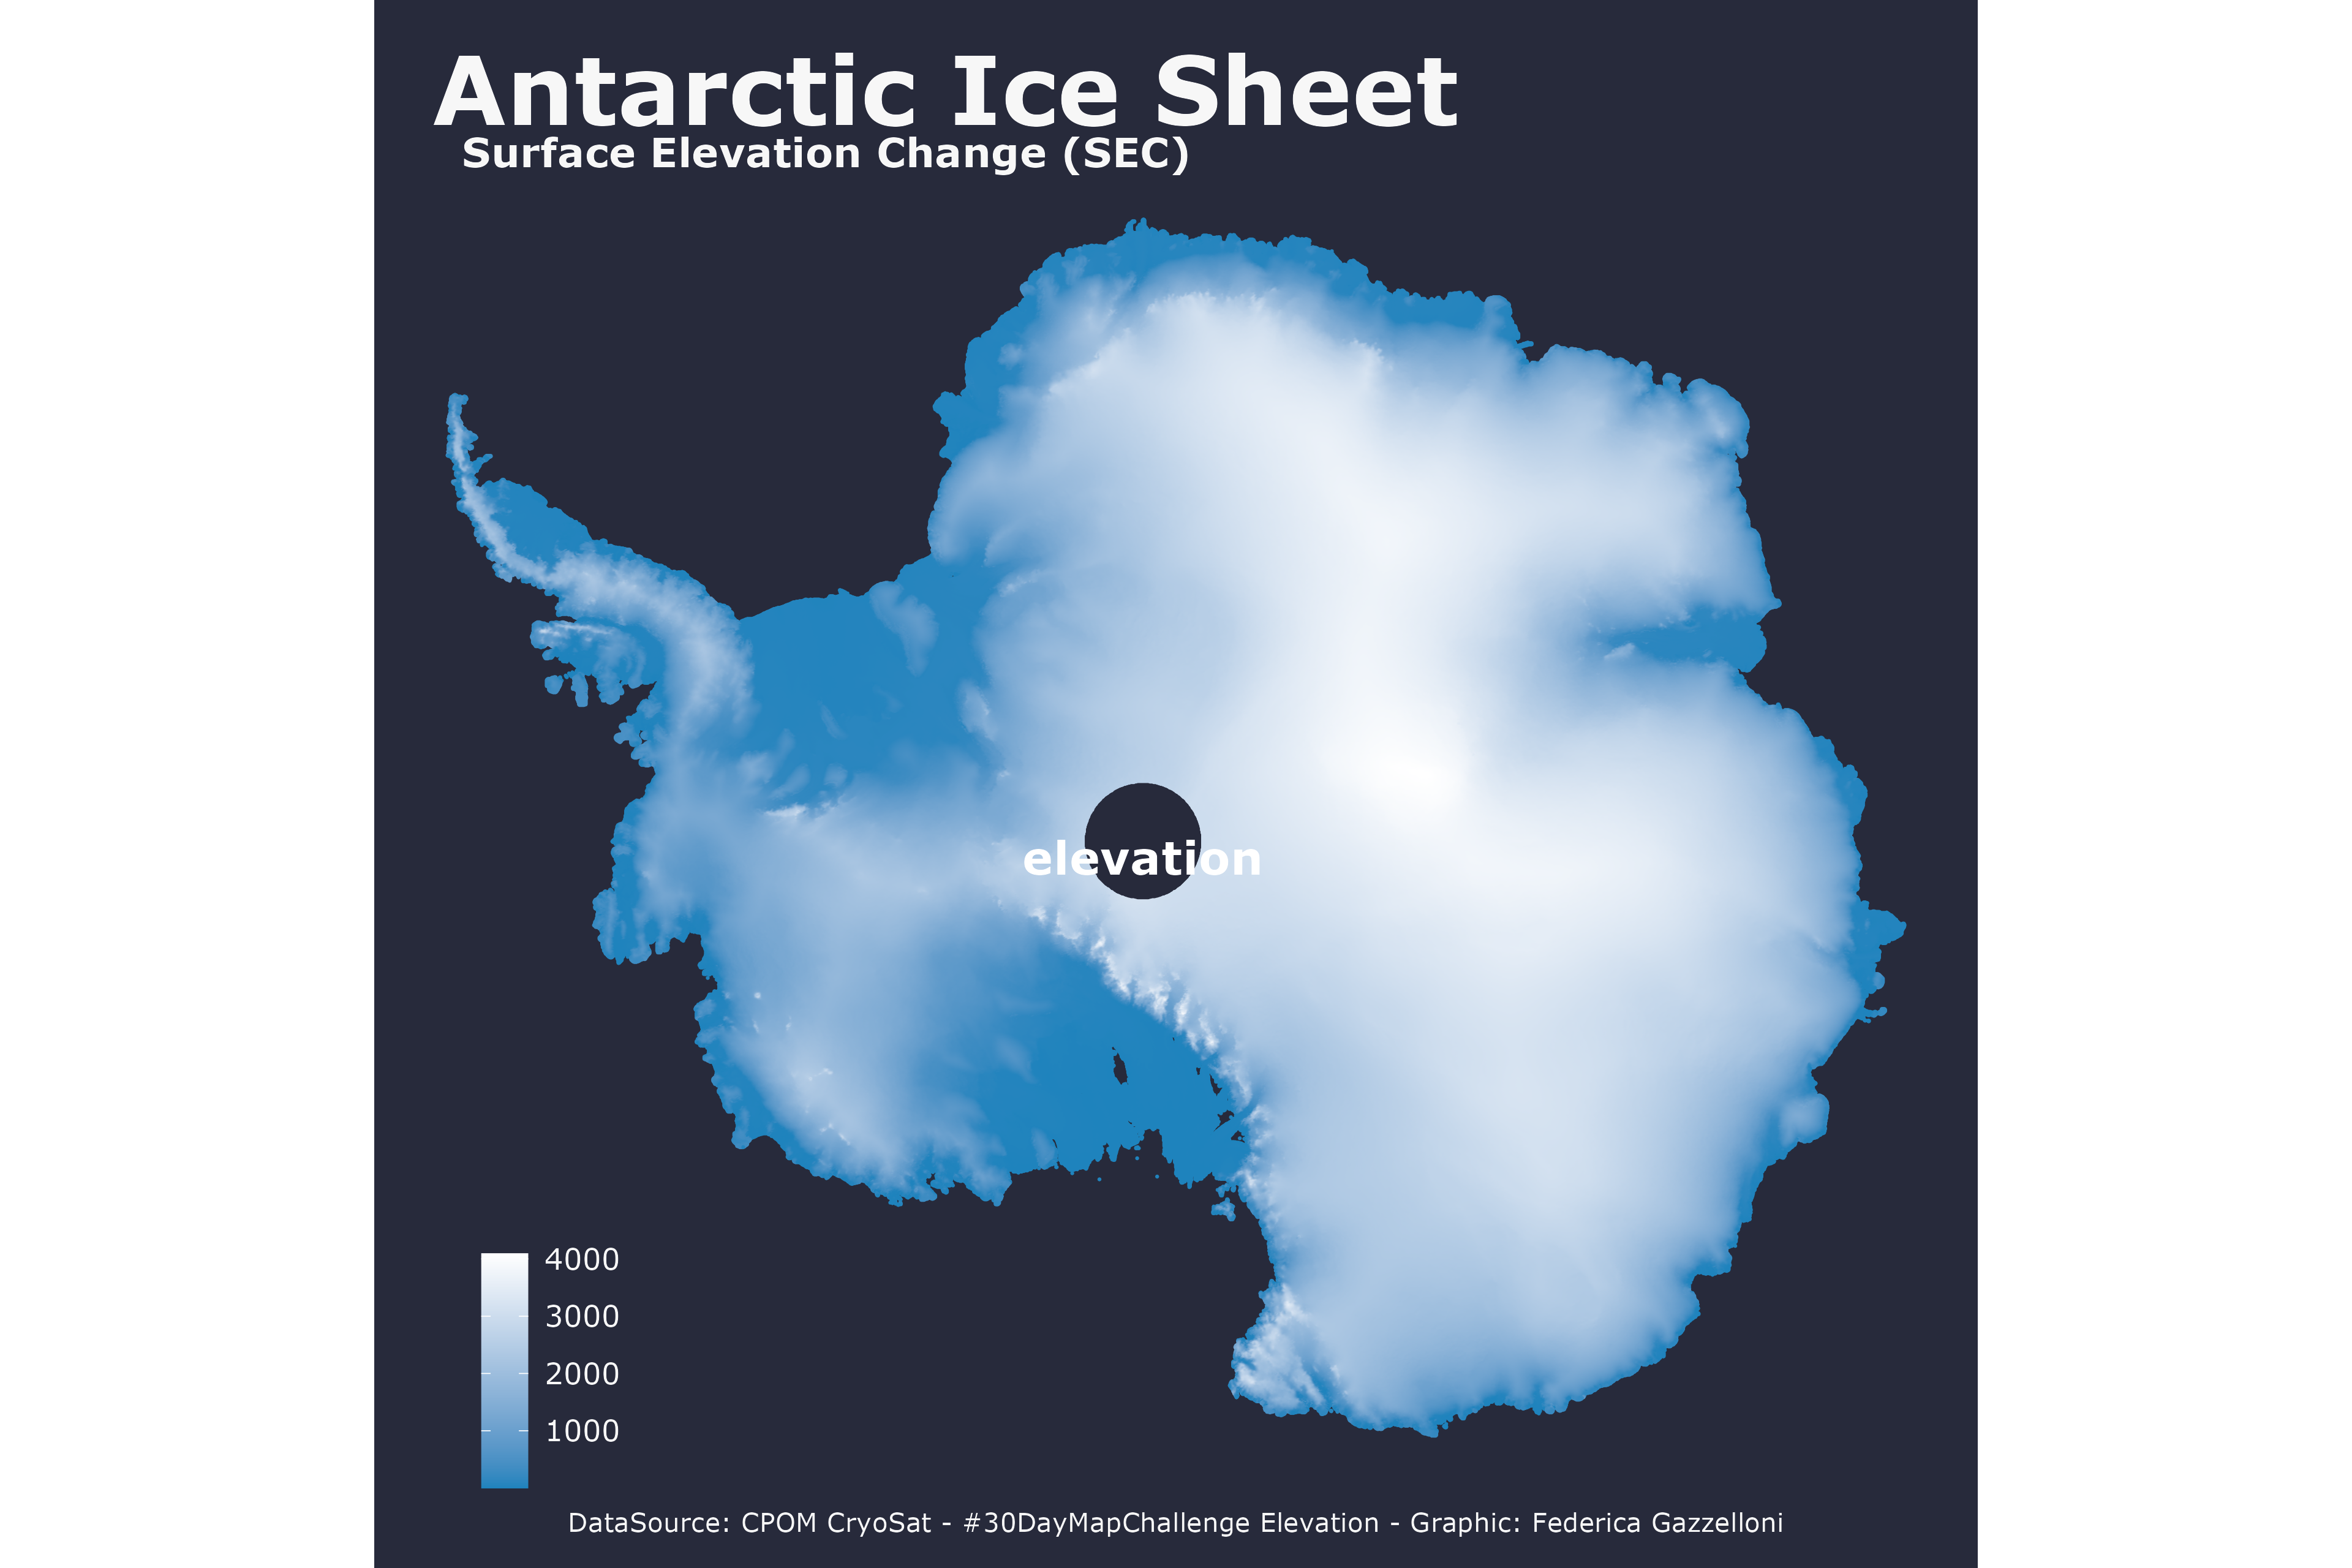
A map of surface elevation change in Alaska using measurements from the CPOM CryoSat project.
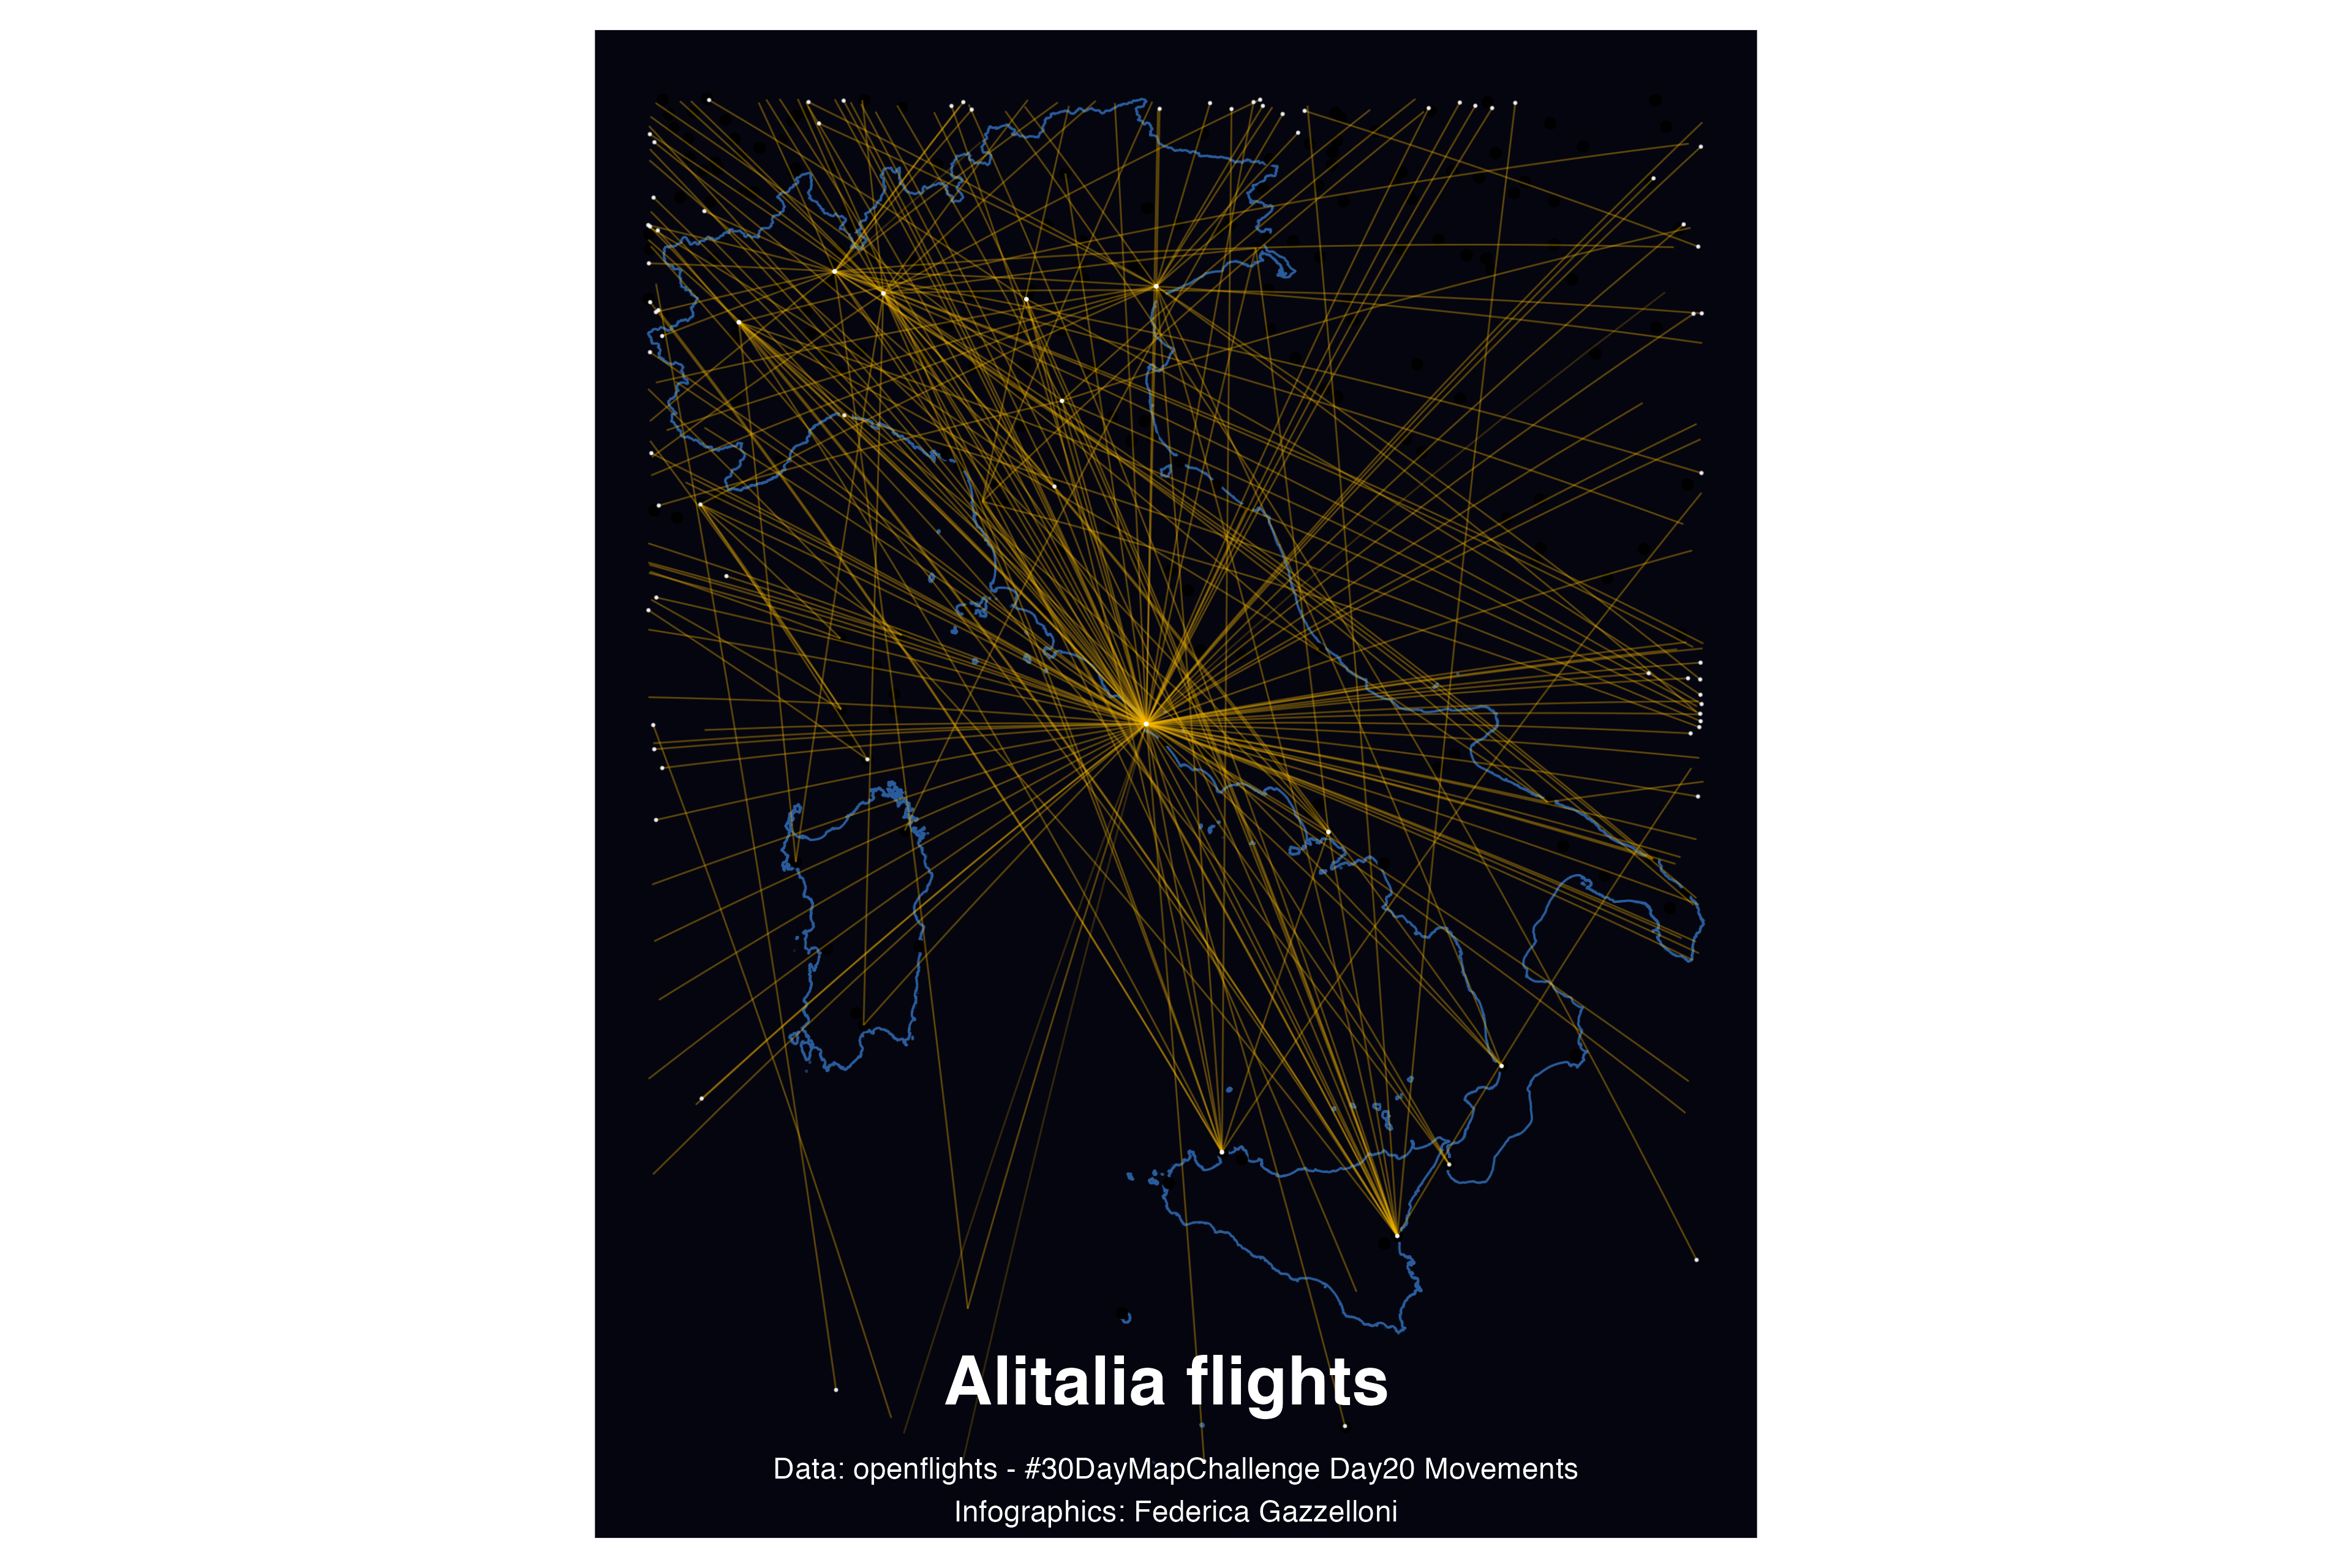
A map of Alitalia flight routes across Italy using route data from OpenFlights.
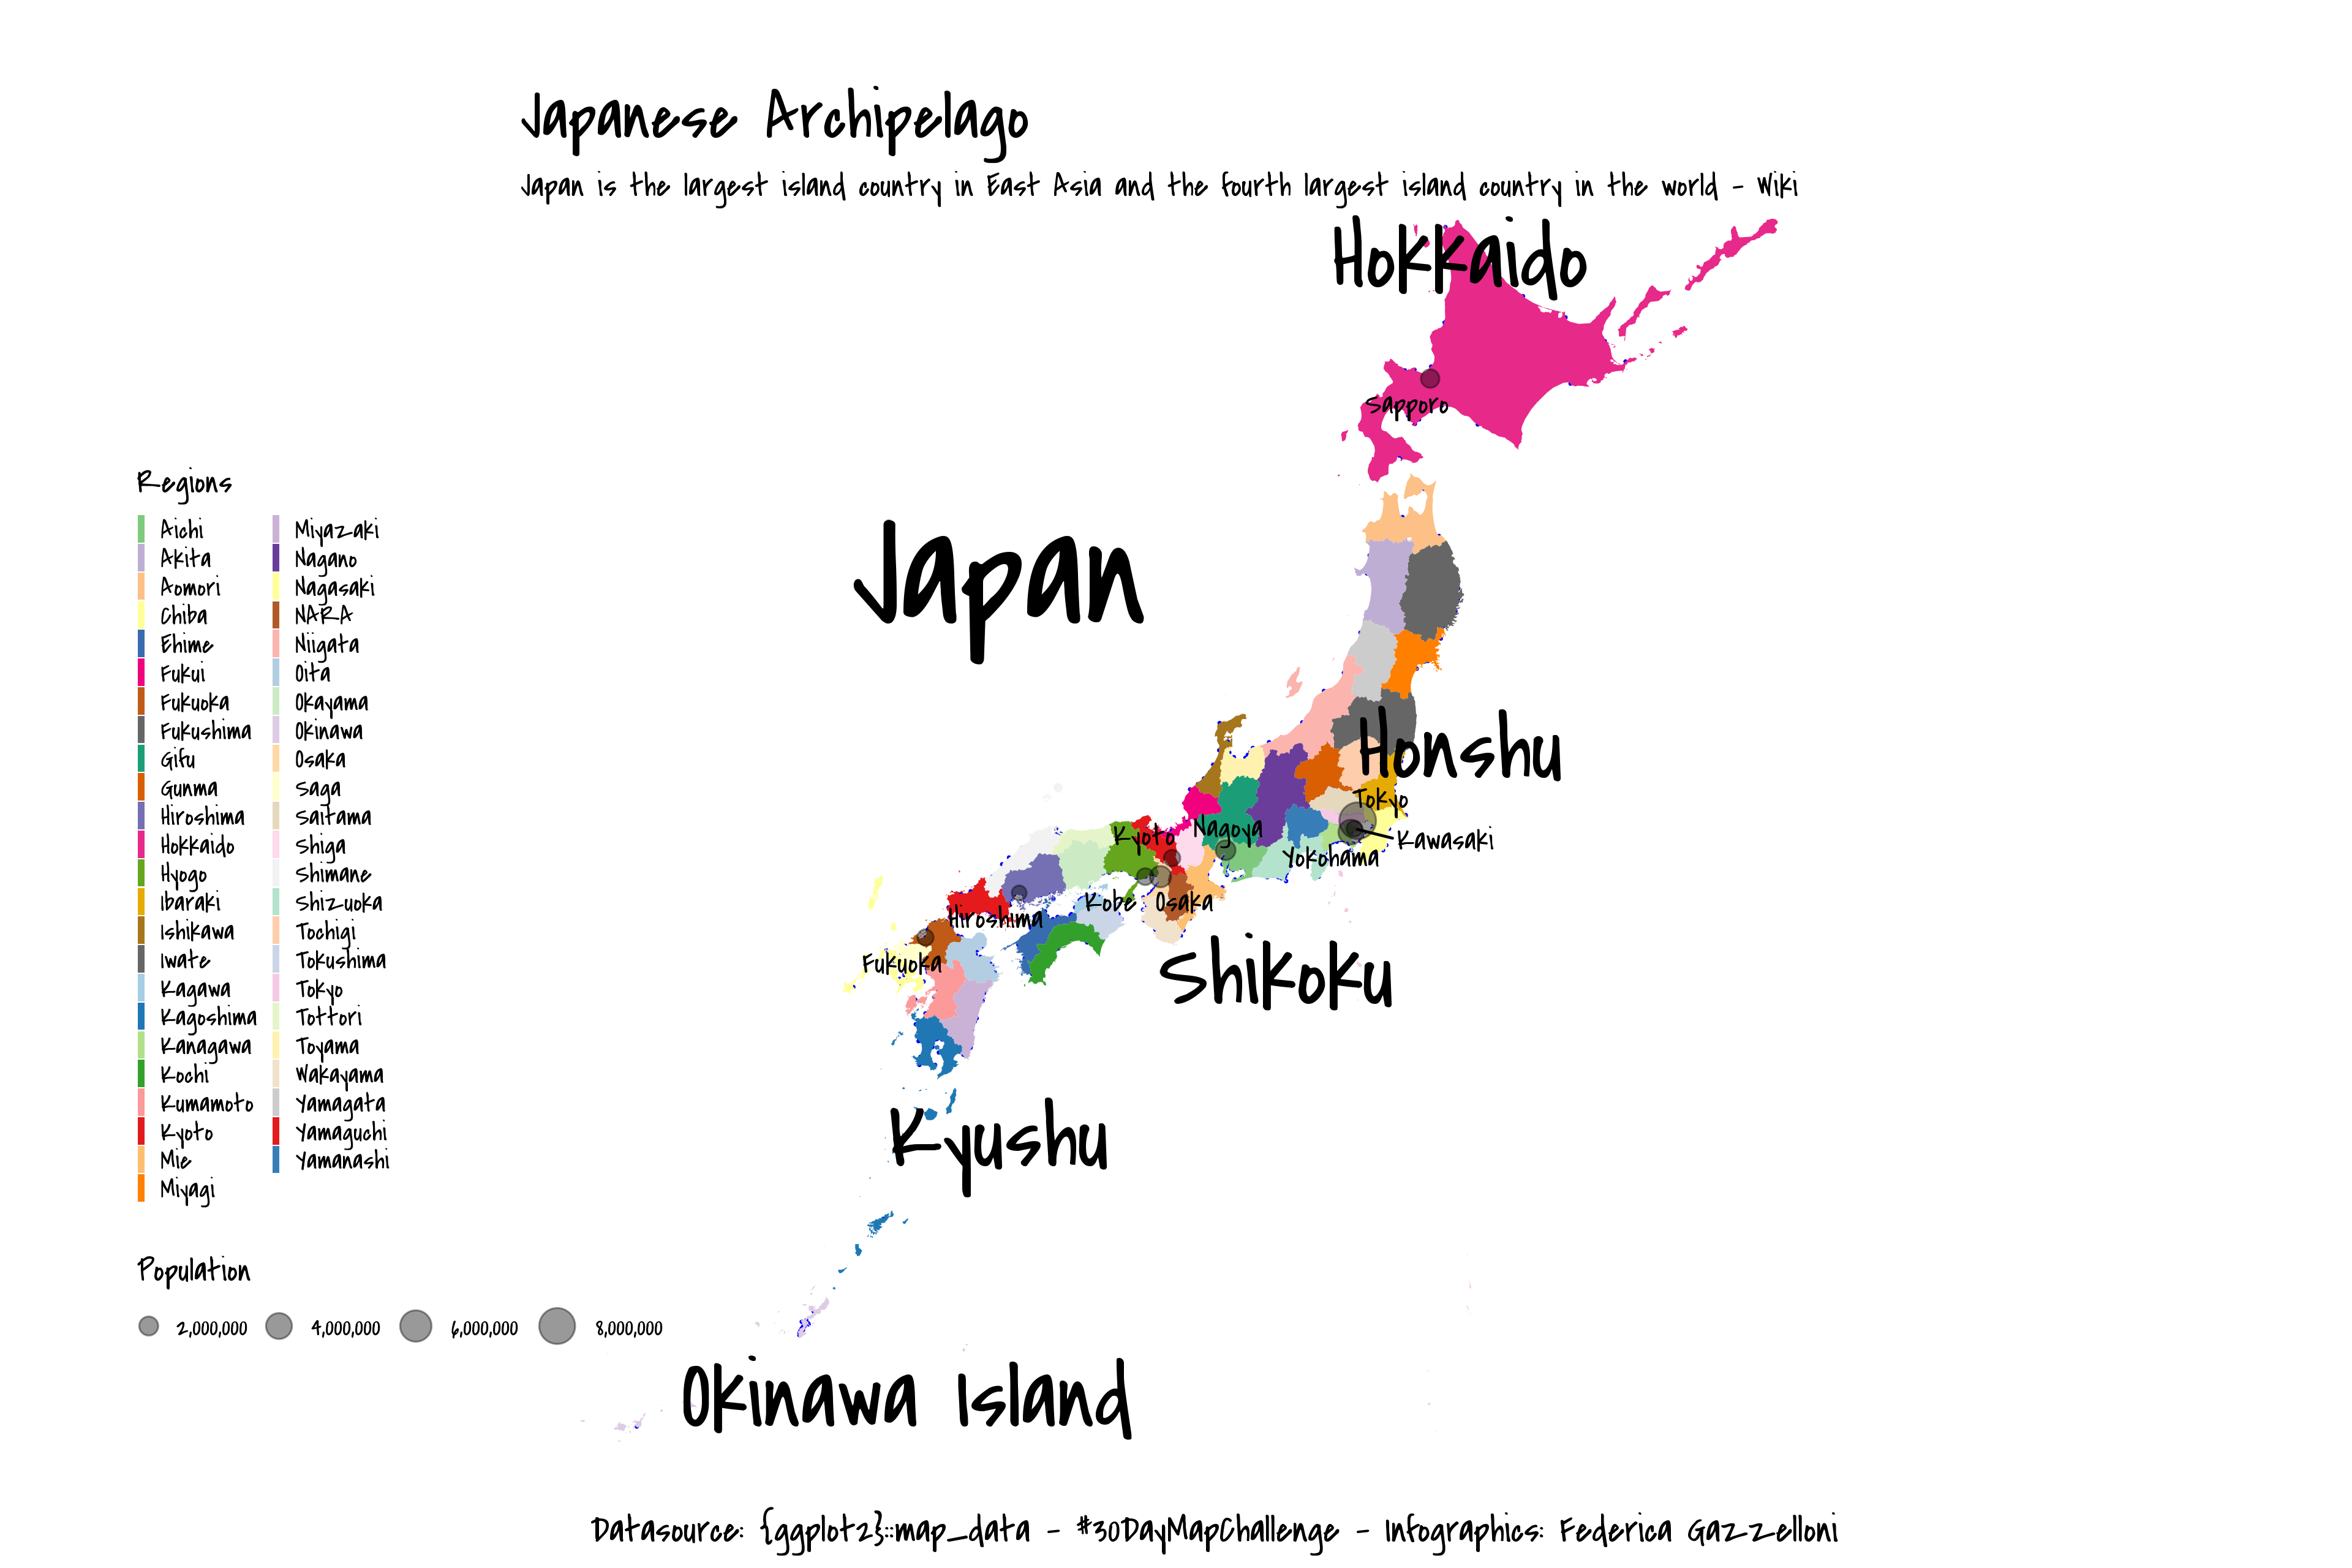
A map of Japanese islands and cities using city locations from the mapdata R package.
A map of John Snow data, recreating the historic cholera investigation with ocean-climate data from rtwilson.com.
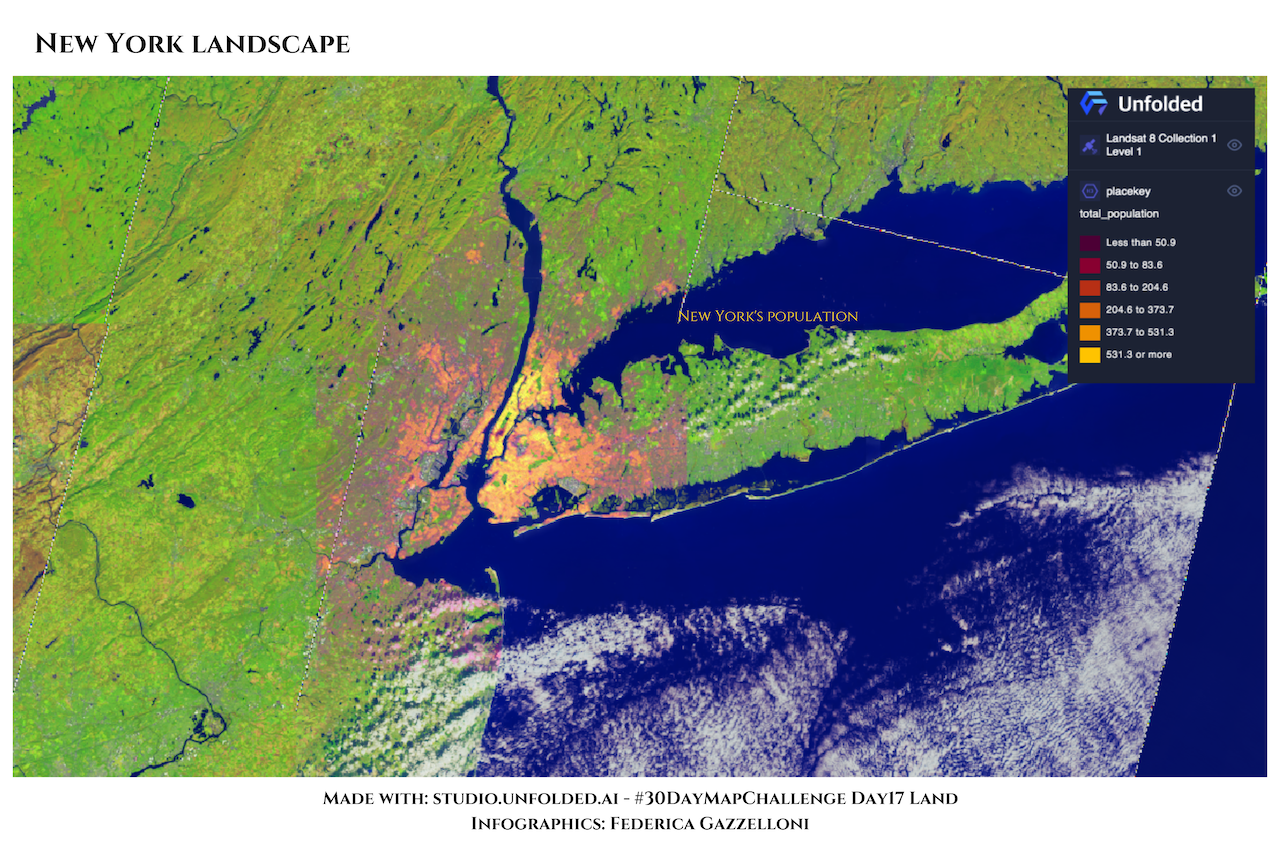
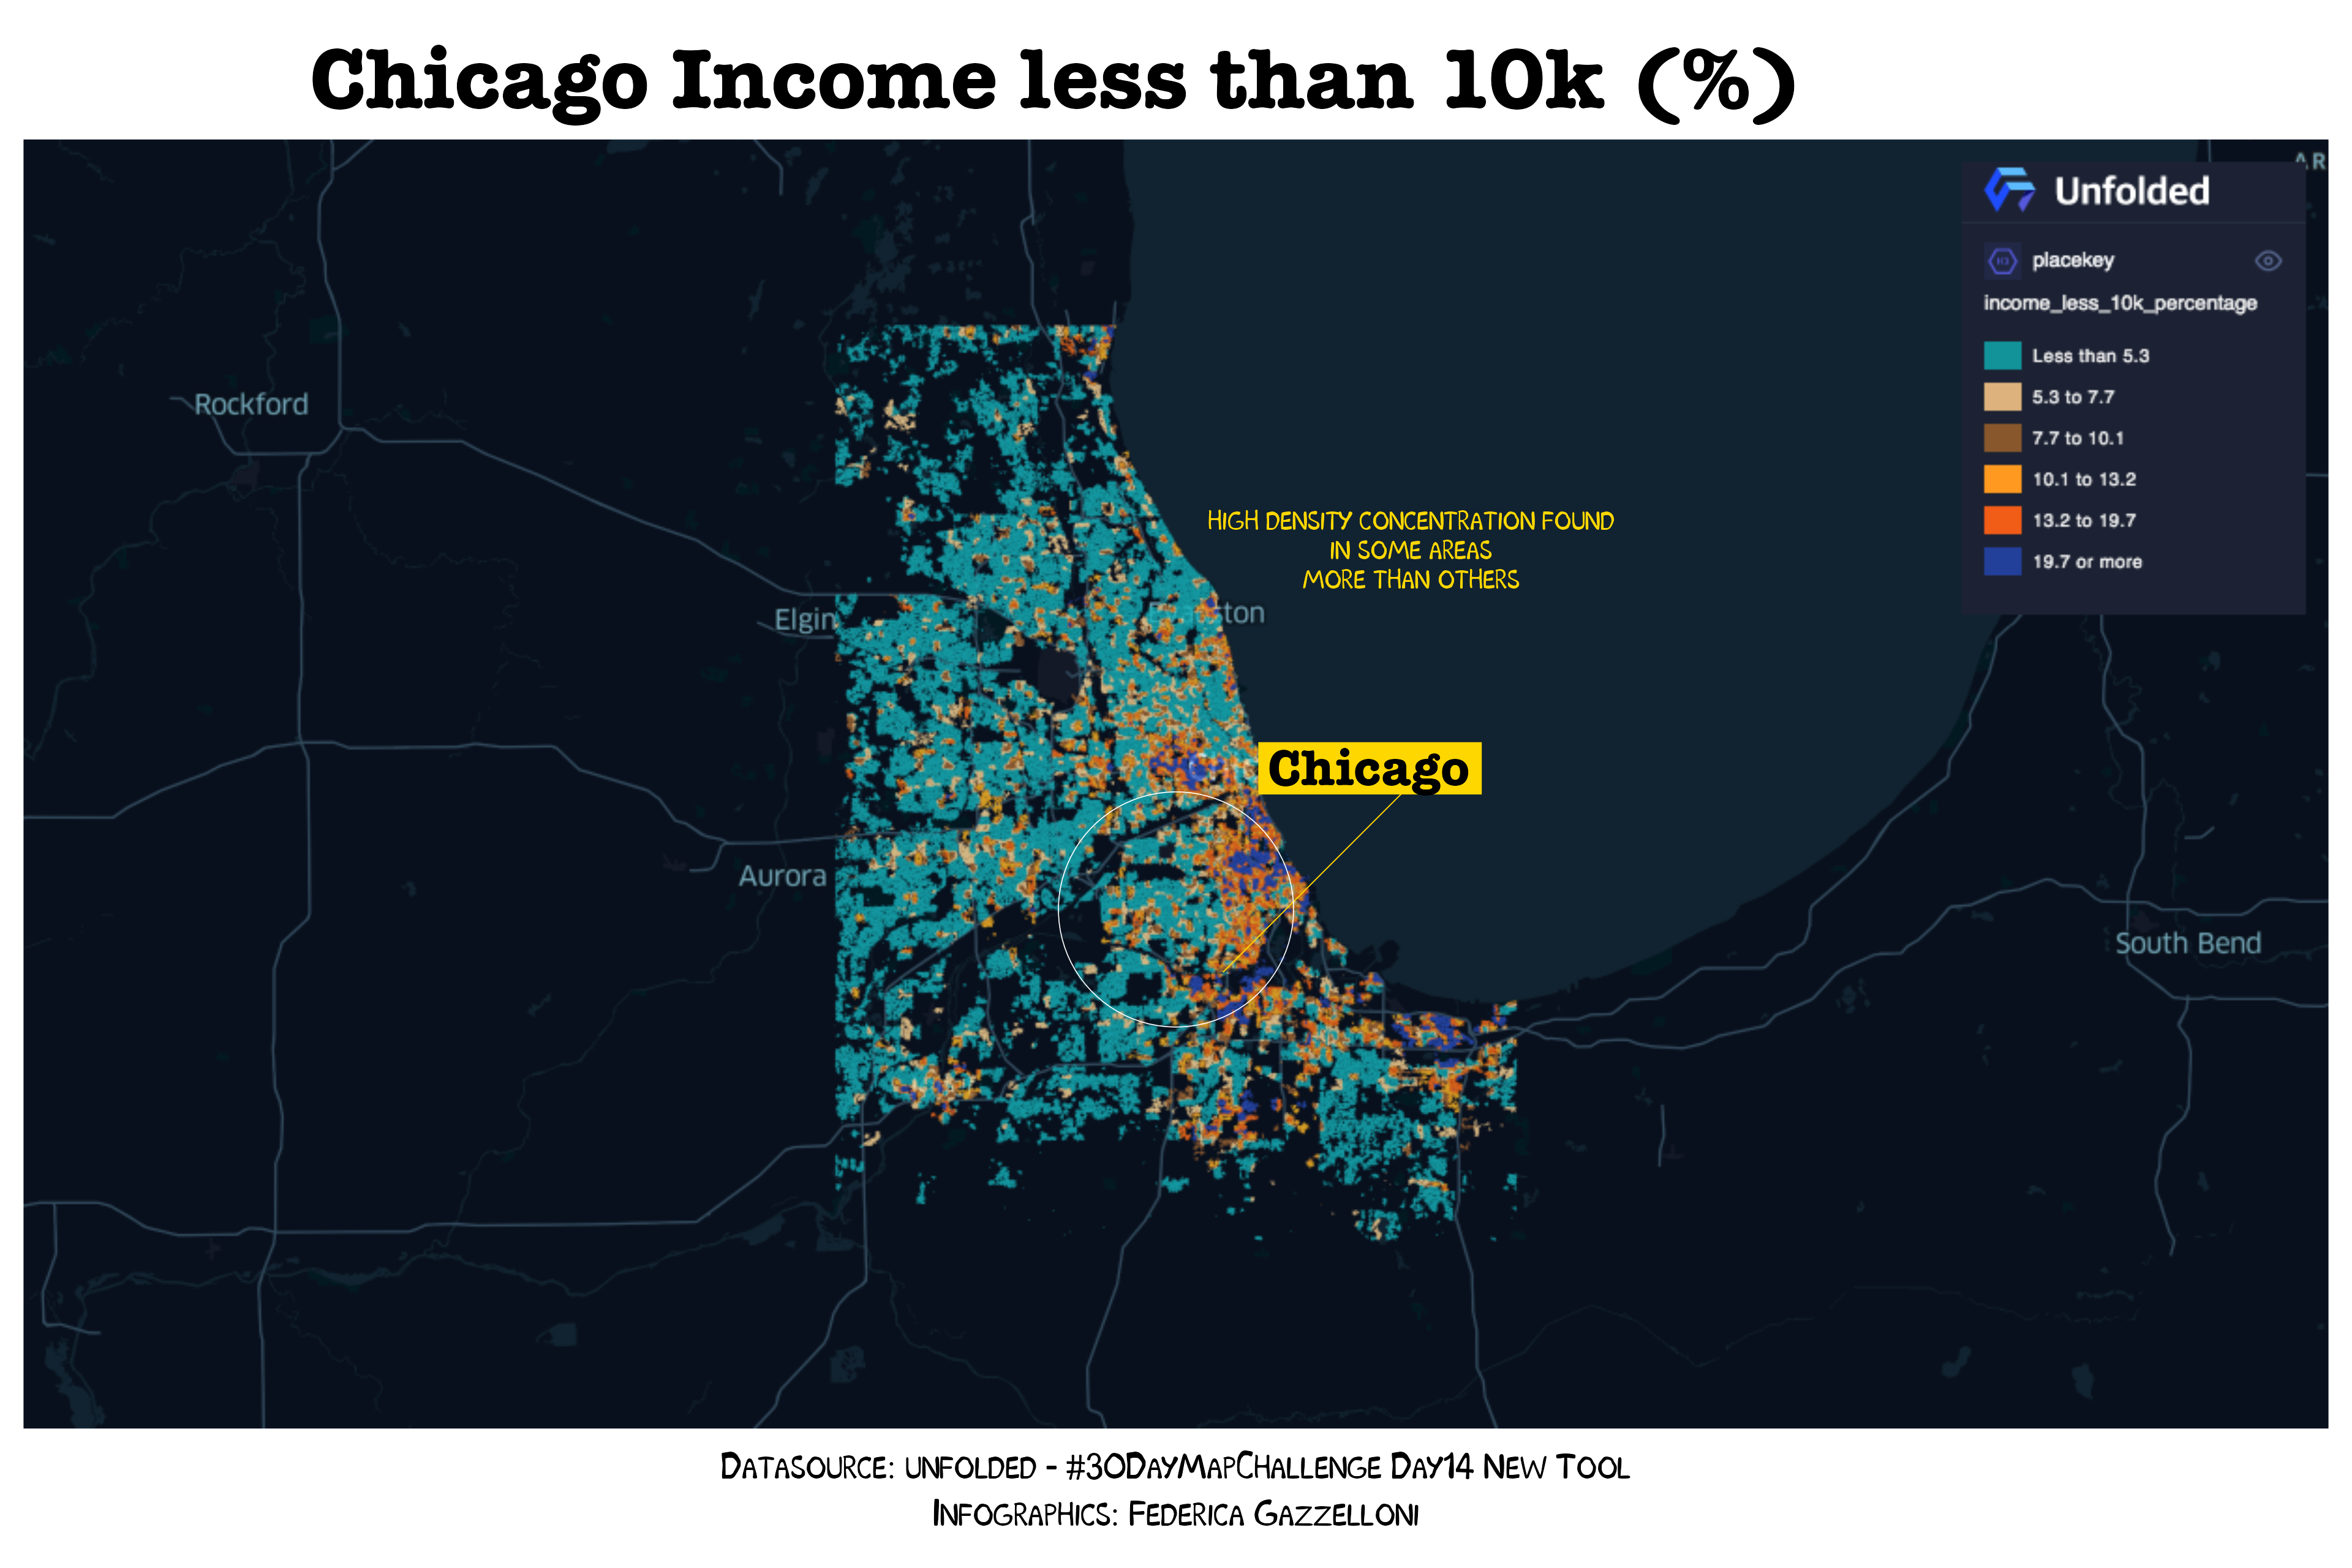
A map of New York population created in Studio Unfolded AI and styled in R.
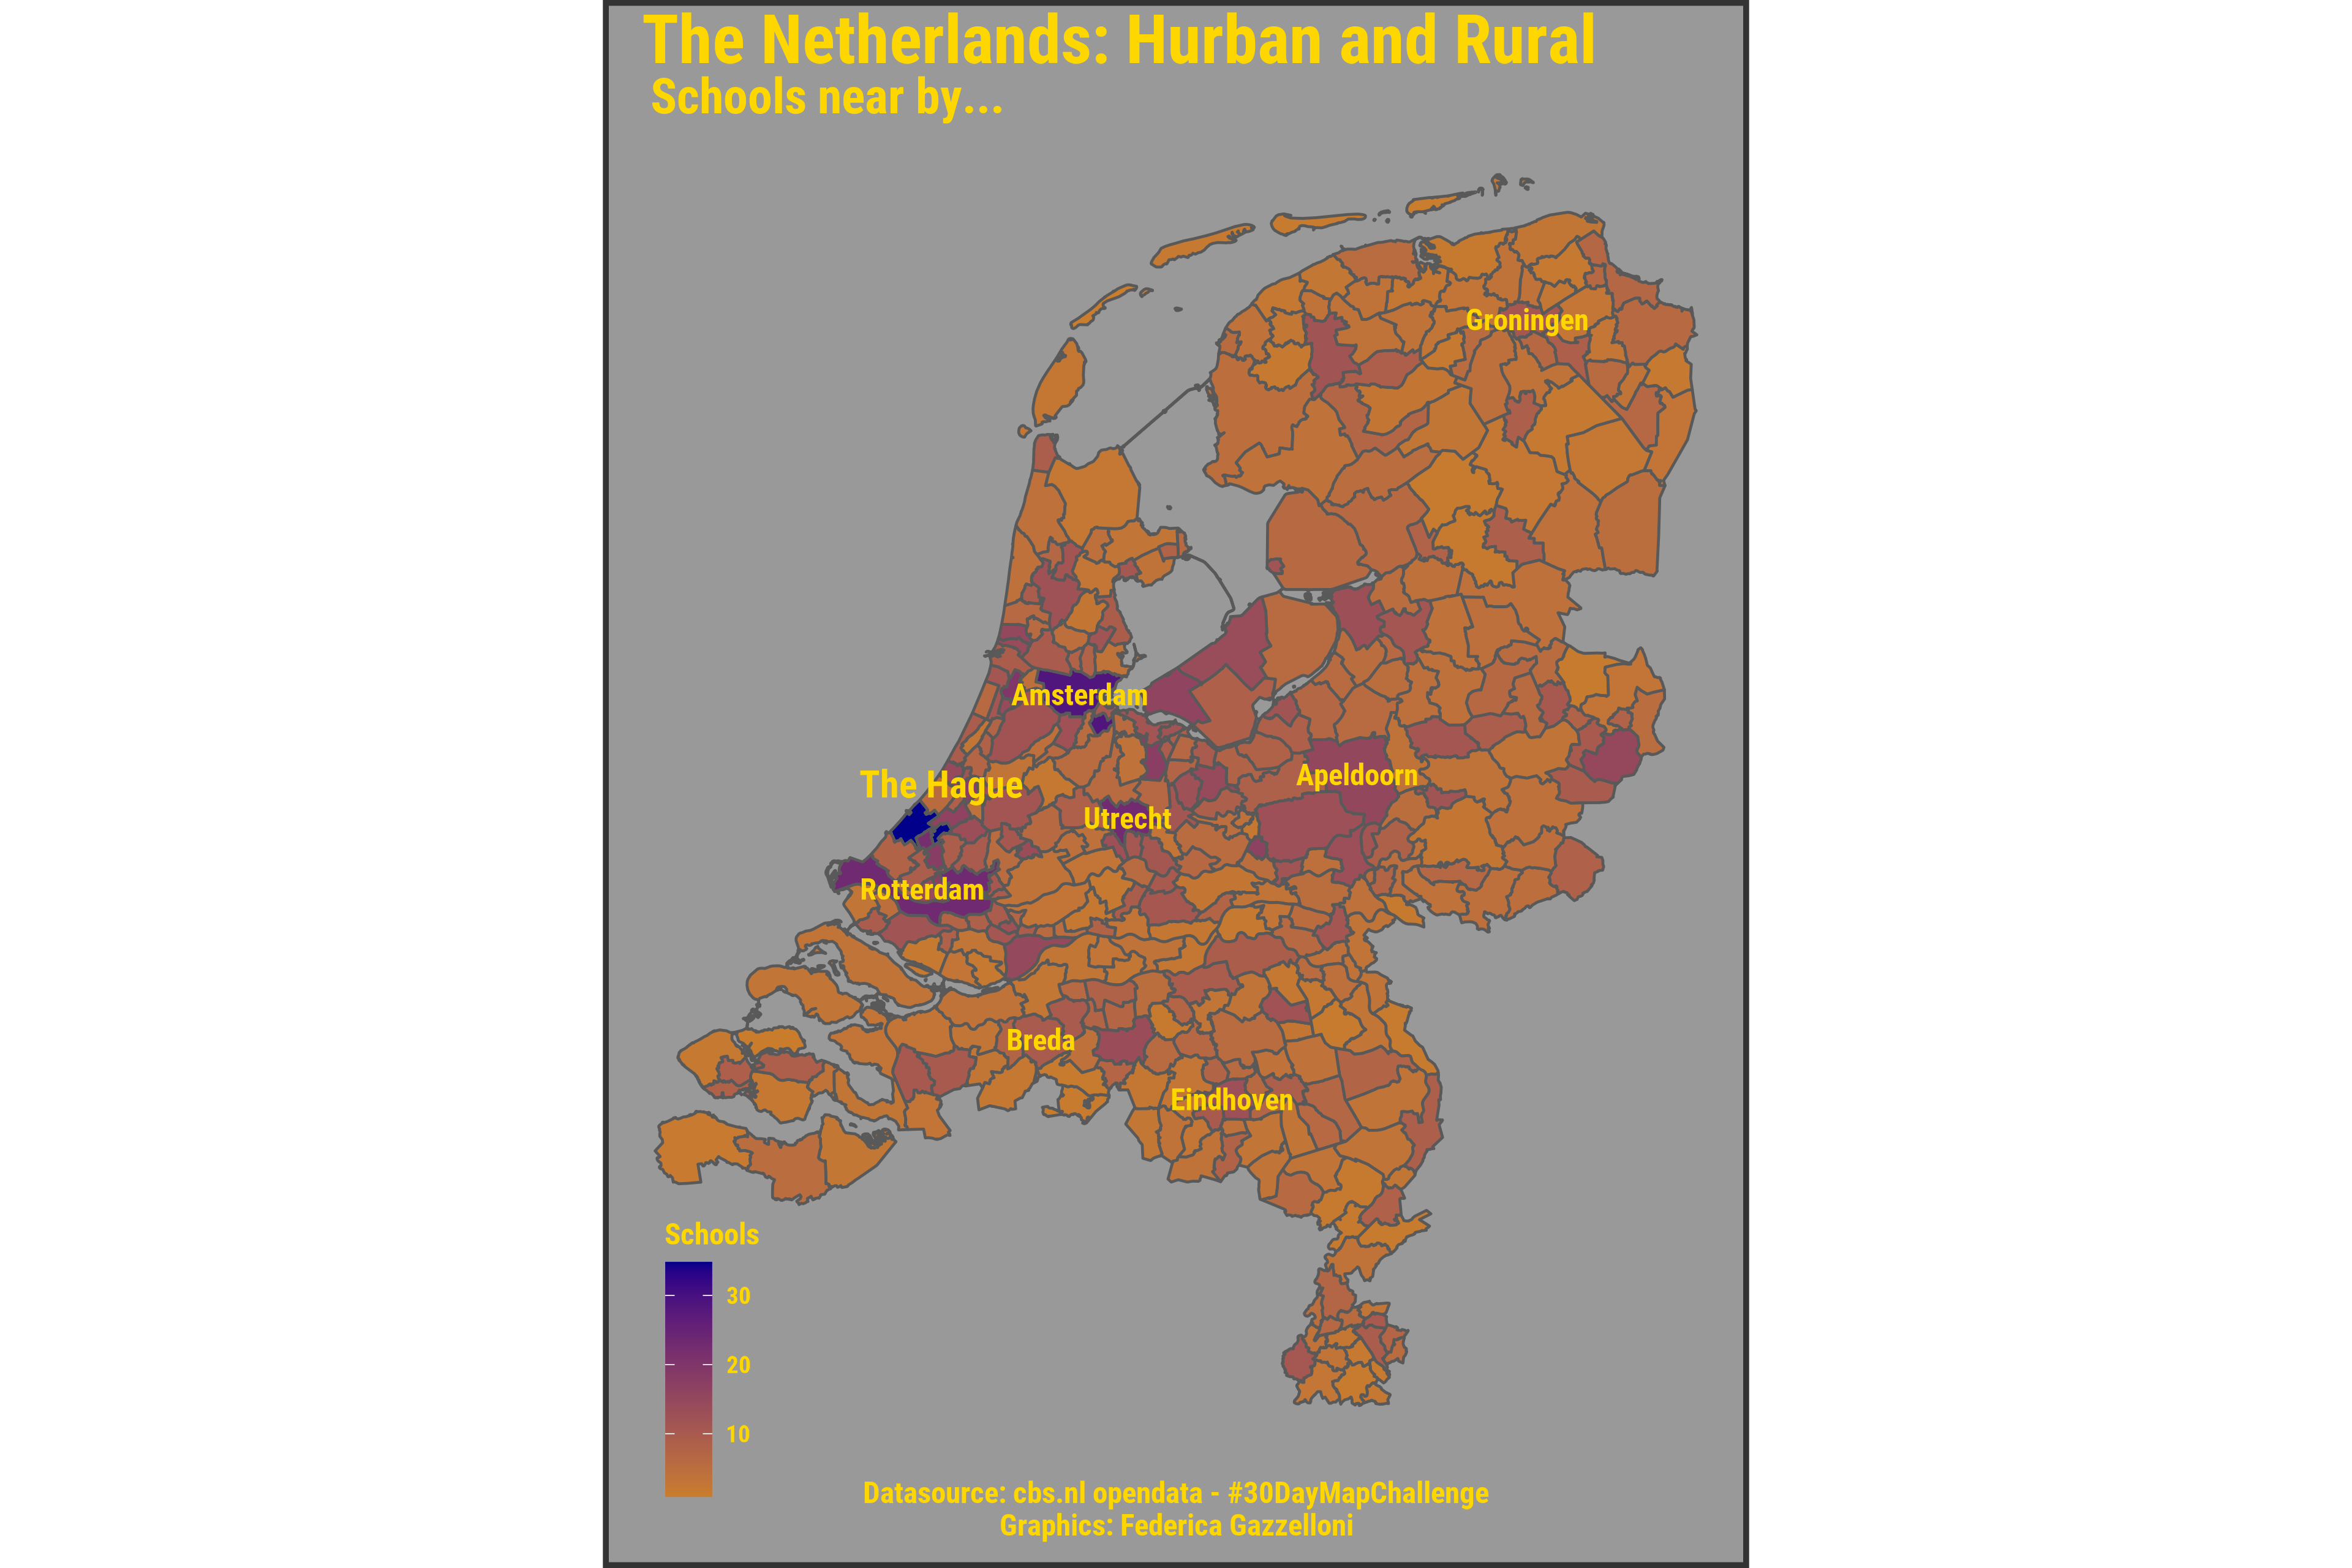
A map of urban and rural areas in the Netherlands showing schools and nearby communities using CBS open data.
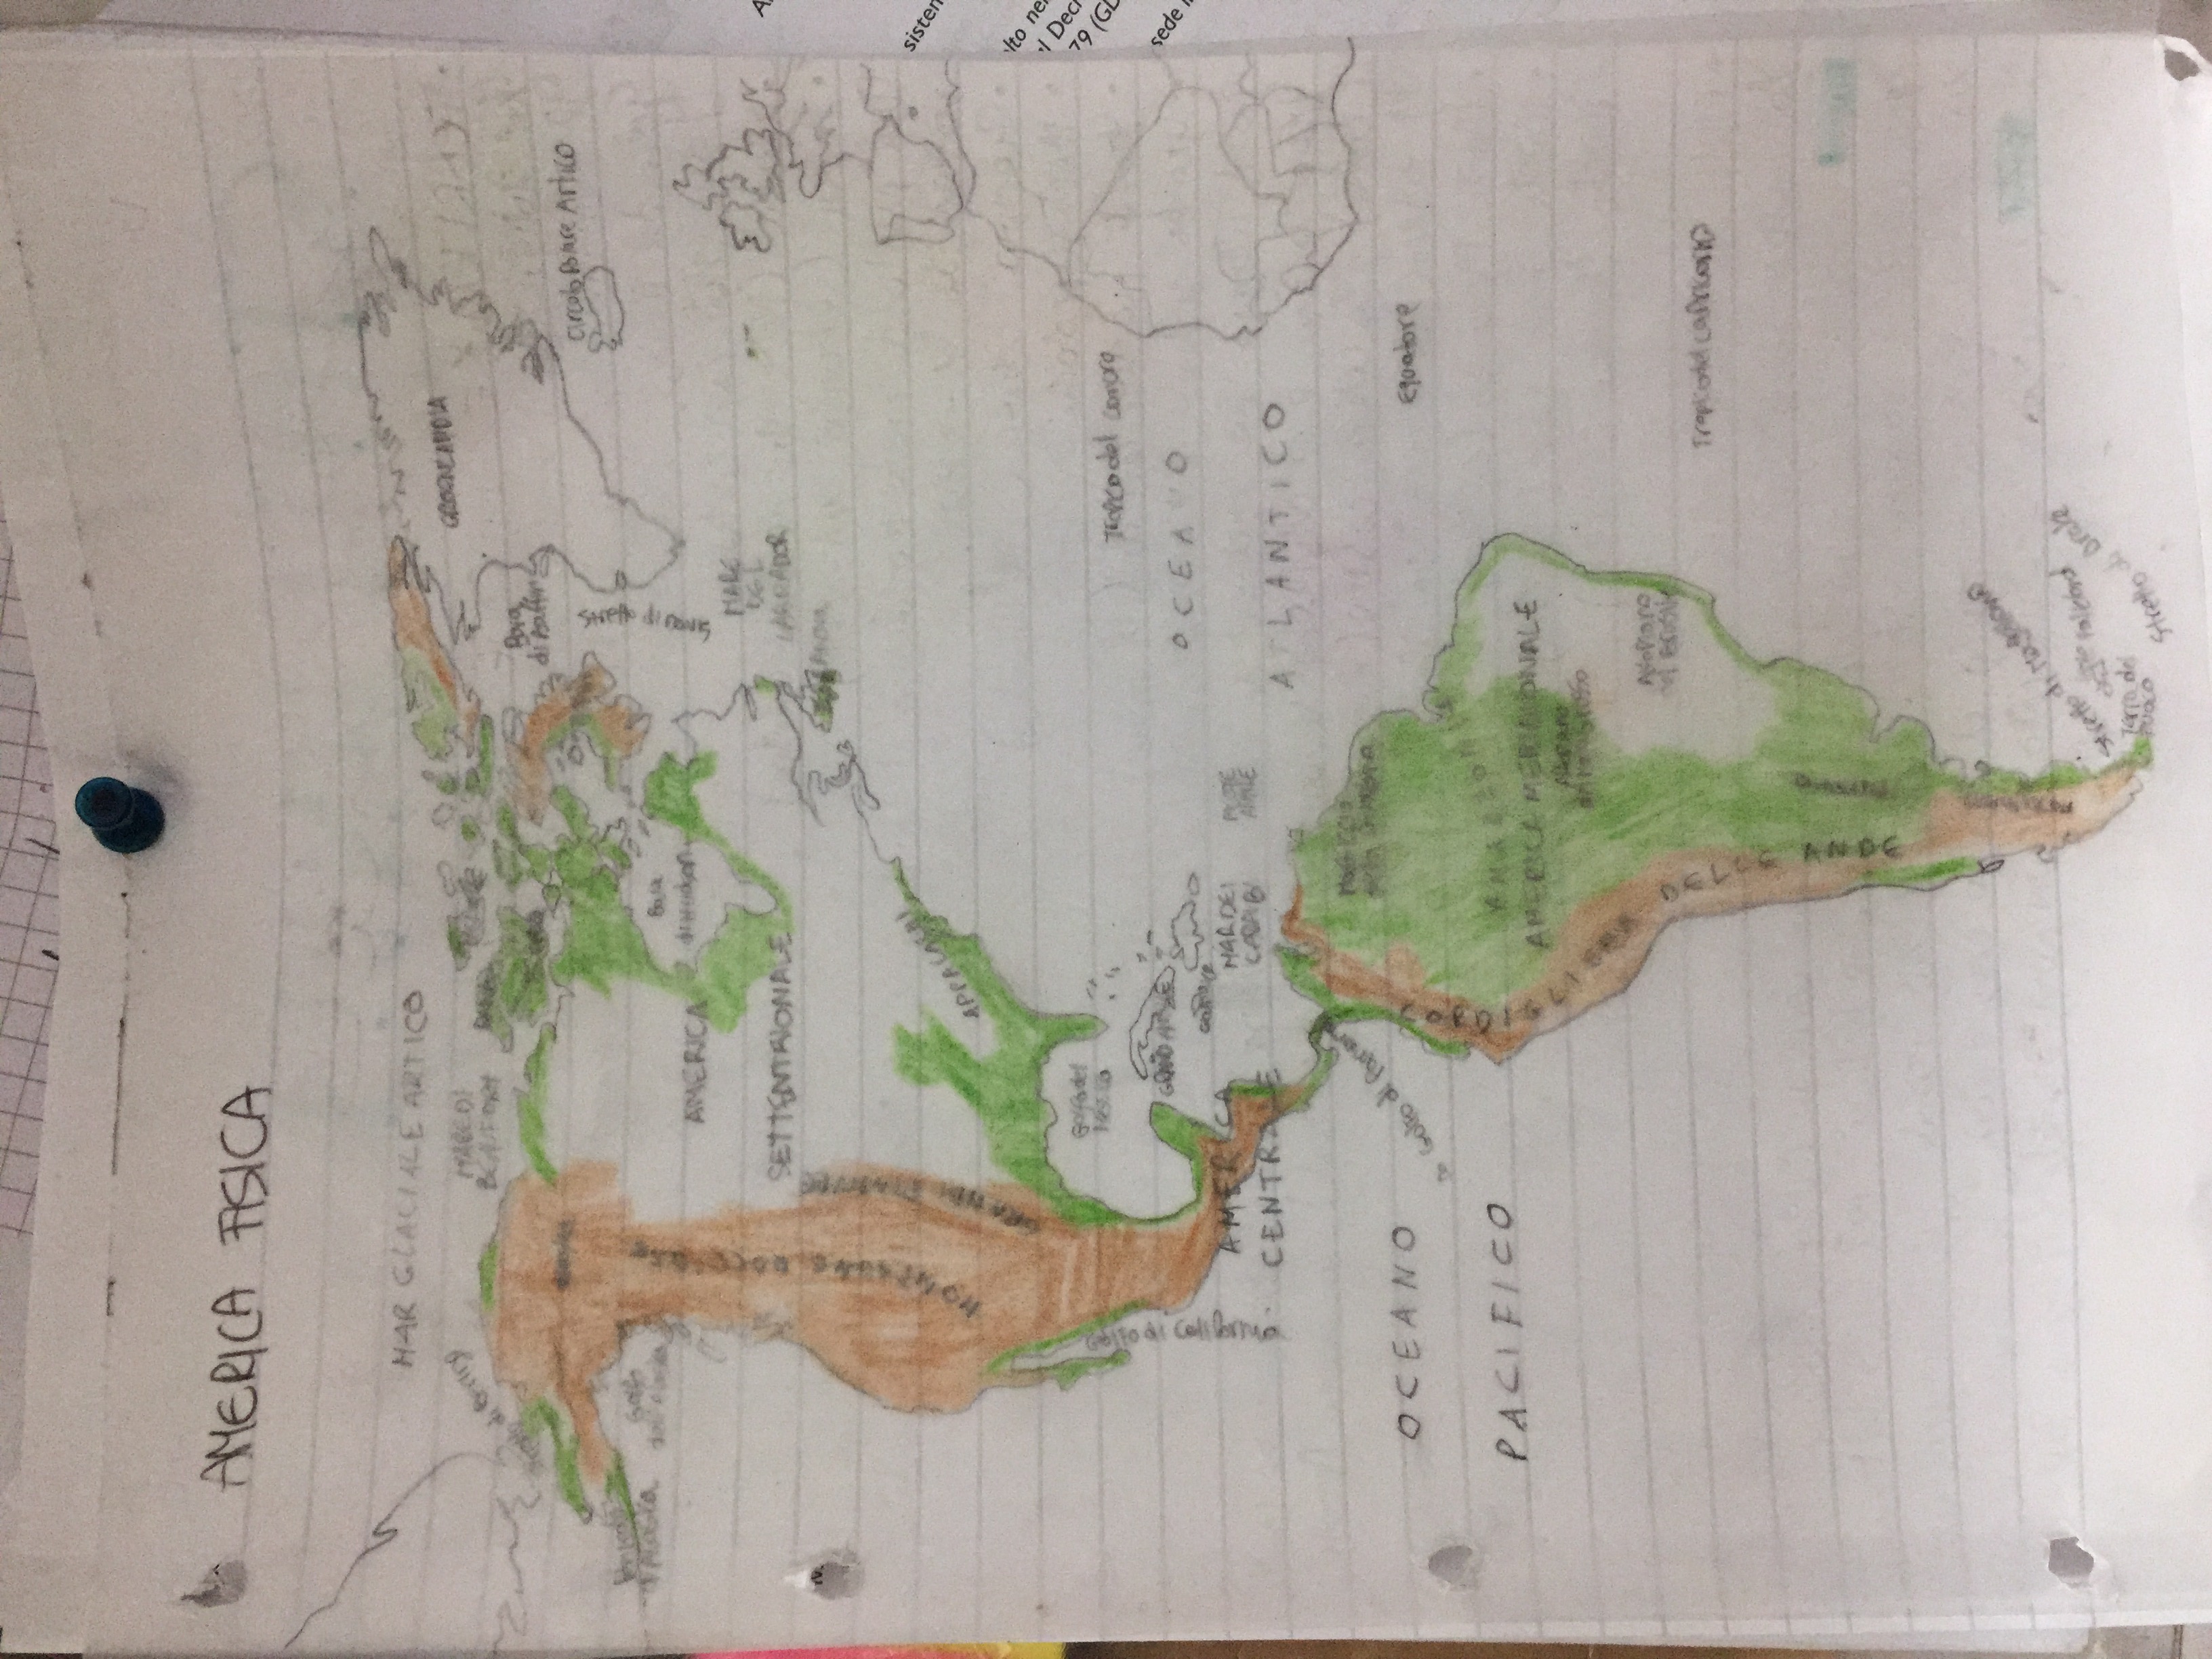
A hand-drawn map of America made without a computer for the 30DayMapChallenge.
A map created with Studio Unfolded AI and styled in R for the new-tool theme of the 30DayMapChallenge.
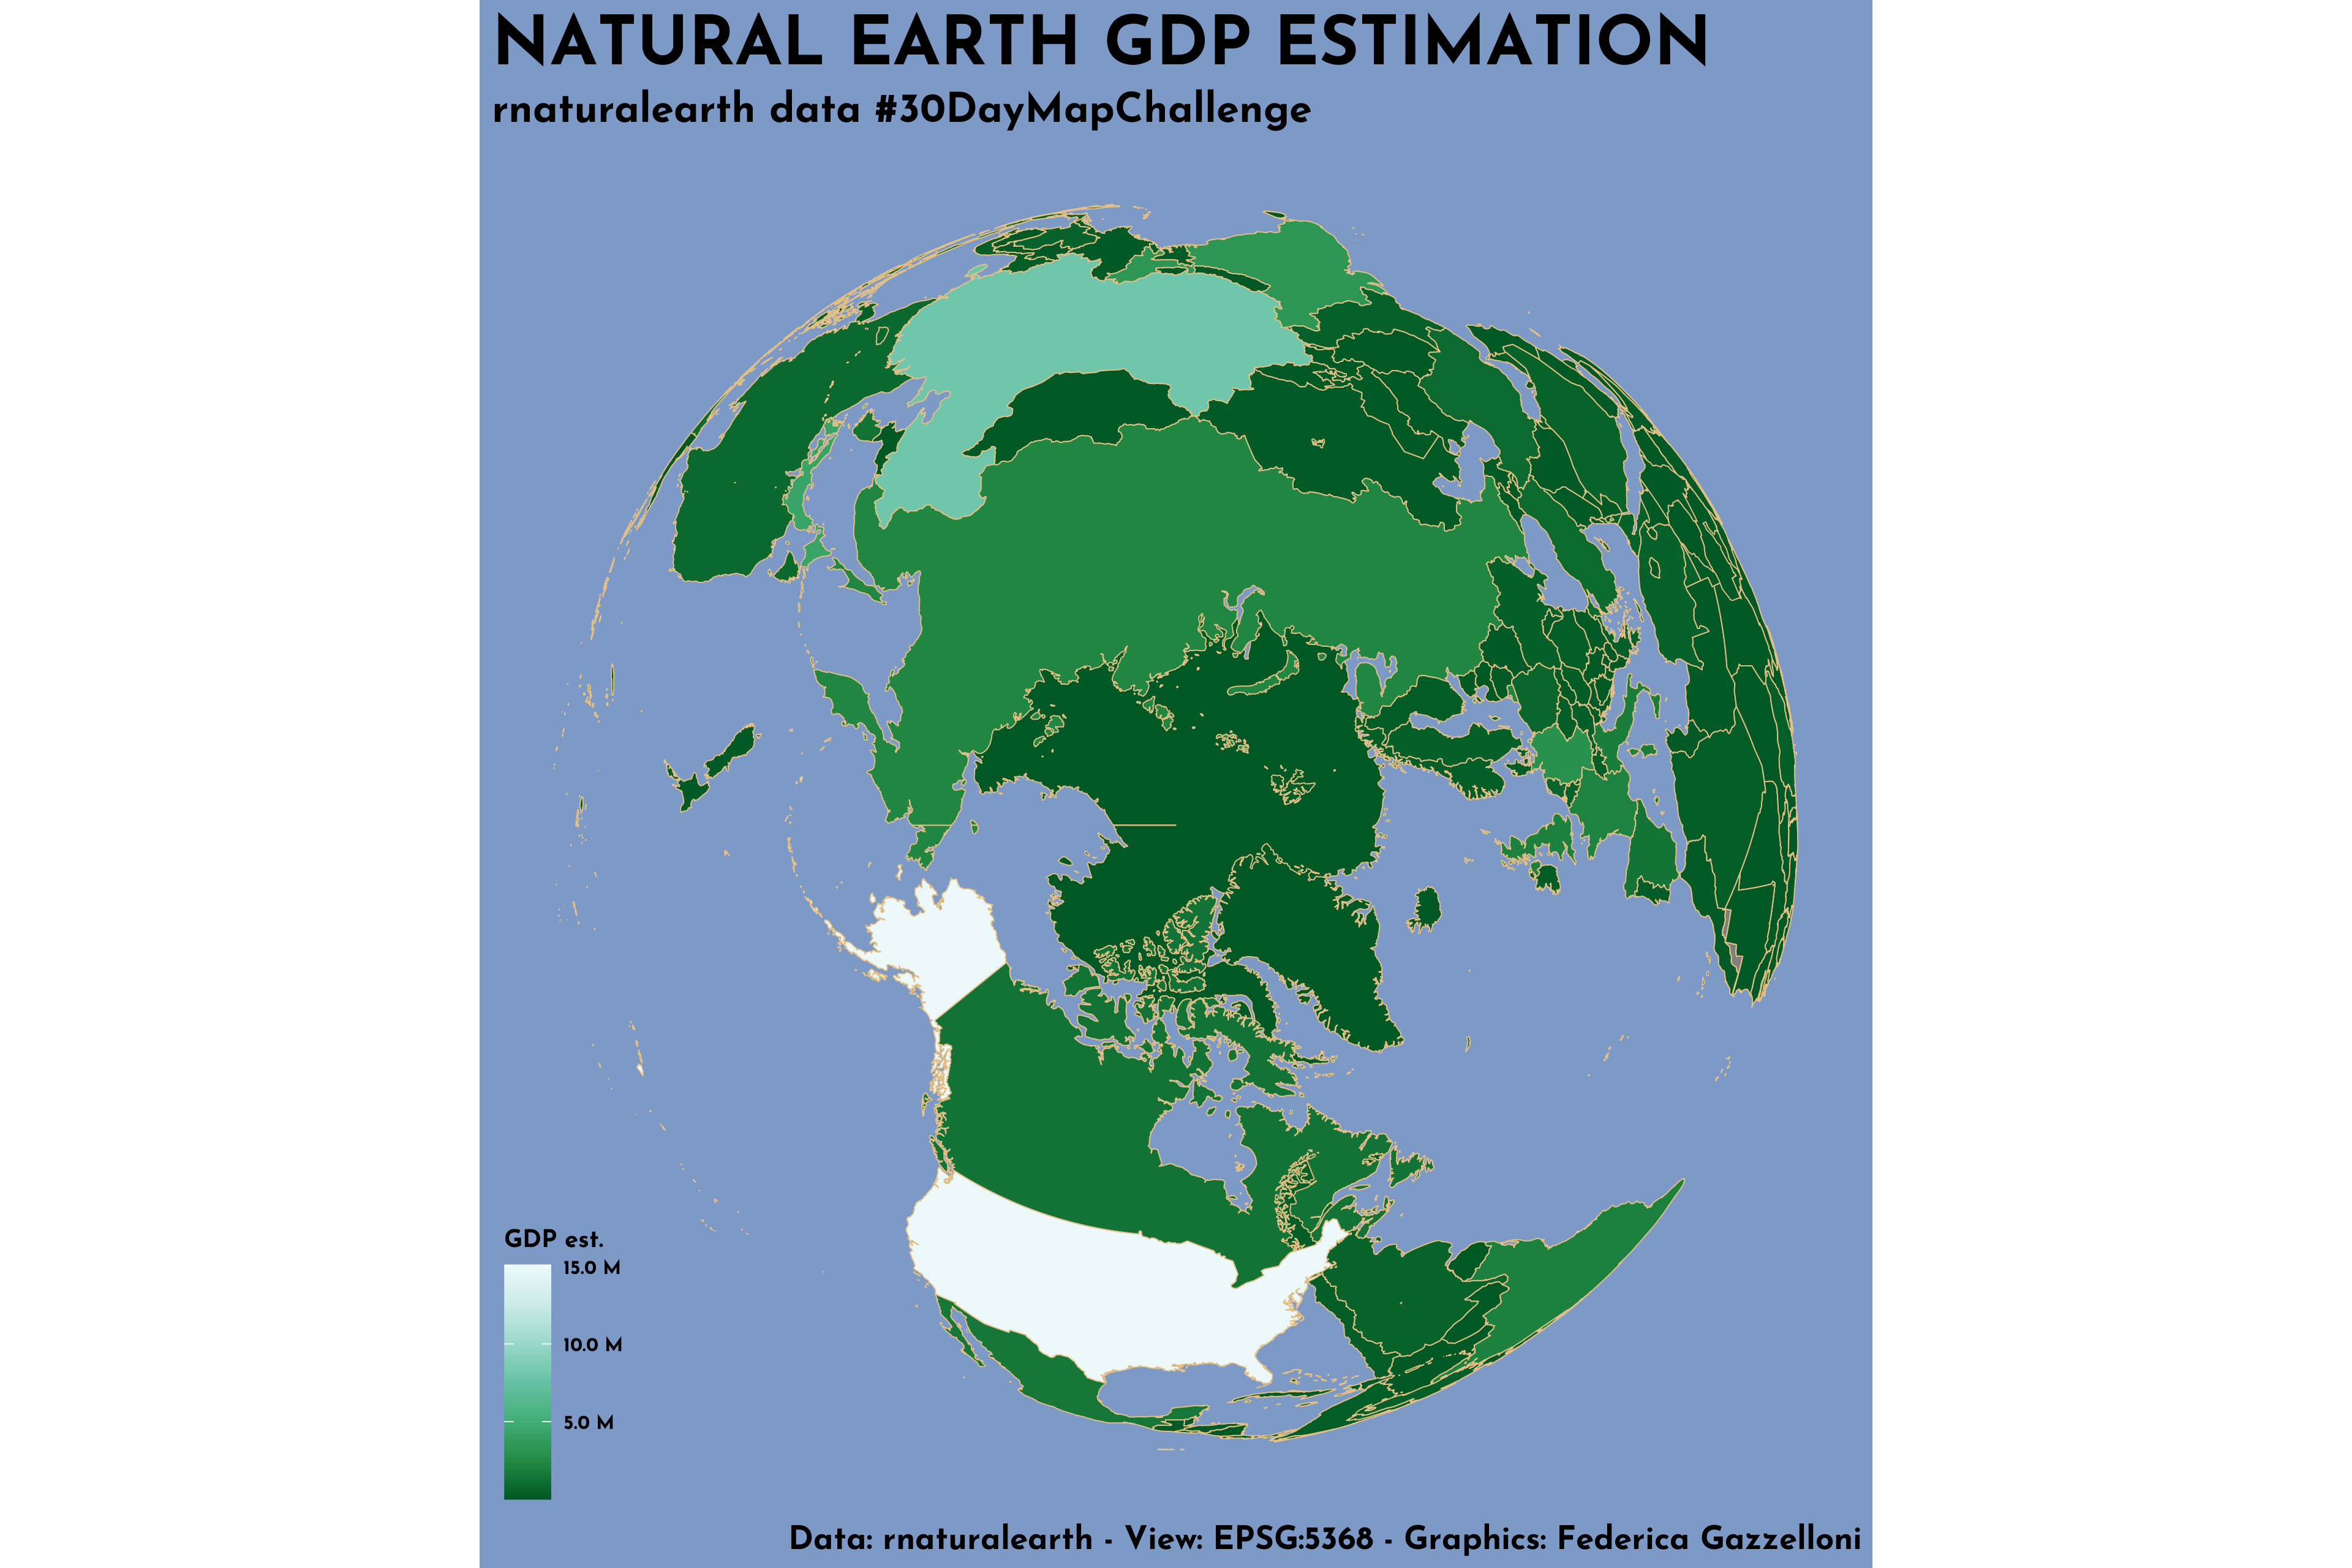
A Natural Earth map estimating gross domestic product across countries using the rnaturalearth package.
A world population map comparing the distribution in 1950 with a projection for 2030.
A 3D world map built from a satellite view captured at 8 a.m. on November 11, 2021, using bom.gov.au data.
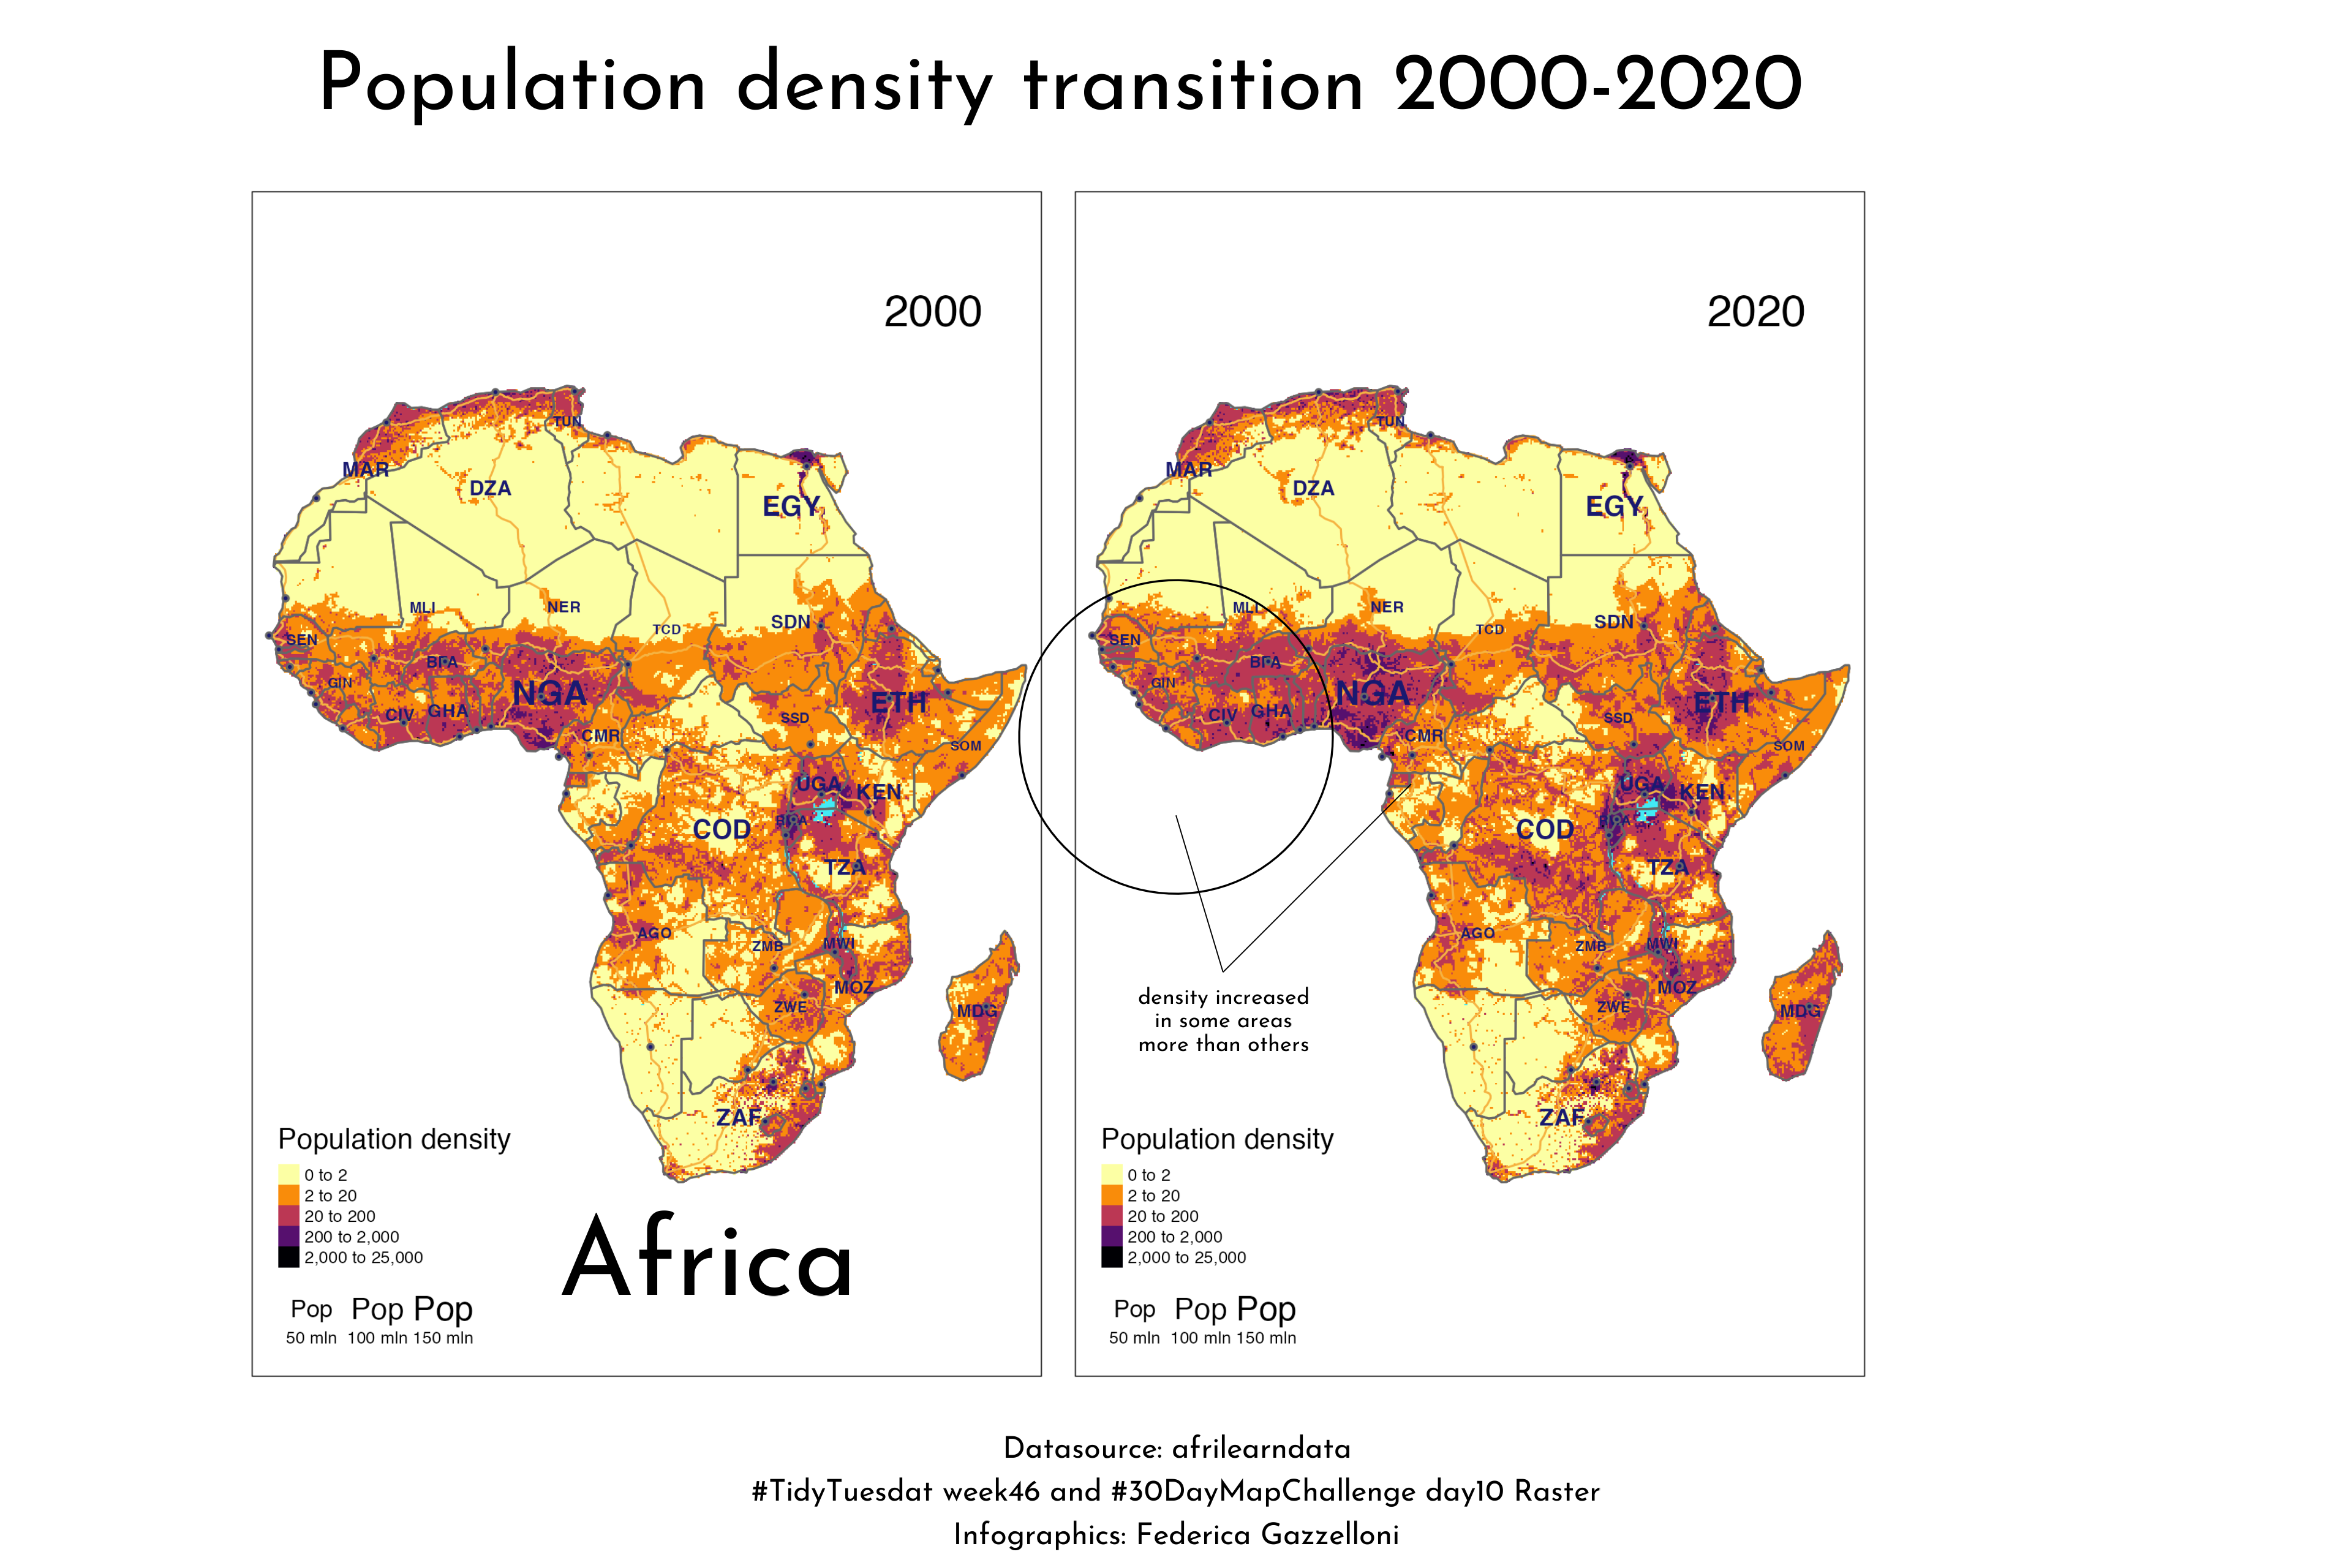
A raster map tracing population change across Africa from 2000 to 2020 using the afrilearndata dataset.
A monochrome map artwork of Italy made with geographic data from the spData R package.
This map Globe Observer shows Sat View of Australia, data is from the Australian Bureau of Meterorology and the {ozmaps} for the geometry of Australia.
Globe Observer
Sat View of Australia
Australian Bureau of Meterorology
{ozmaps}
A map of Greater London combining cycle-hire locations with borough boundaries using TidyTuesday and spData.
An animated county-level map of US drought conditions from January through July 2021 using TidyTuesday data.
An OpenStreetMap-based view of Berlin’s waterways using data from the osmdata package.
A hexagon map of Boston built with geographic data from the spData R package.
A polygon map of the Åland Islands, a region transferred from Sweden to Russia in 1809 and now part of Finland.
A line-based map of France created from geographic data in the maps R package.
A point map showing the geographic distribution of runners from the TidyTuesday 2021 Week 44 race dataset.