A world map of the World Bank multidimensional poverty index, grouped into five index ranges.
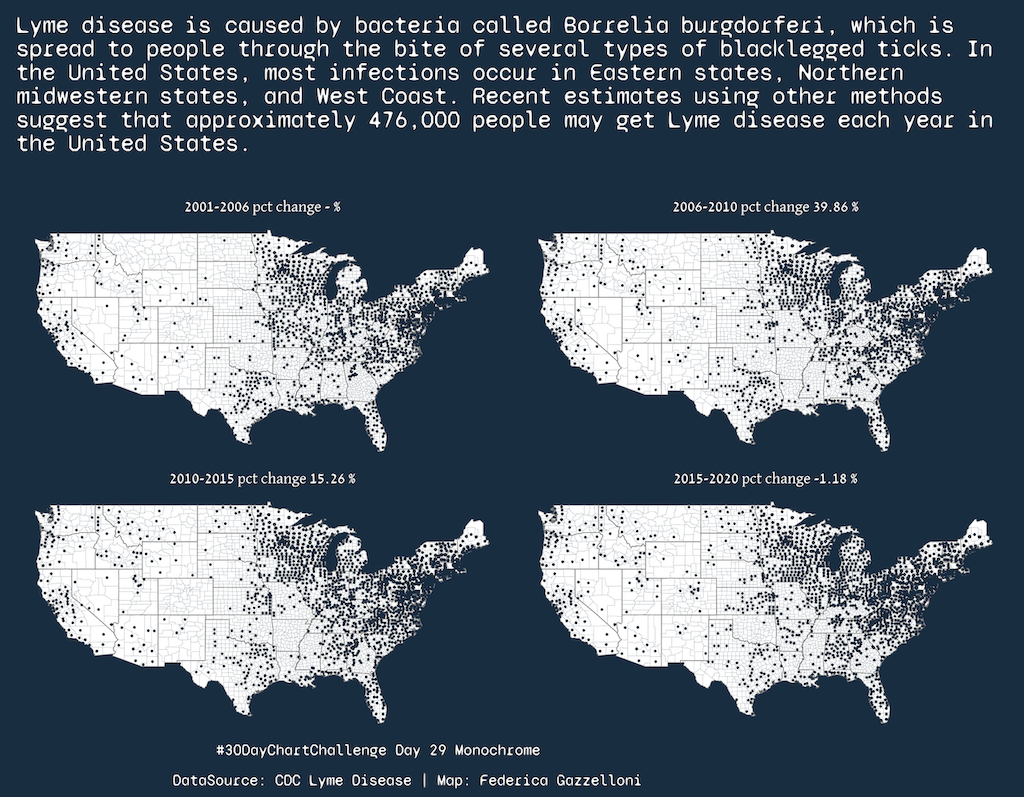
A monochrome map of Lyme disease data from the US Centers for Disease Control and Prevention.
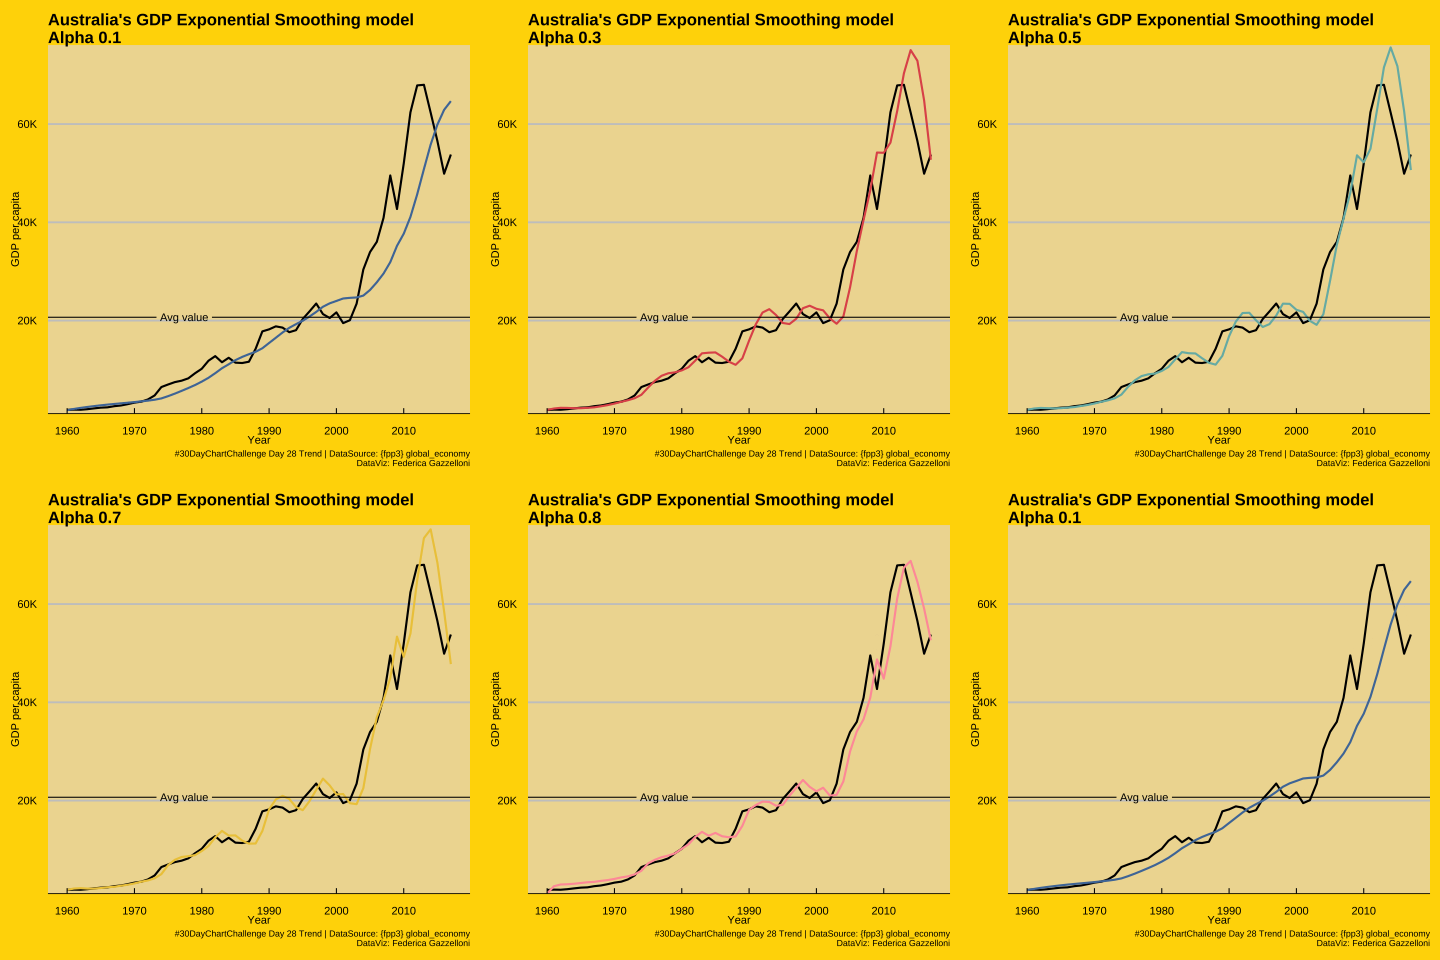
A time-series view of Australian population and GDP per capita with an exponential-smoothing forecast.
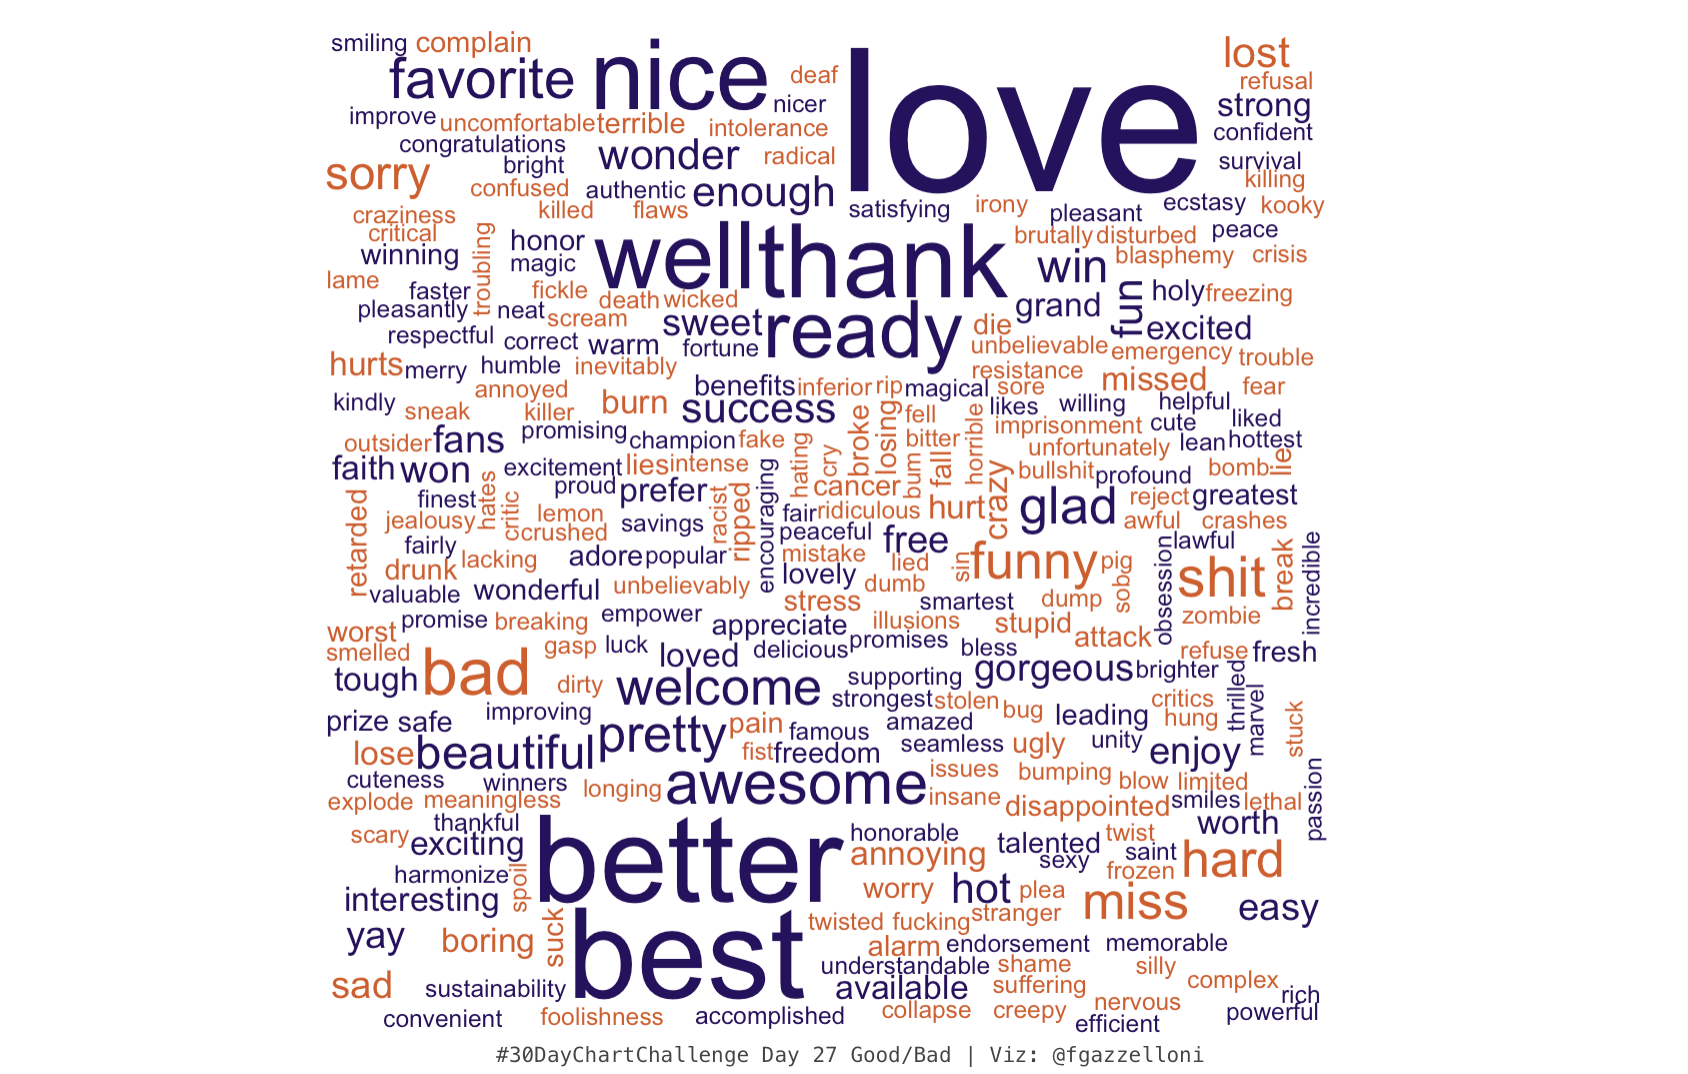
A good-versus-bad word cloud comparing terms in the 30DayChartChallenge visualization.
A chart comparing London Marathon charity fundraising with donation acceptance, scaled by standard deviation.
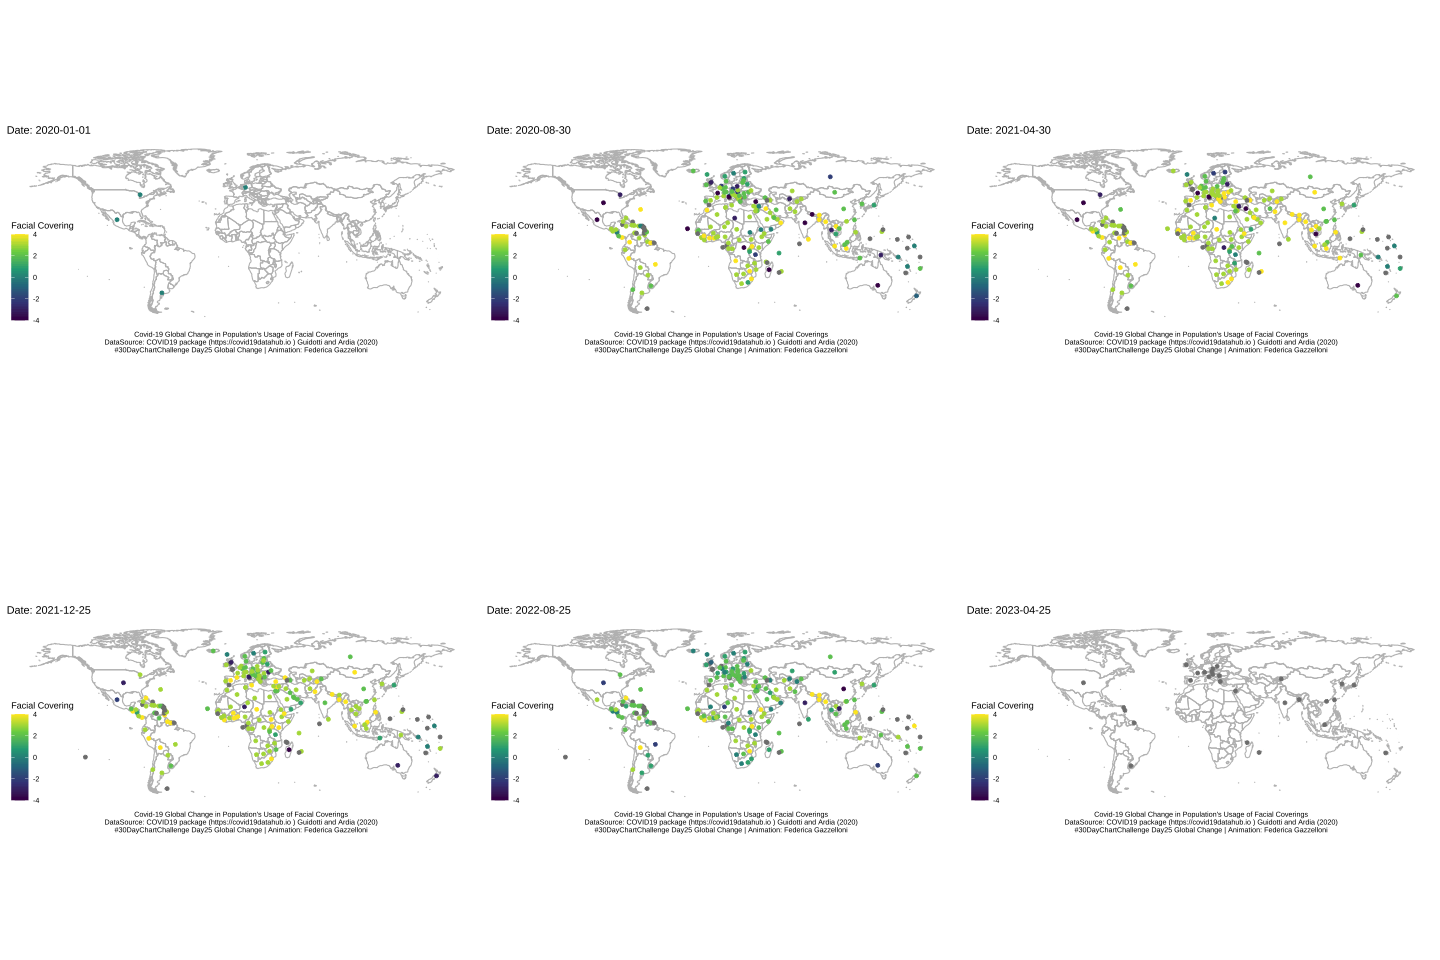
An animation tracking changes in population face-covering use during COVID-19.
A chart of global births by five-year age group of the mother, with counts shown in thousands.
A tiled view of Neolithic founder crops, including wheat, barley, lentils, peas, chickpeas, vetch, and flax.
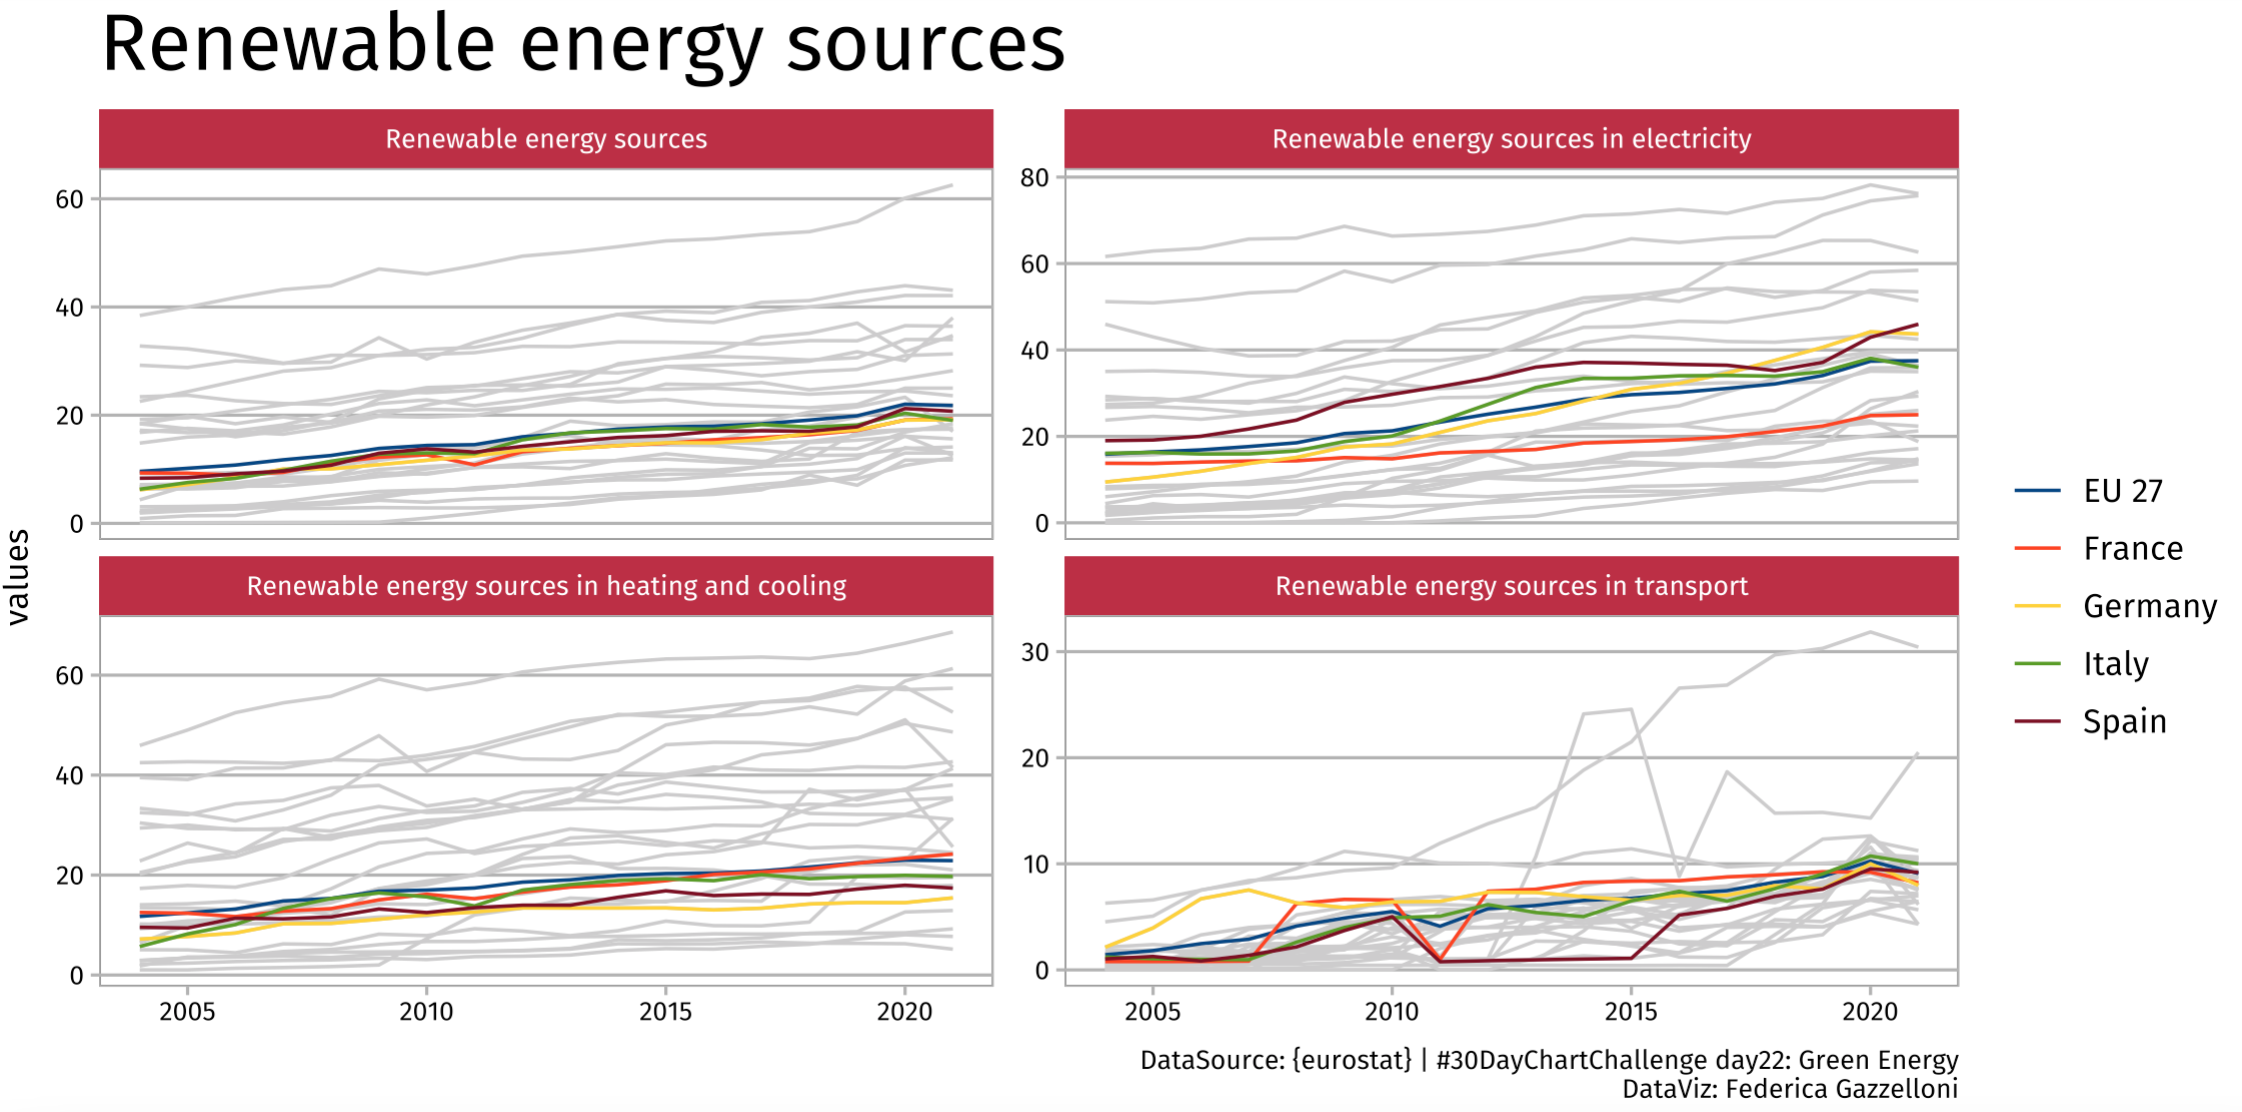
A visualization of renewable energy sources using Eurostat data for the Green Energy theme.
A comparison of US egg production by hens and eggs from August 2016 to February 2021.
A correlation analysis of Premier League match statistics, including fouls, shots, and cards.
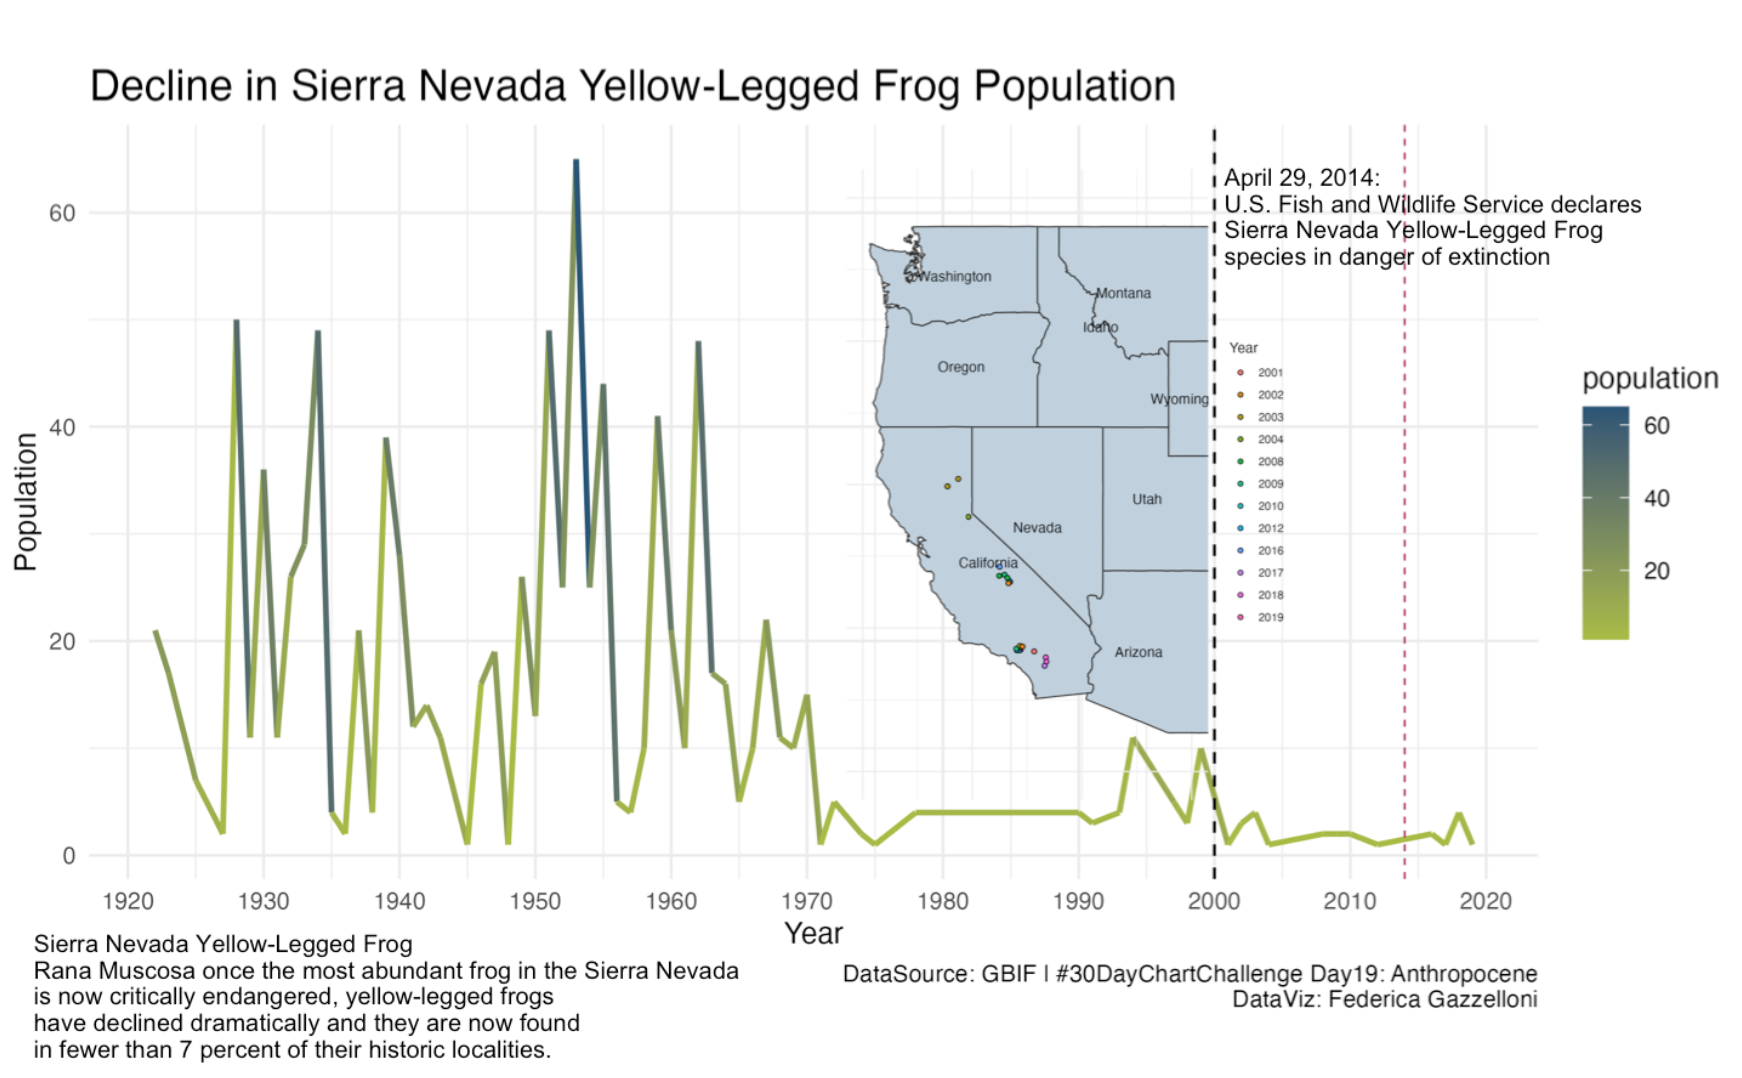
A chart of the declining Sierra Nevada yellow-legged frog population using GBIF observations.
A comparison of healthy life years by sex in 2020 using Eurostat data.
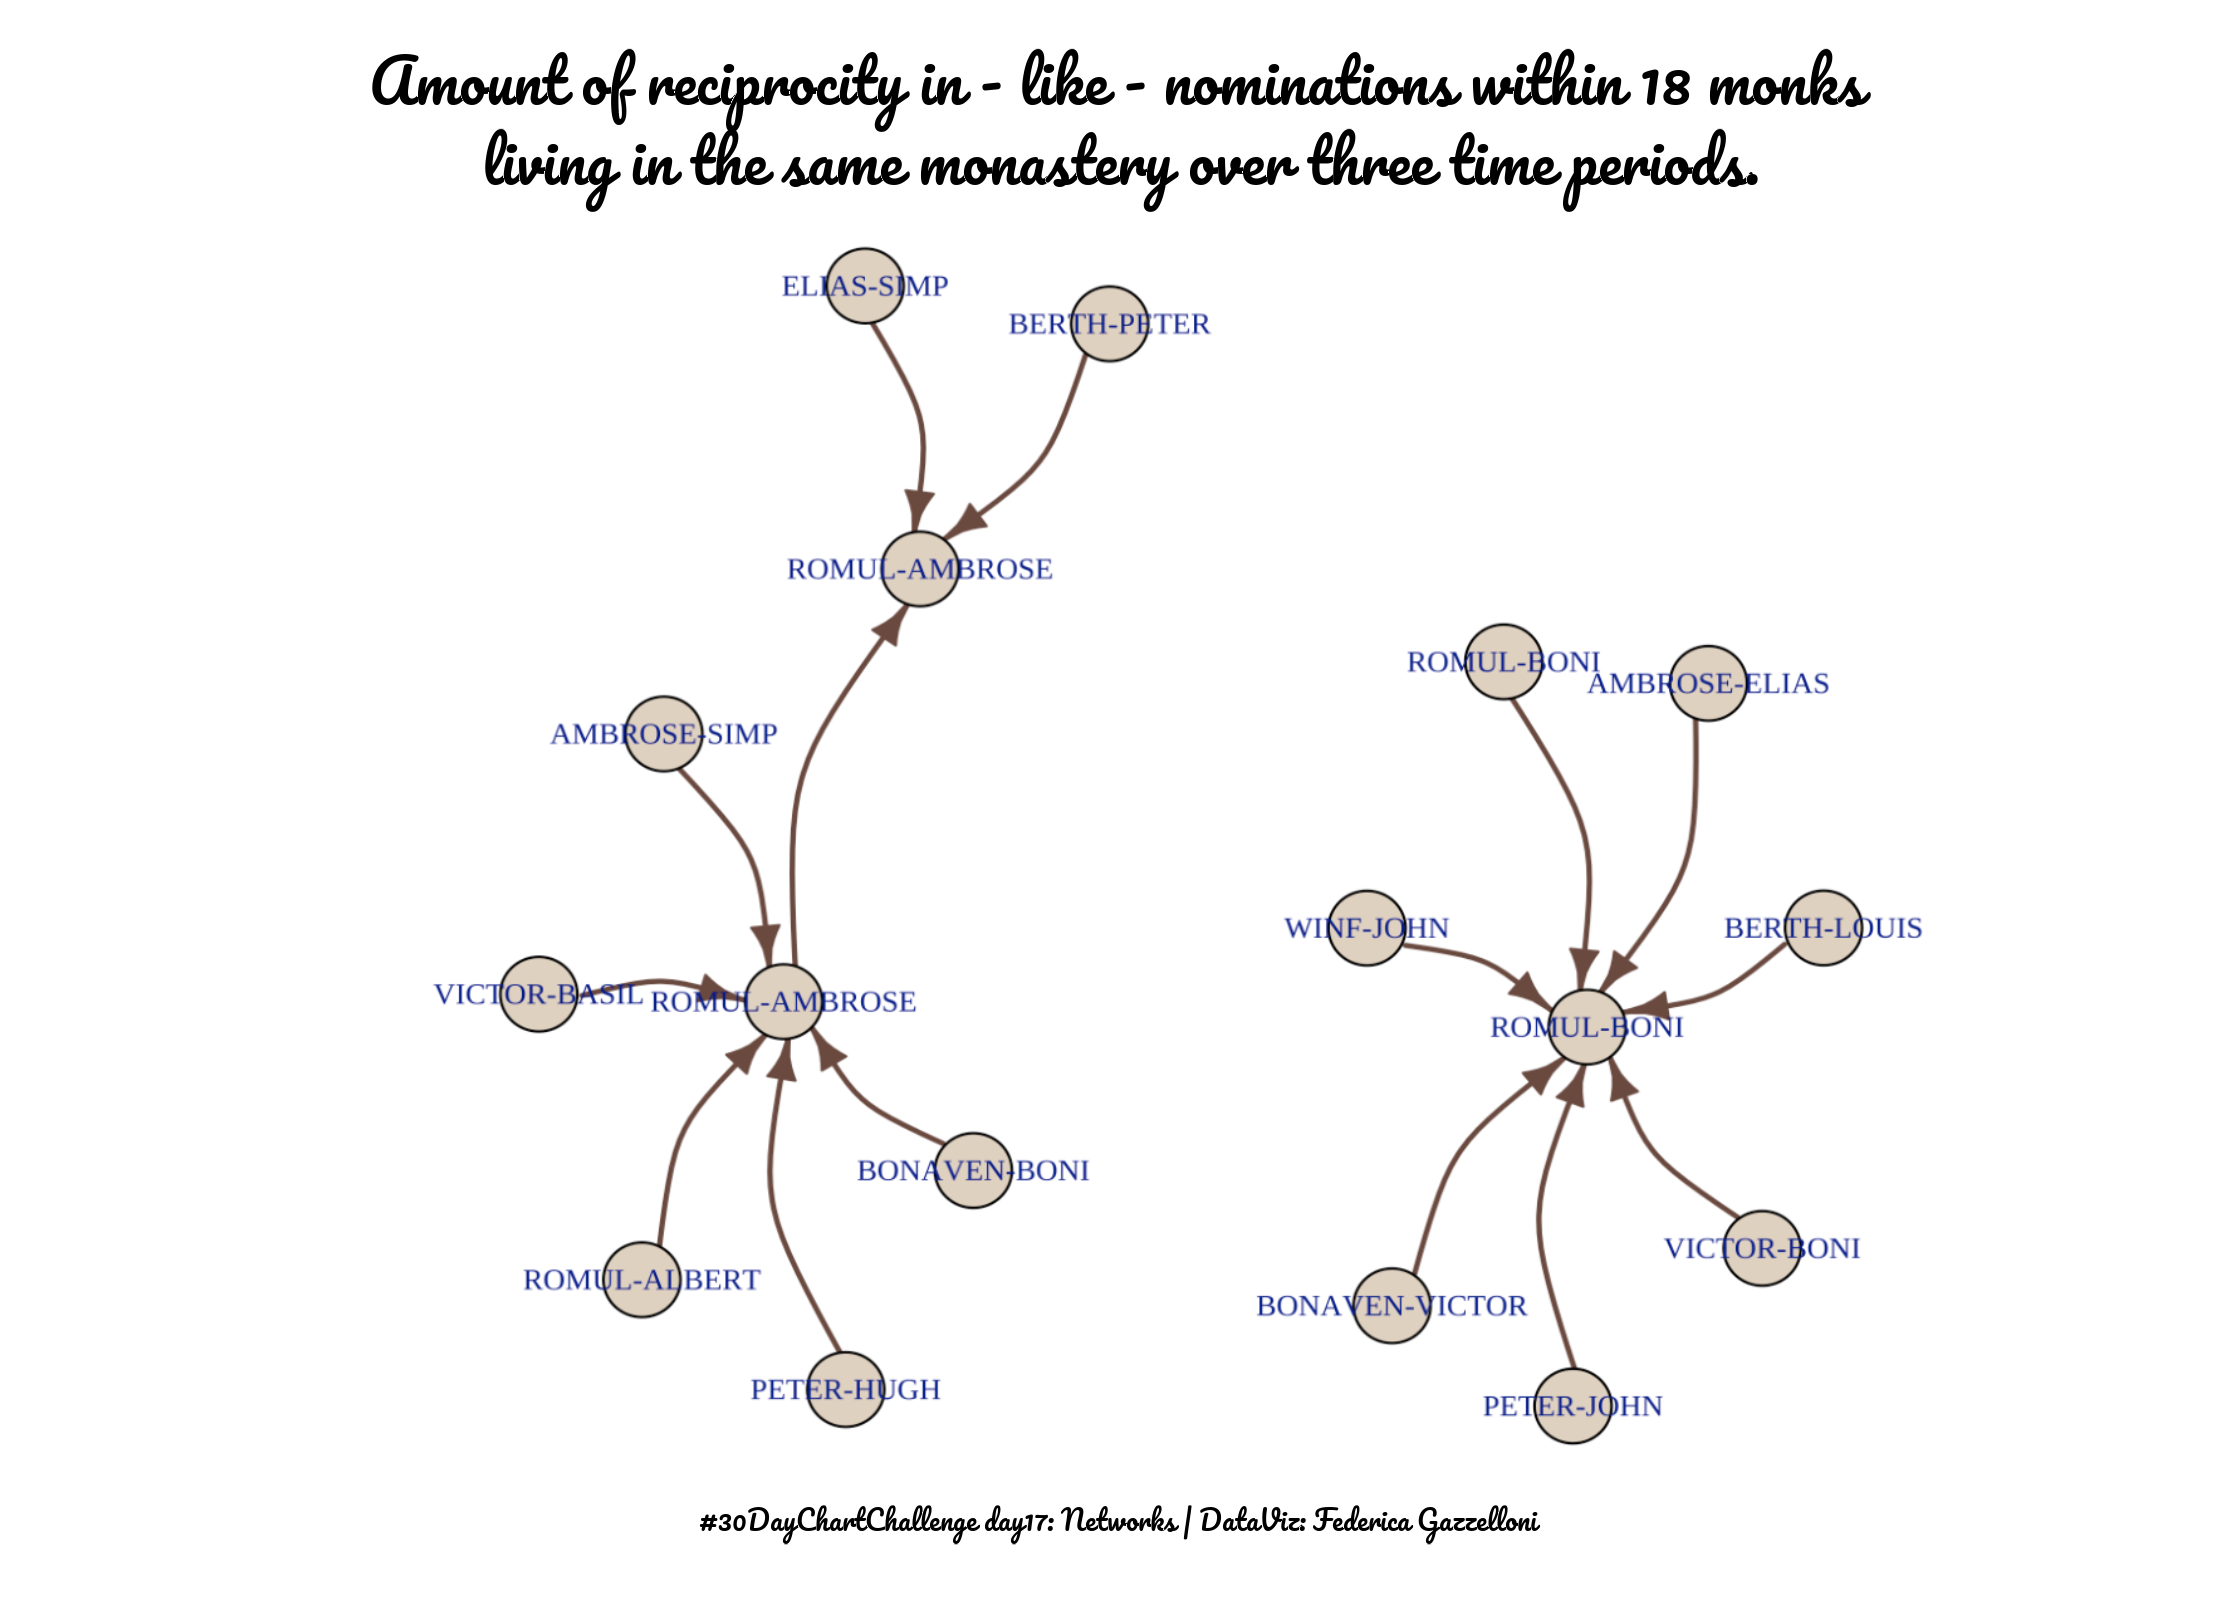
A network graph of mutual liking nominations among 18 monks in one monastery, showing their relationships over three time periods.
A family-themed word cloud created for the 30DayChartChallenge.
A coordinate-based view of time-zone locations, using positive and negative geographic coordinates.
A visualization of programming-language creation dates, ranks, types, and user counts from the TidyTuesday dataset.
A pop-culture timeline of books, films, and shows addressing mental health, cancer, and opioid addiction.
A map of endangered numbat habitat and geographic distribution across Australia.
A circular visualization of sentiment in African-language text using the TidyTuesday dataset.
A hybrid chart comparing color variation across Bob Ross paintings from the TidyTuesday collection.
A comparison of average age gaps in Hollywood, showing age differences and counts.
A time-series chart of Big Tech stock prices, showing price changes over time.
A Kaplan-Meier survival chart of pet cats in the United Kingdom using TidyTuesday data.
A comparison of Canadian Alone TV viewership and Our World in Data COVID-19 case counts during 2020.
A slope chart comparing how much space male Italian artists occupied in art-history textbooks.
A historical chart of the maximum number of birds seen at one time during FeederWatch observations.
A map of Oregon spotted frogs showing their locations and density distributions by sex.
A waffle chart of Star Trek book, story, and episode series using the TidyTuesday 2022 dataset.
A comparison of US weather forecast accuracy, connecting annual precipitation and monthly temperature patterns using TidyTuesday data.