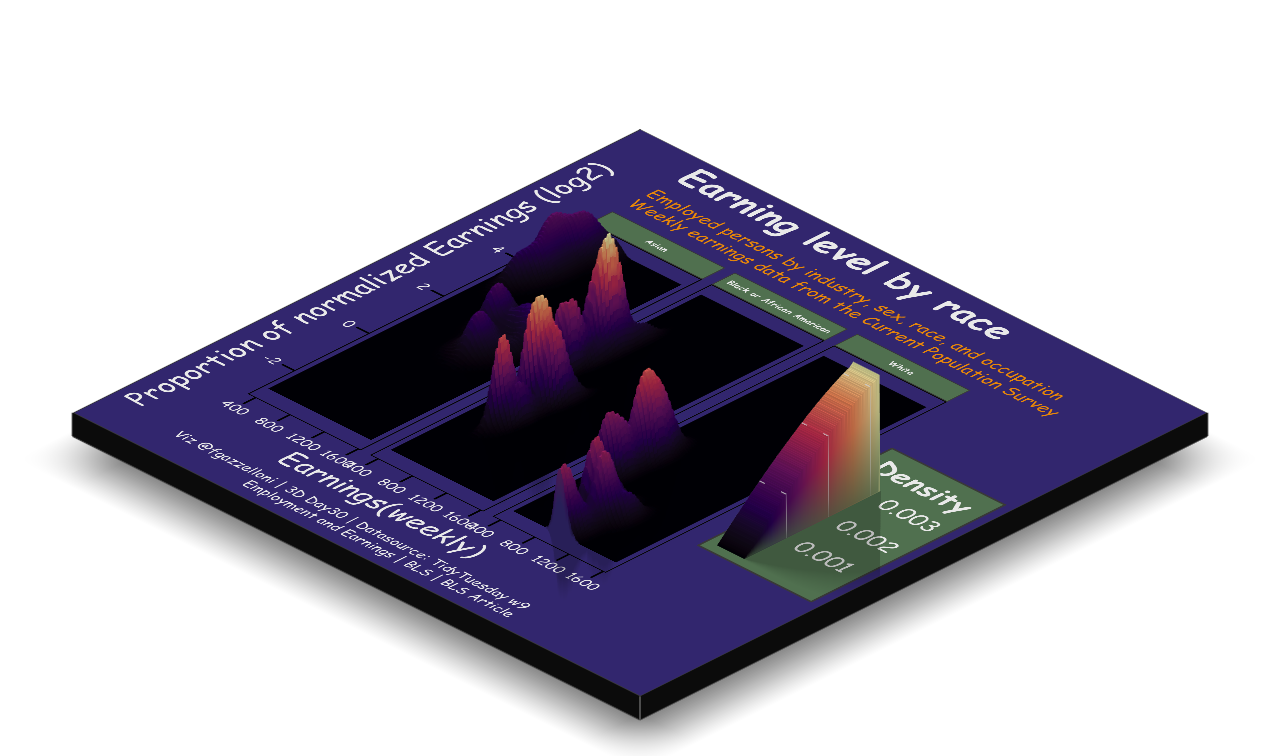
A 3D comparison of US employment and weekly earnings by race, industry, sex, and occupation.
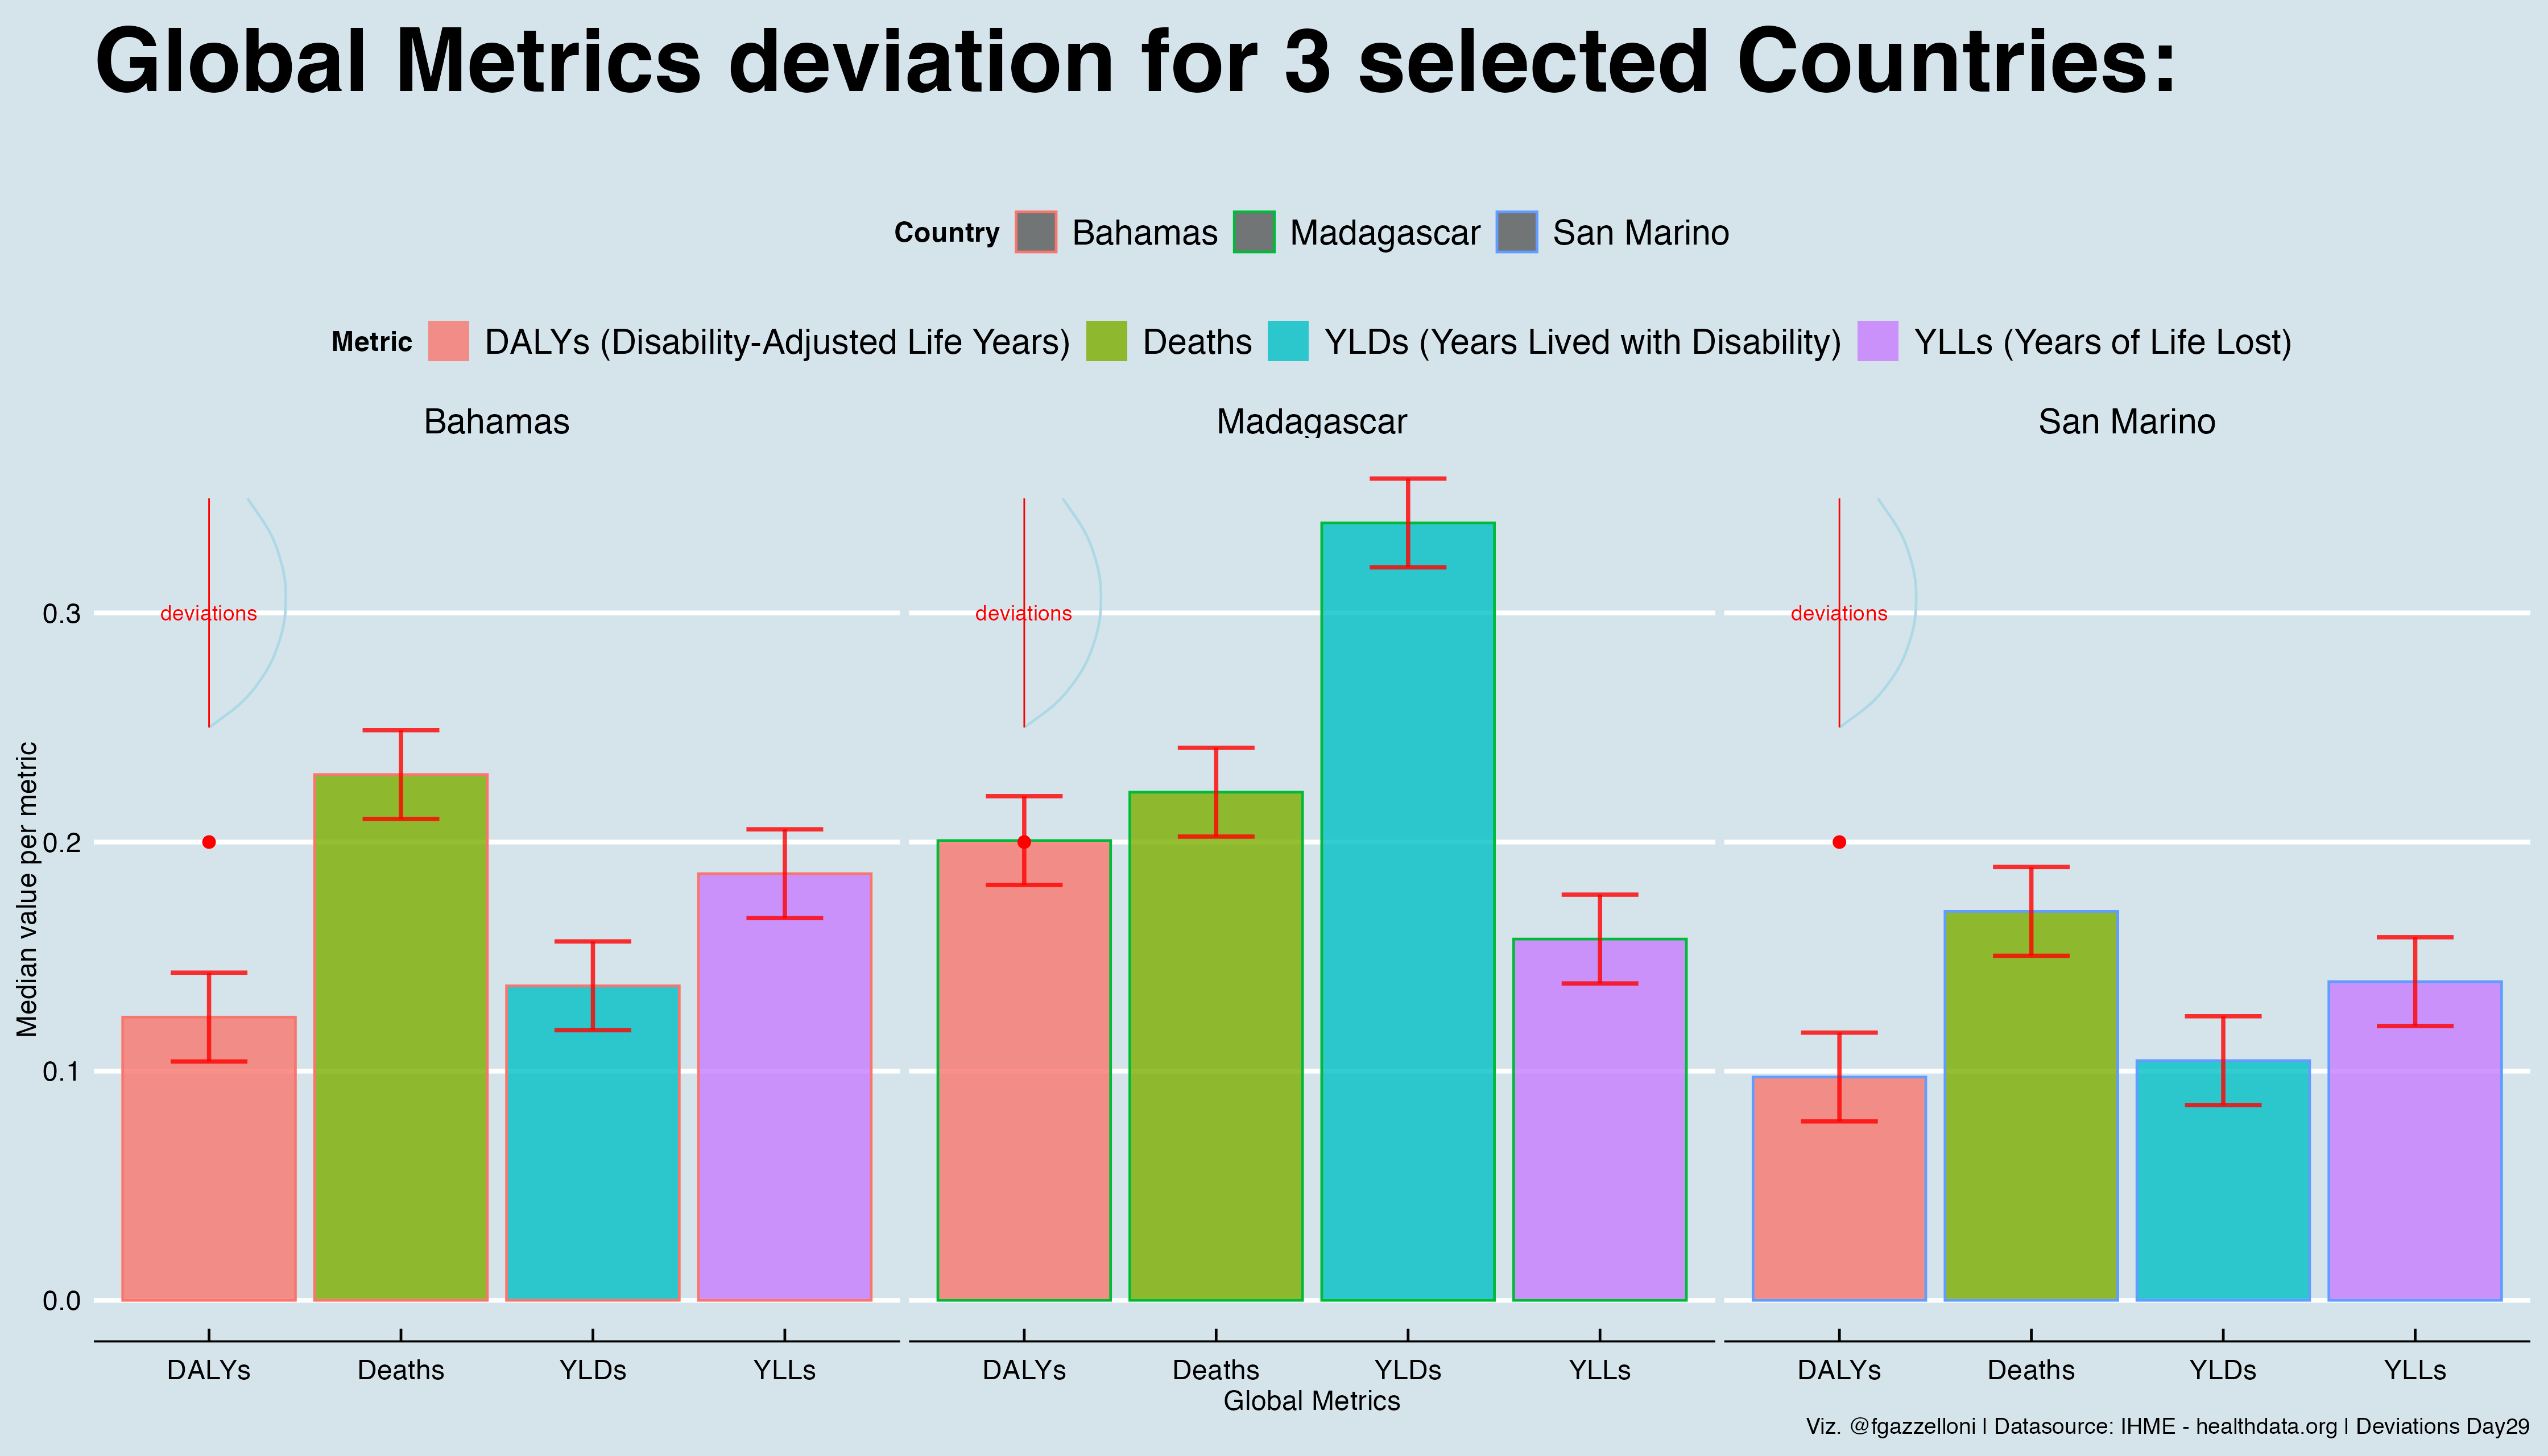
A comparison of global health metric deviations for three selected countries using IHME data.
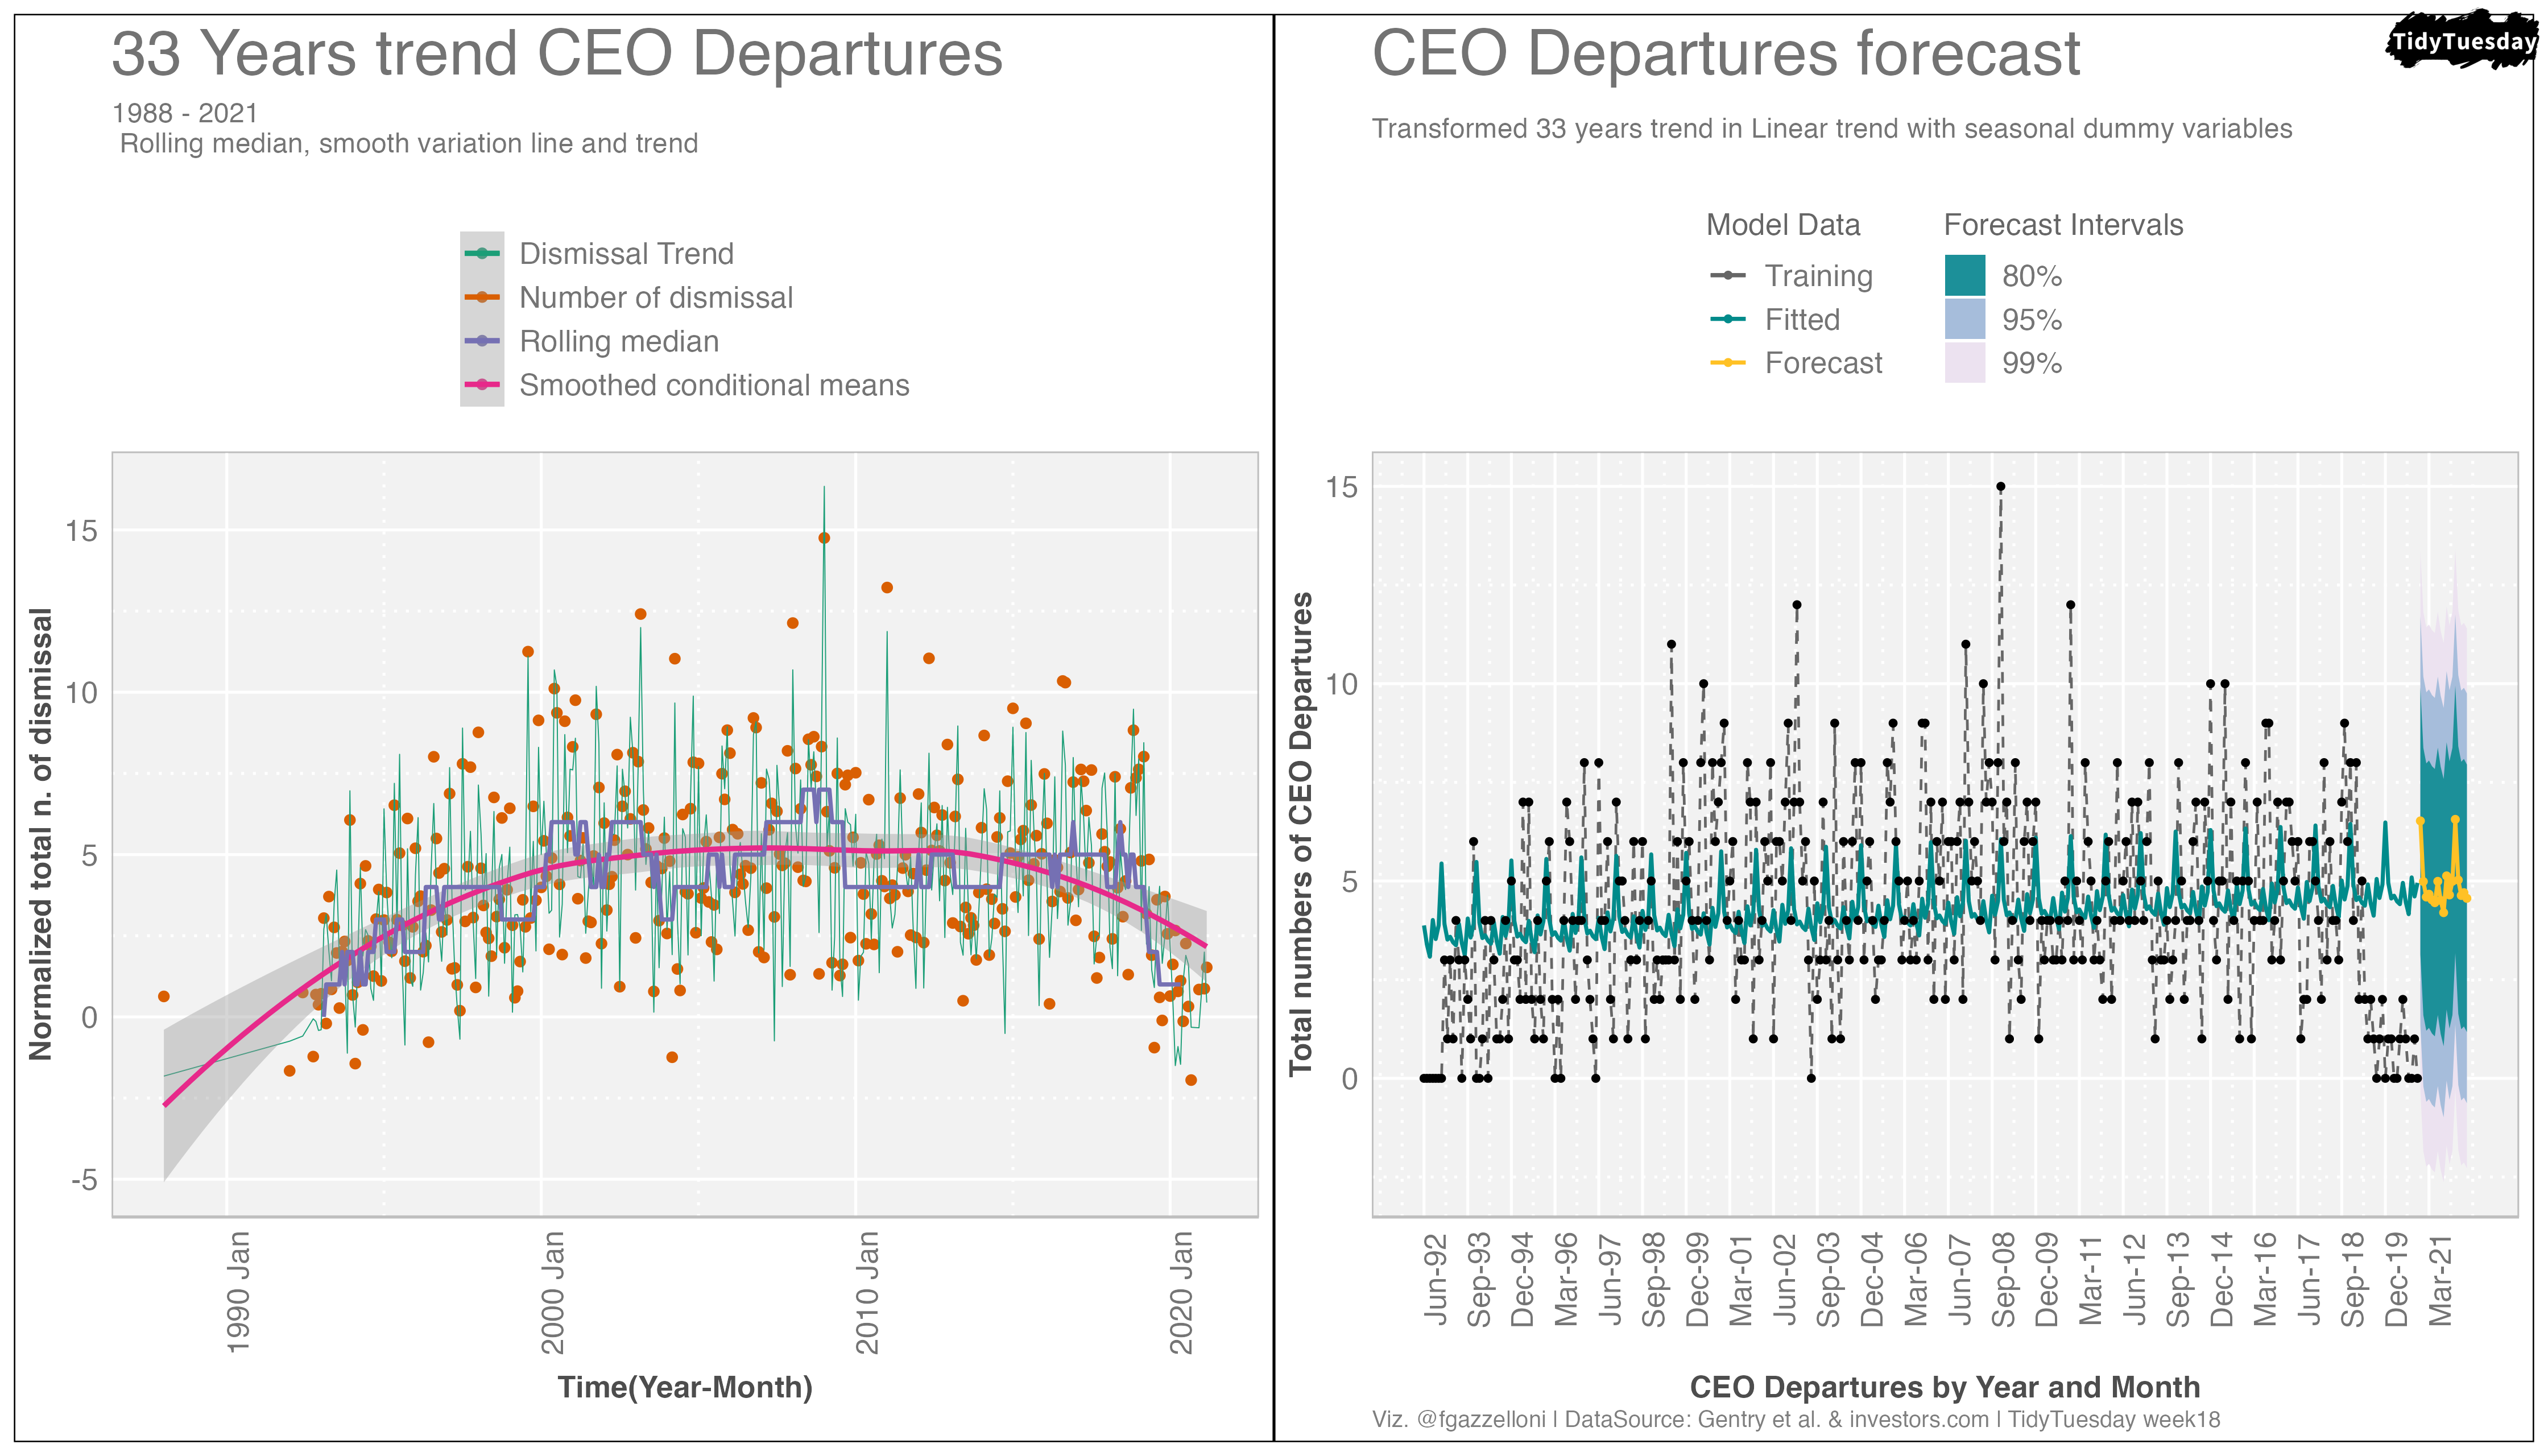
A time-series chart of CEO departures from 1988 to 2021, with a forecast of dismissal trends.
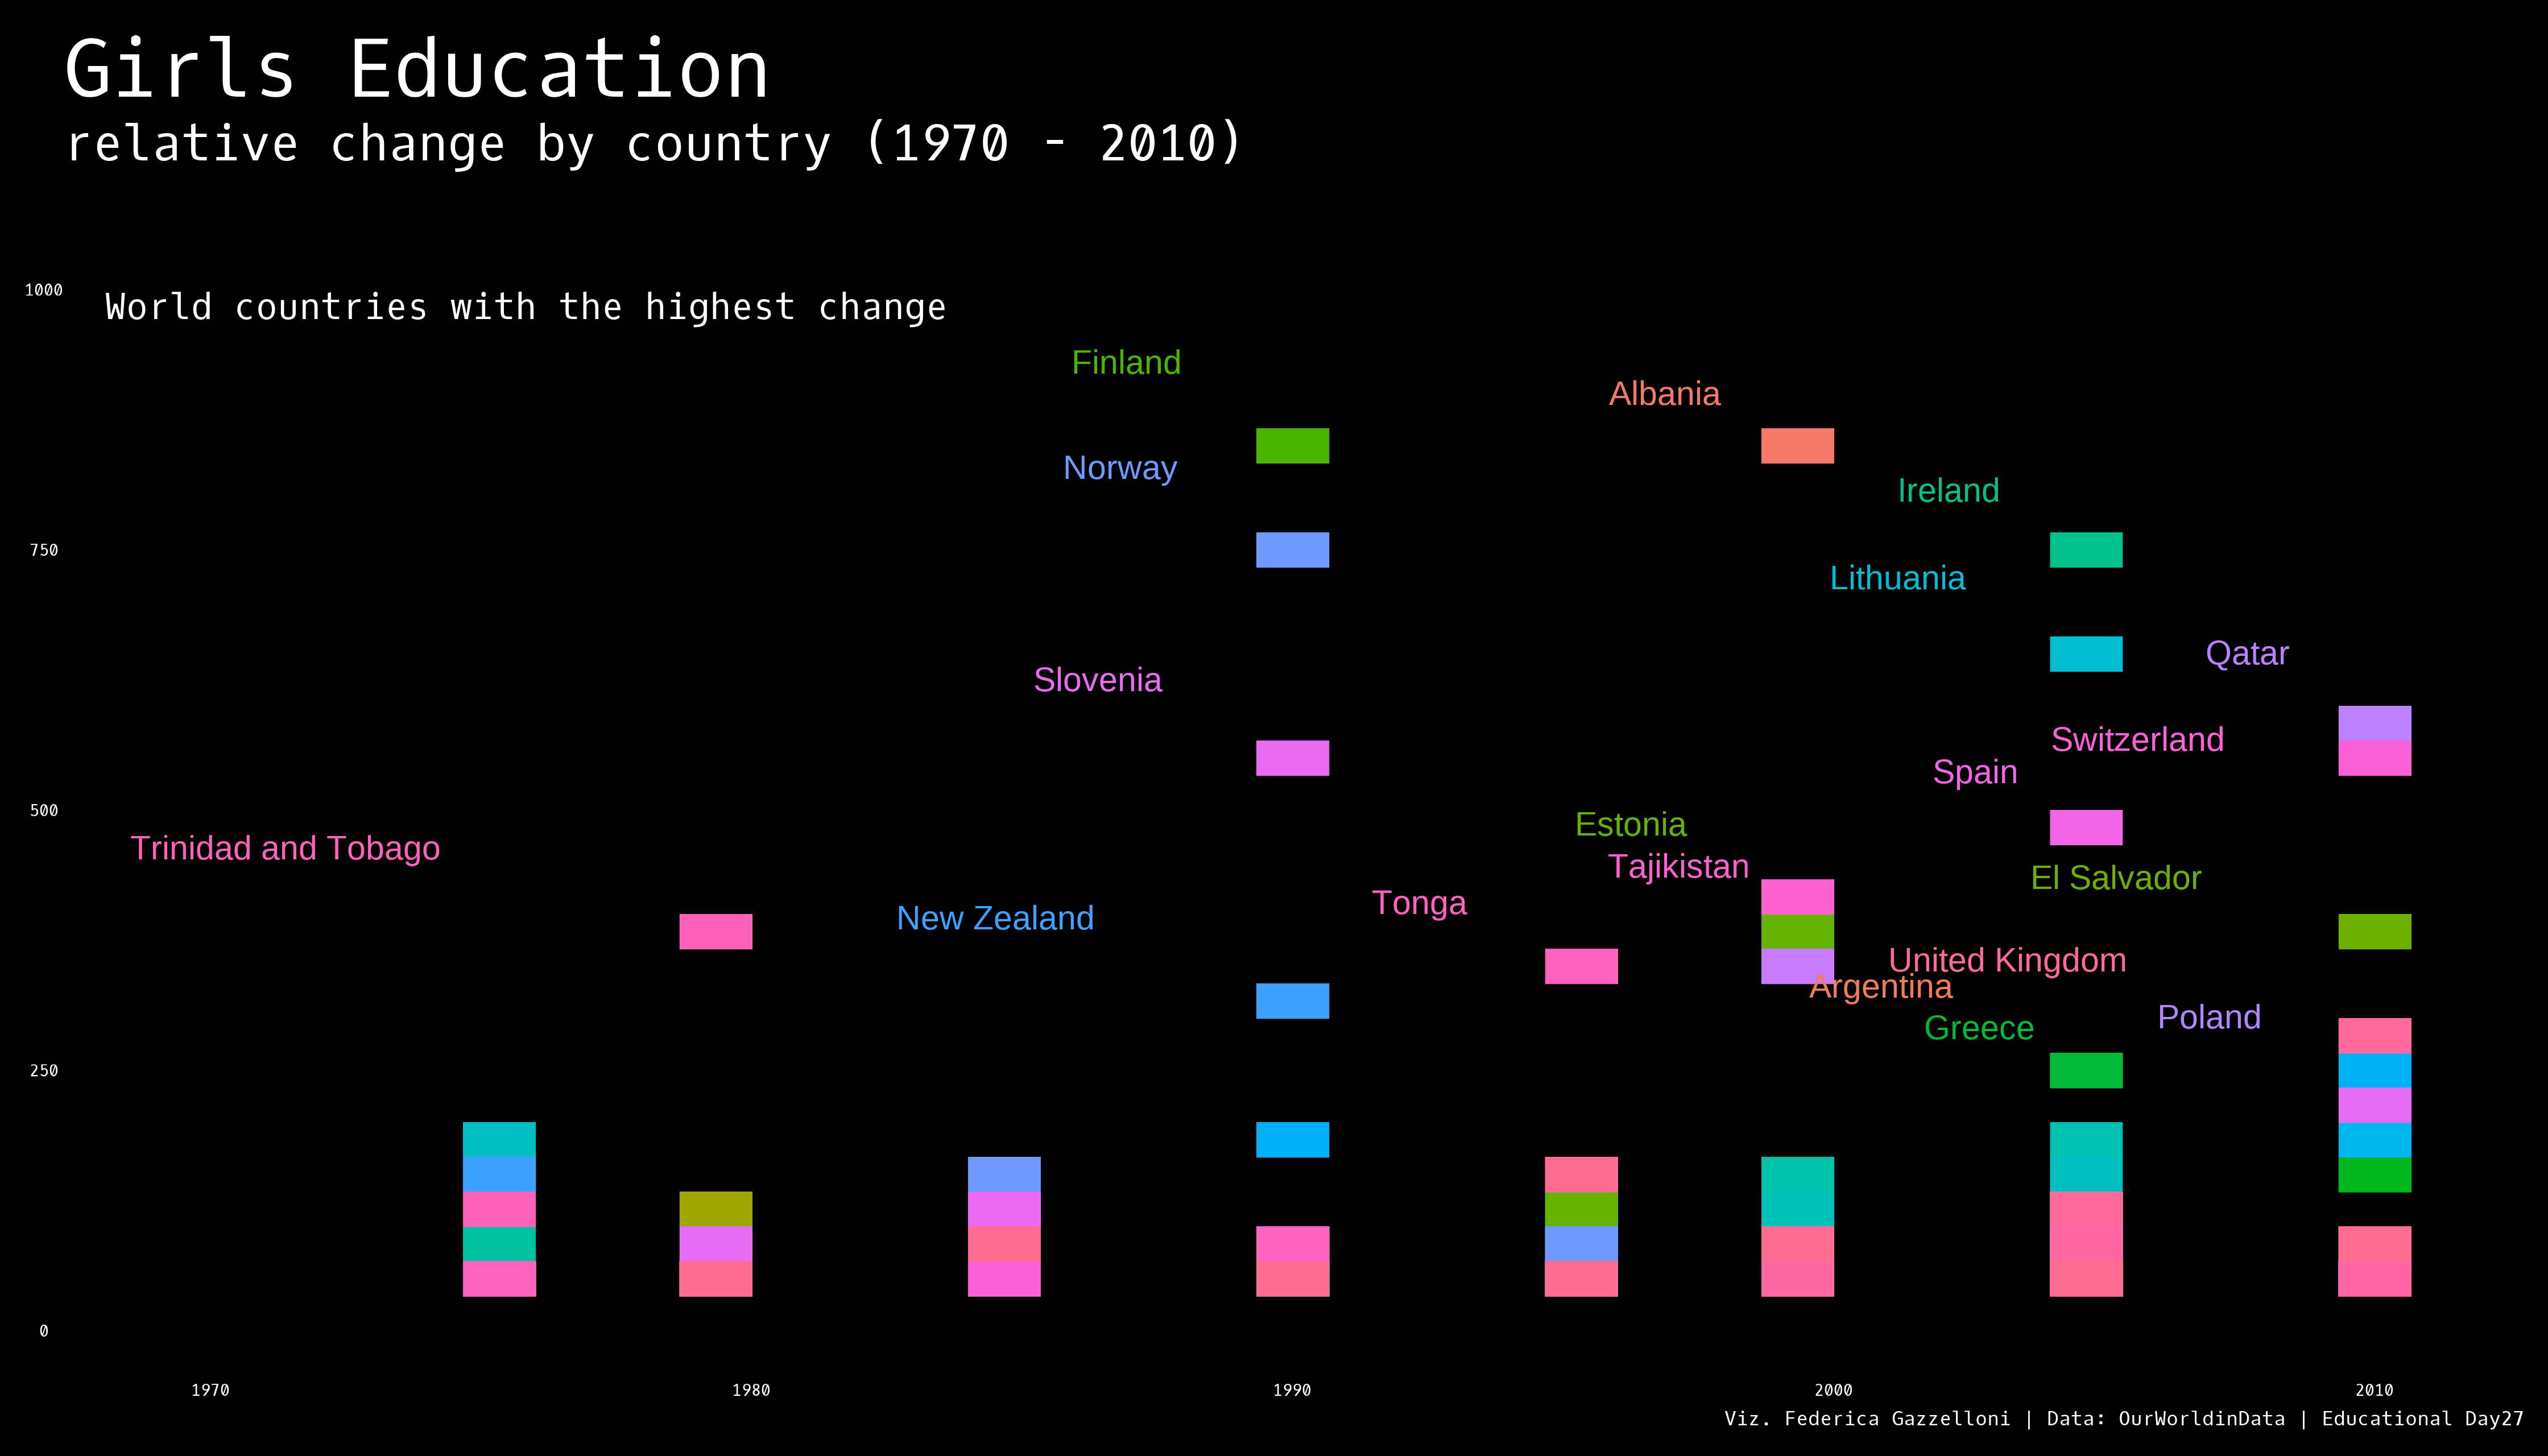
A country-level comparison of relative change in girls’ education between 1970 and 2010.
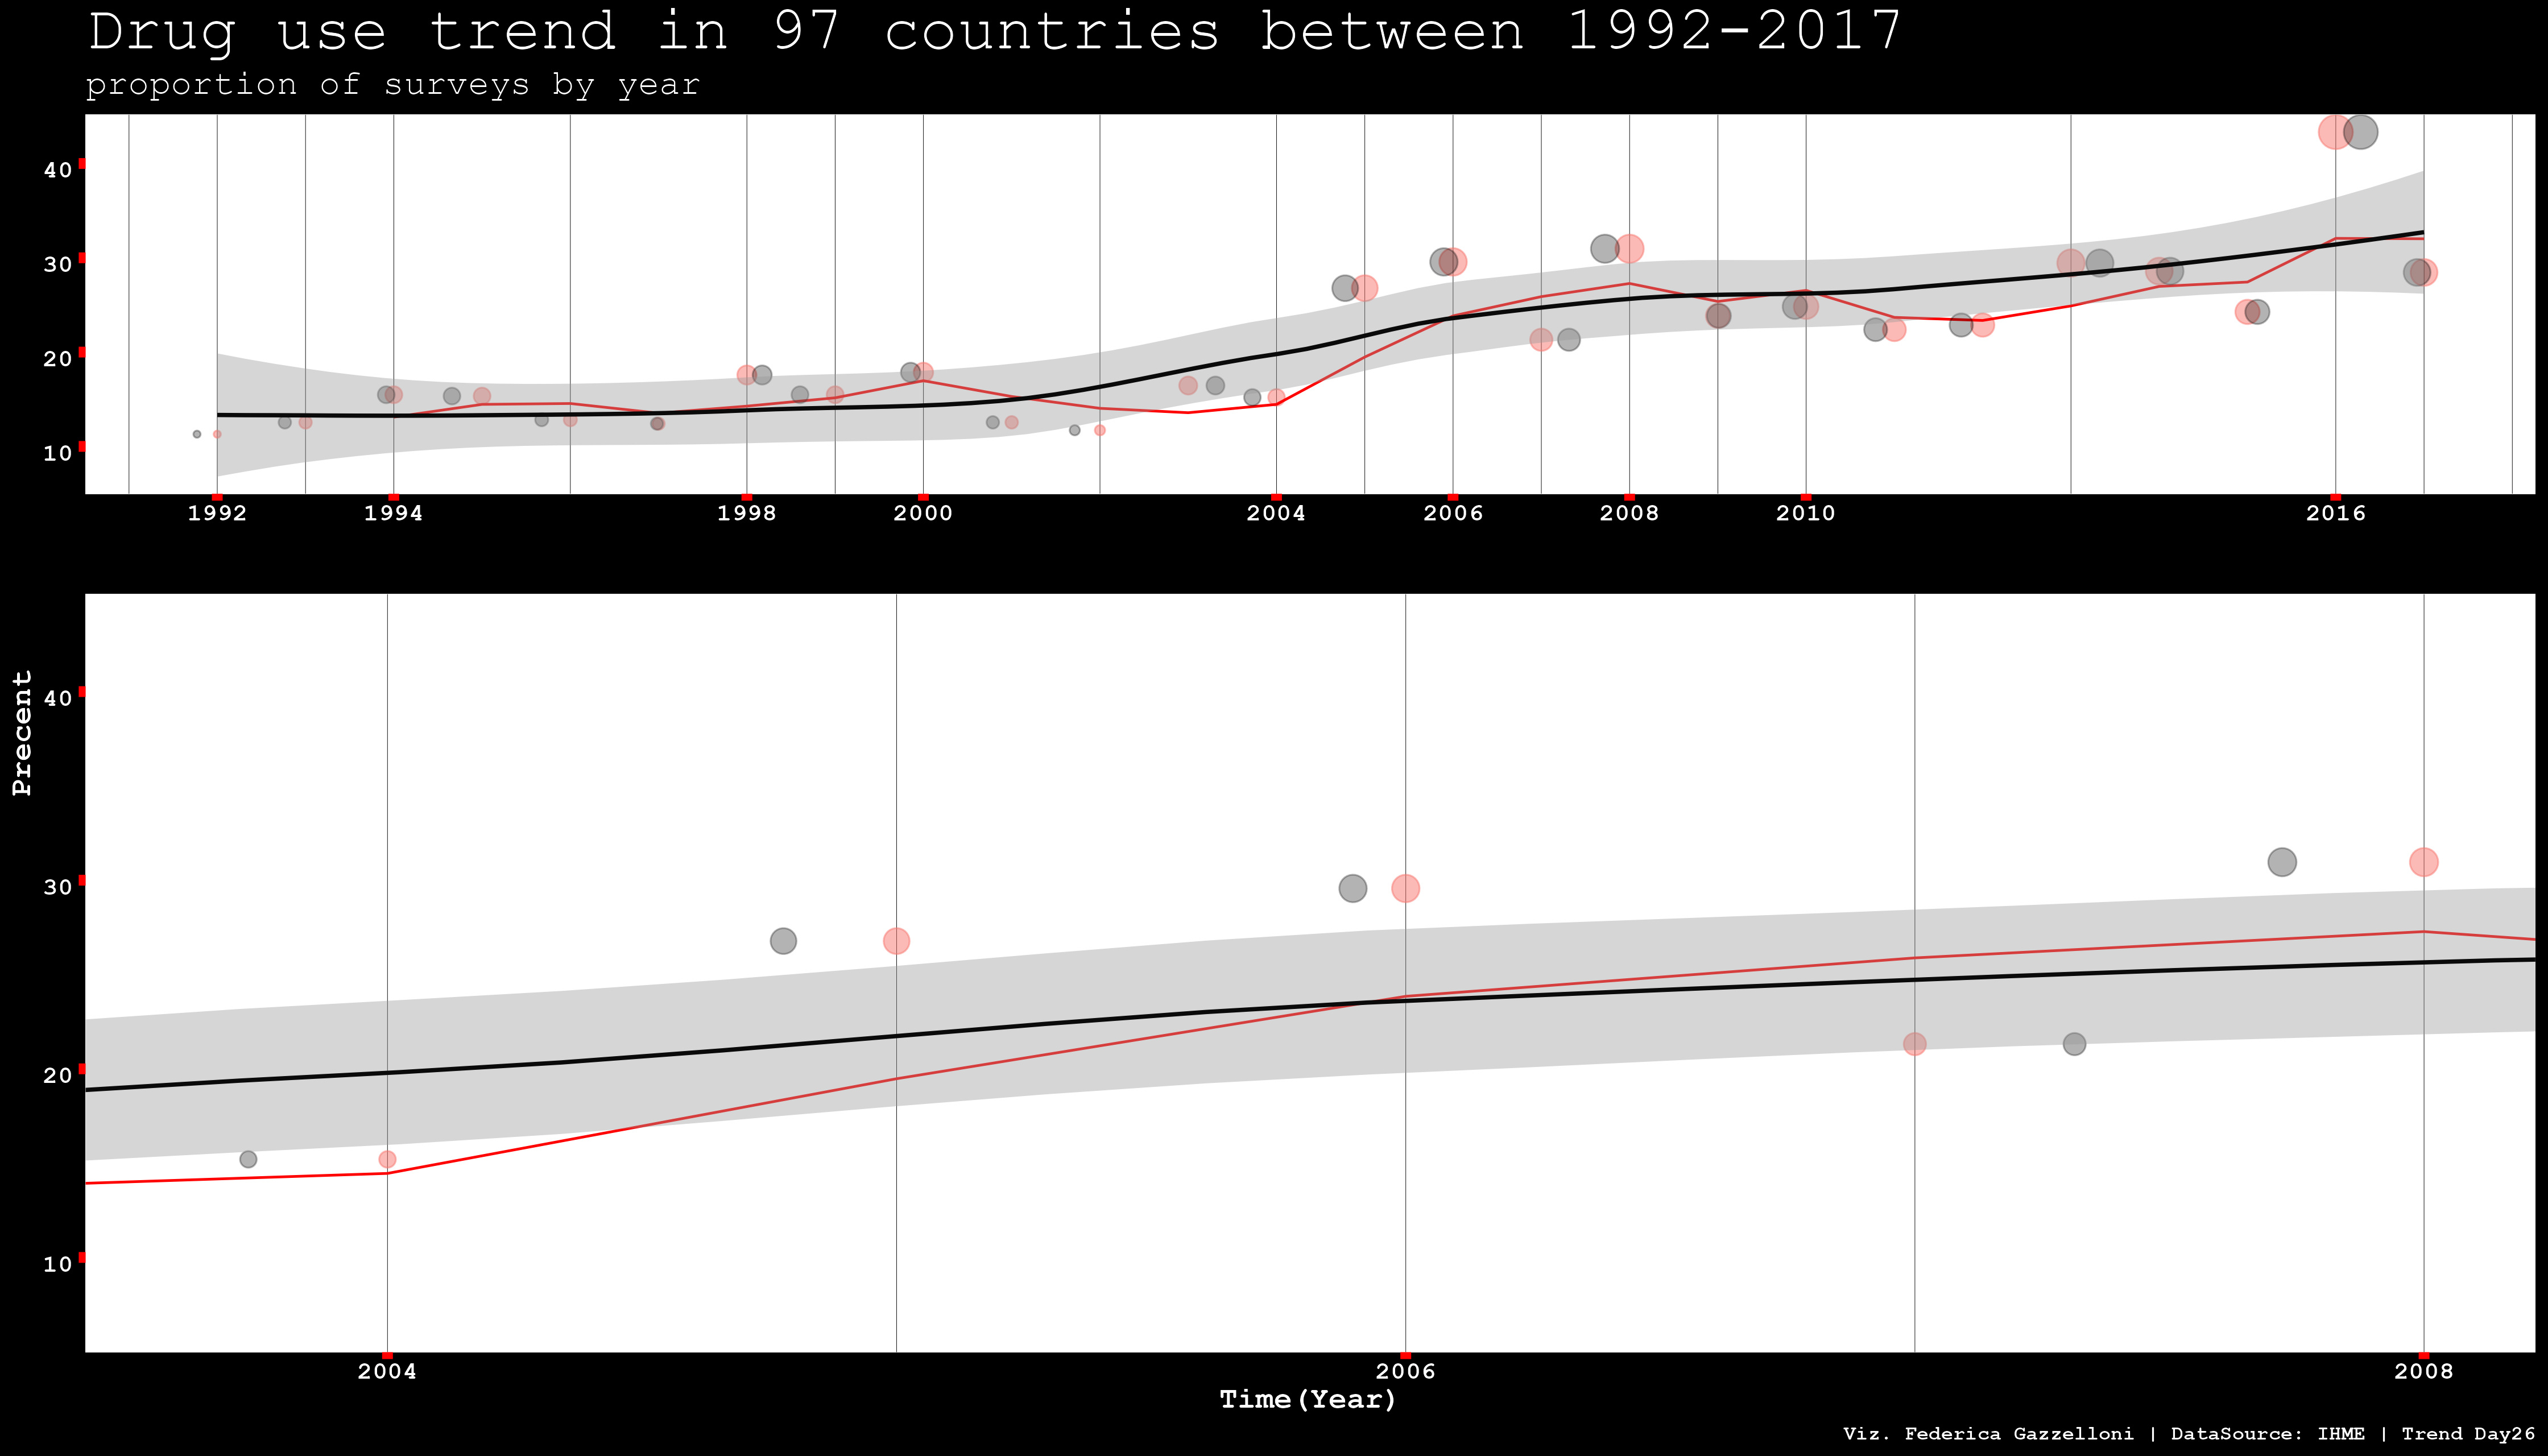
A trend chart of drug-use surveys across 97 countries from 1992 to 2017.
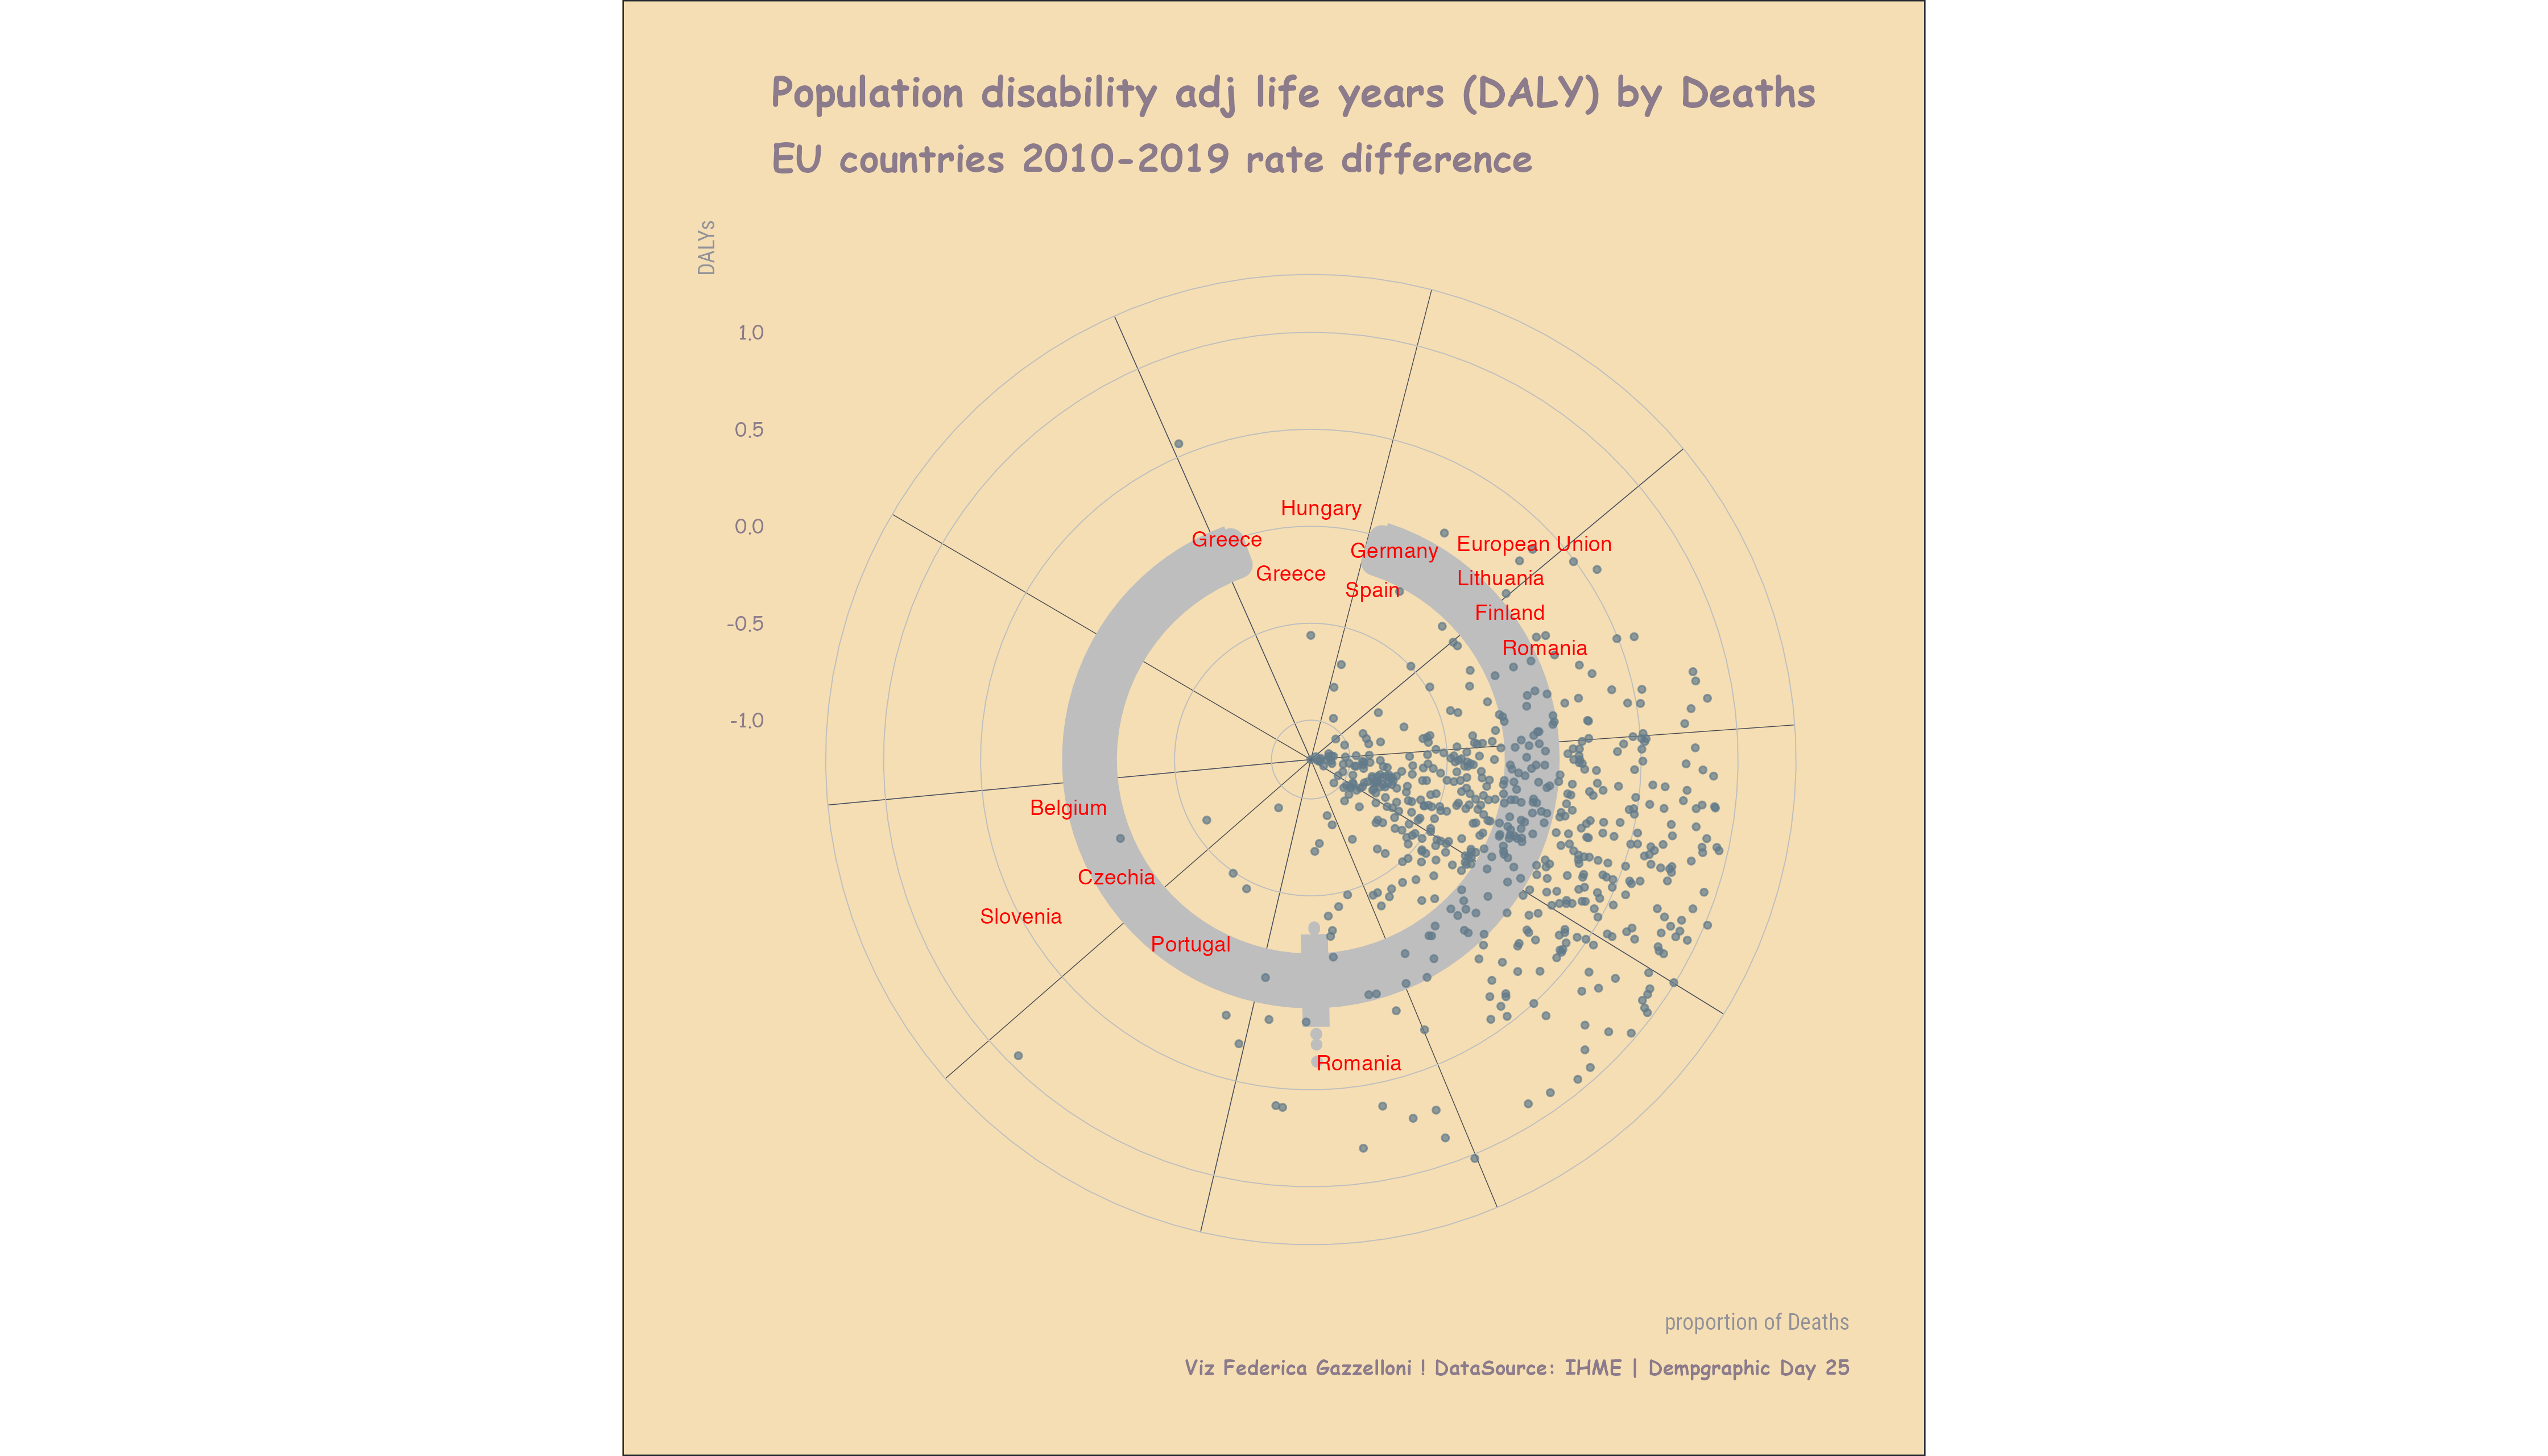
An animated view of European Union population change from 2010 to 2019 using IHME demographic data.
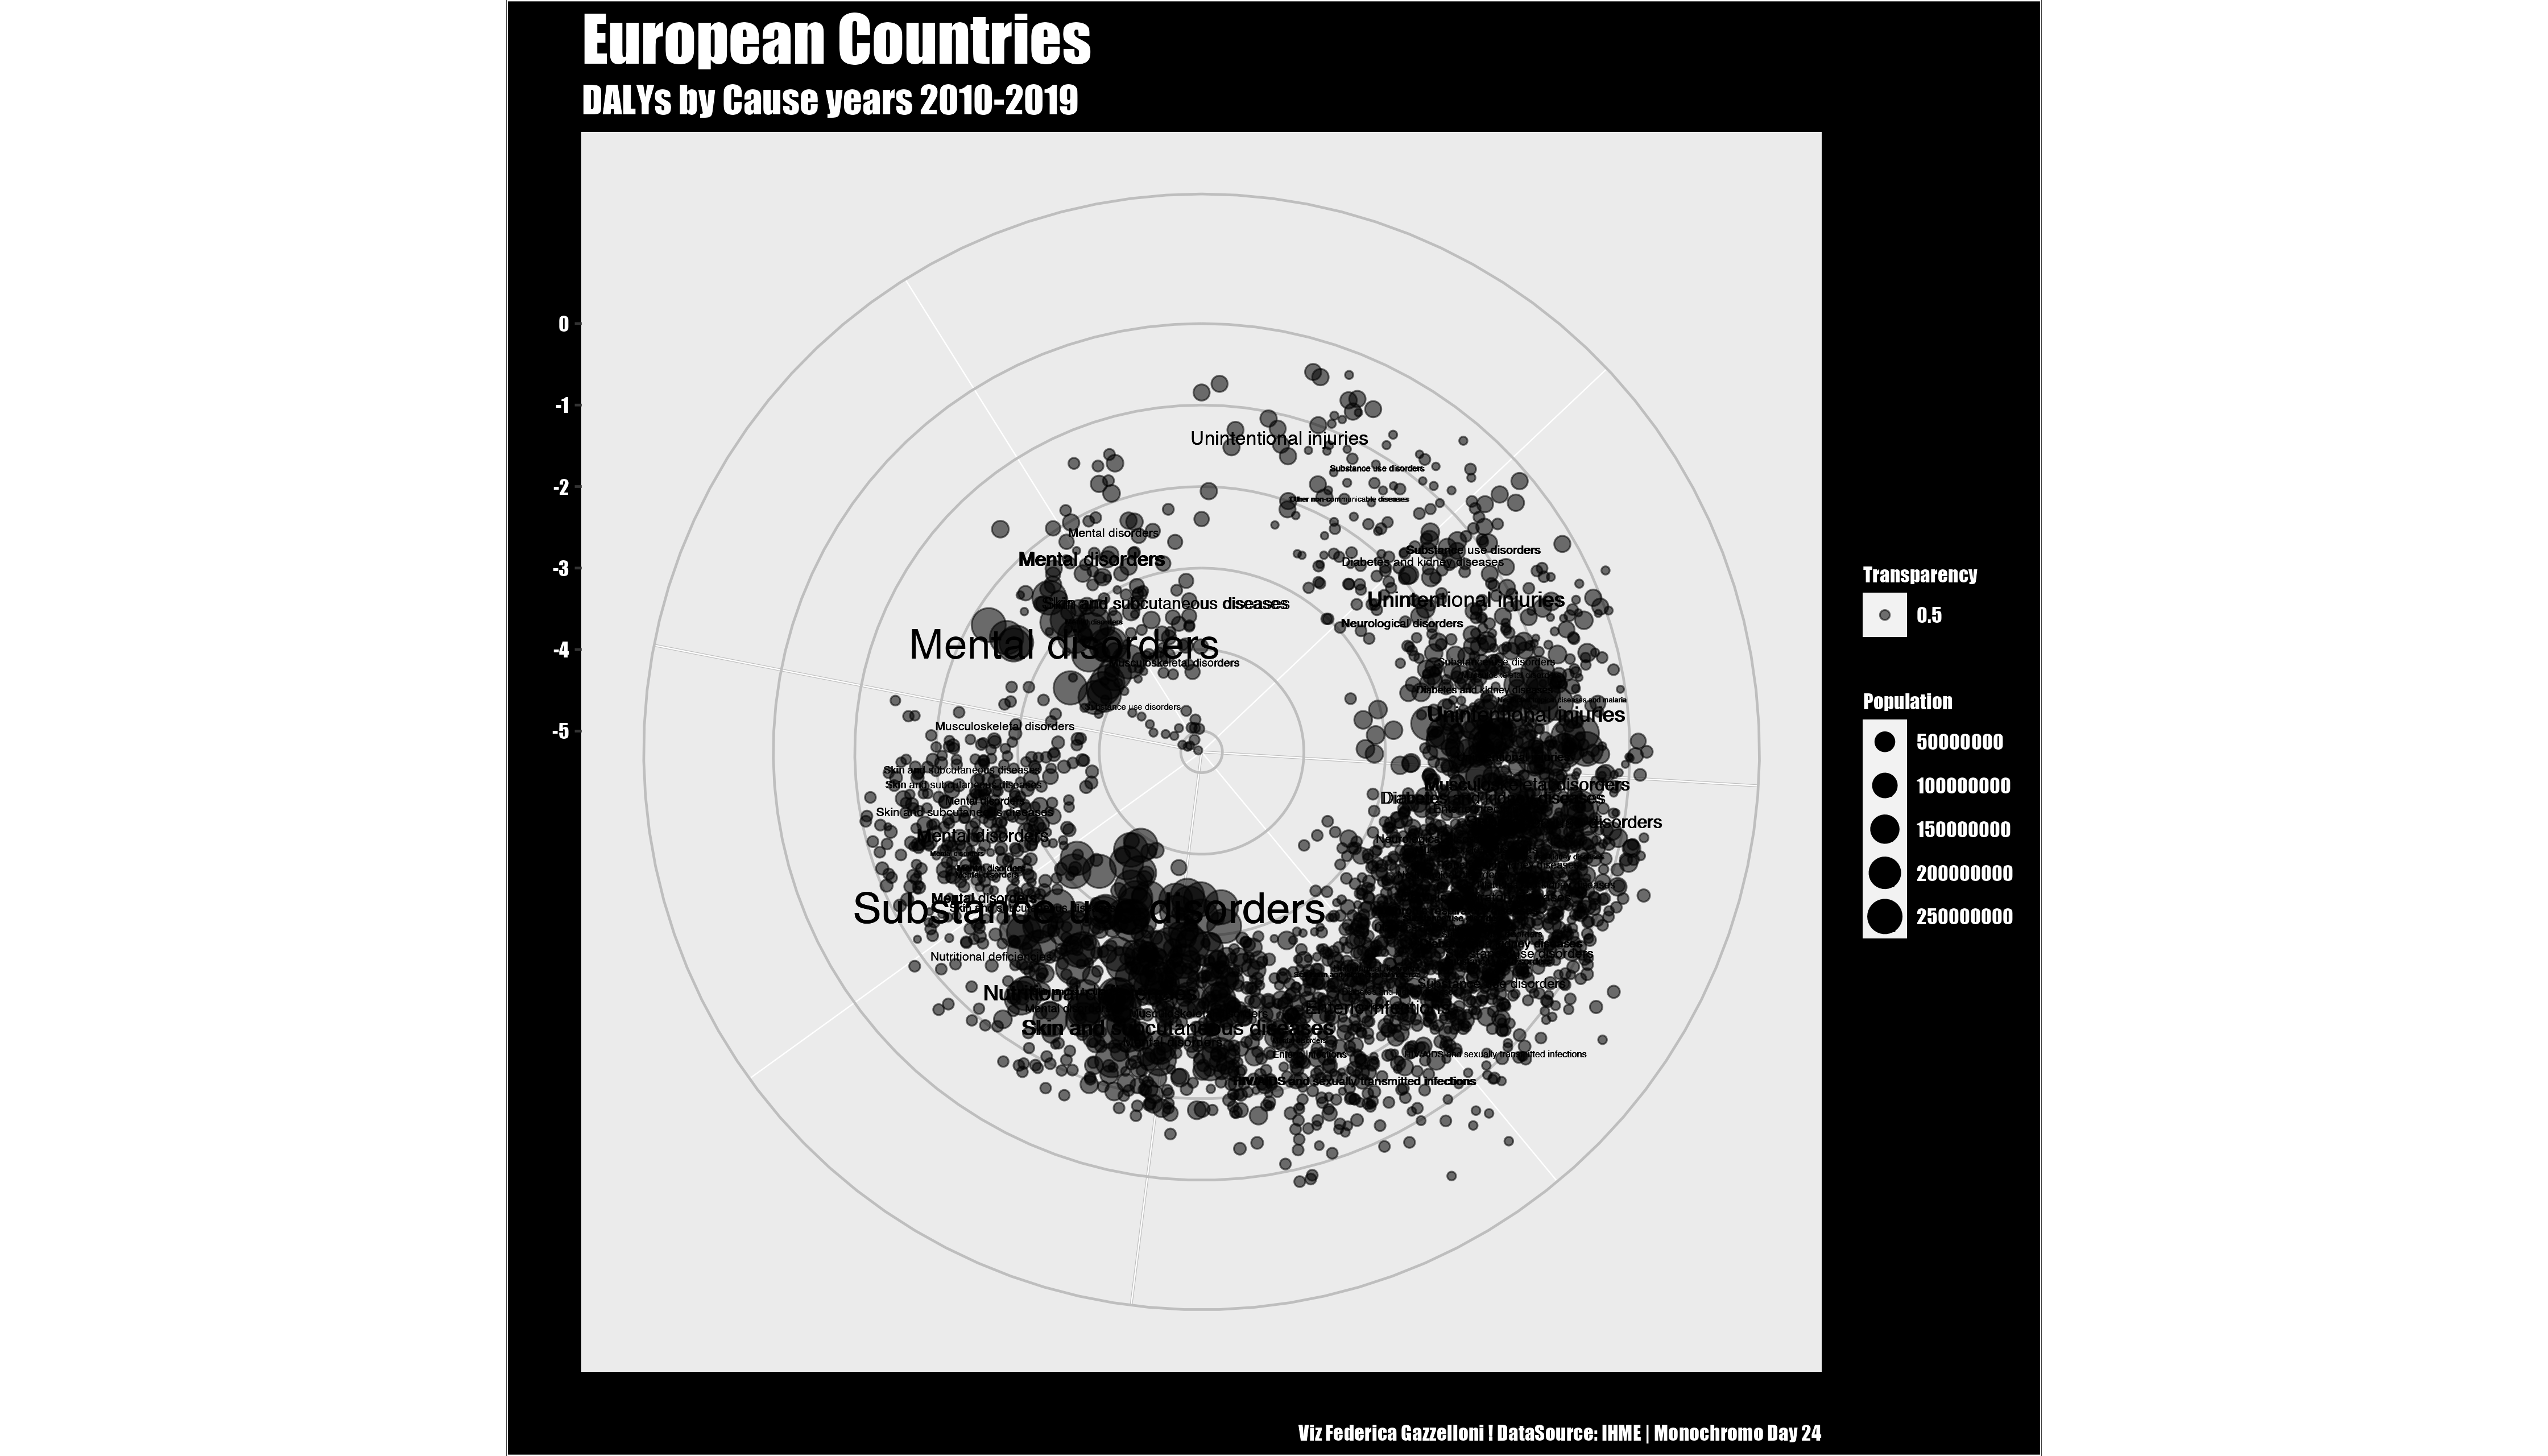
A monochrome comparison of disability-adjusted life years by cause across European countries from 2010 to 2019.
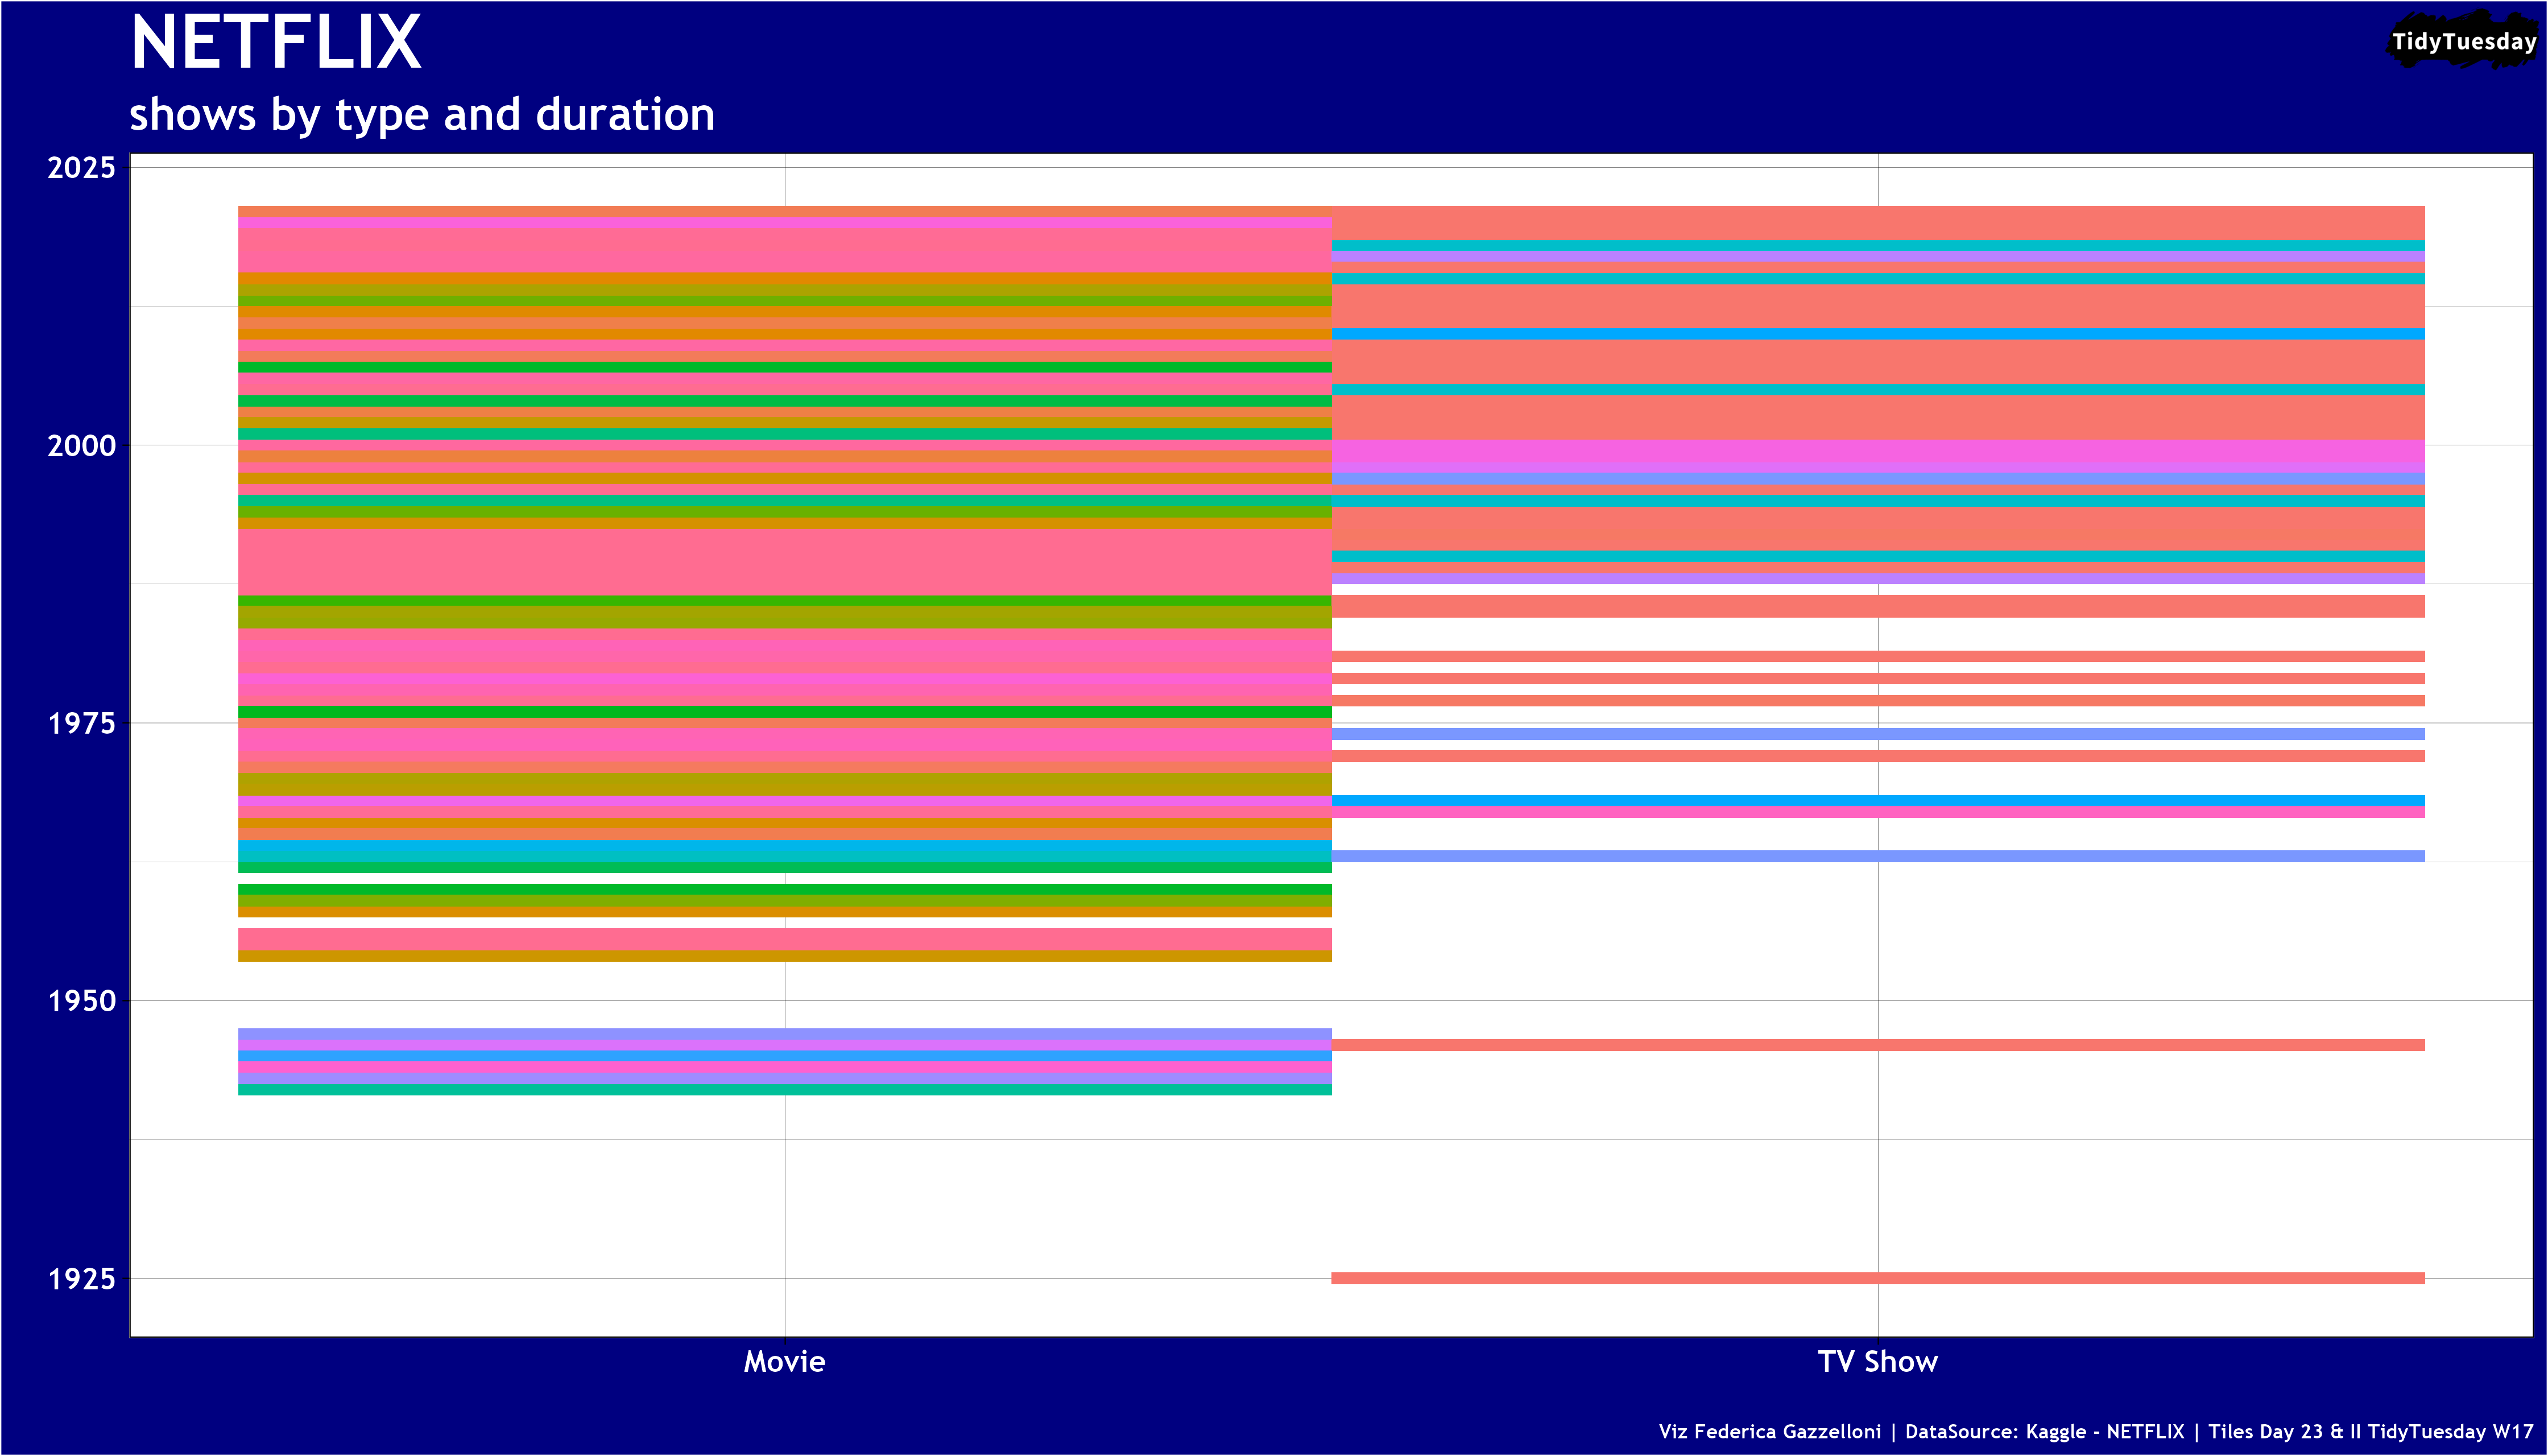
A tiled comparison of Netflix shows by format and duration using the Netflix titles dataset.
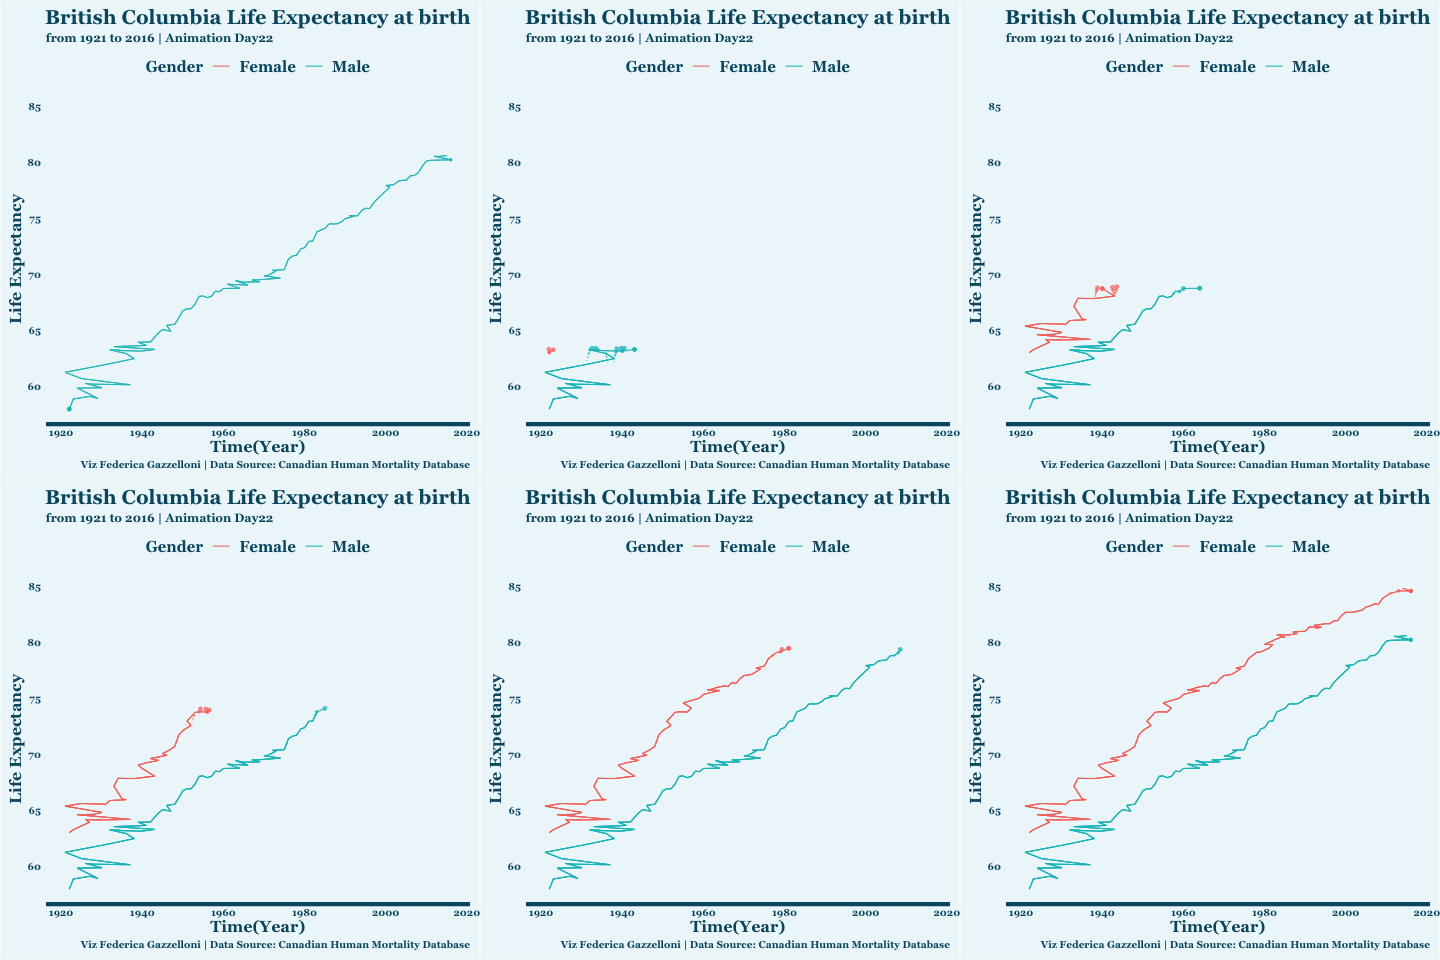
An animation of life expectancy at birth in British Columbia from 1921 to 2016.
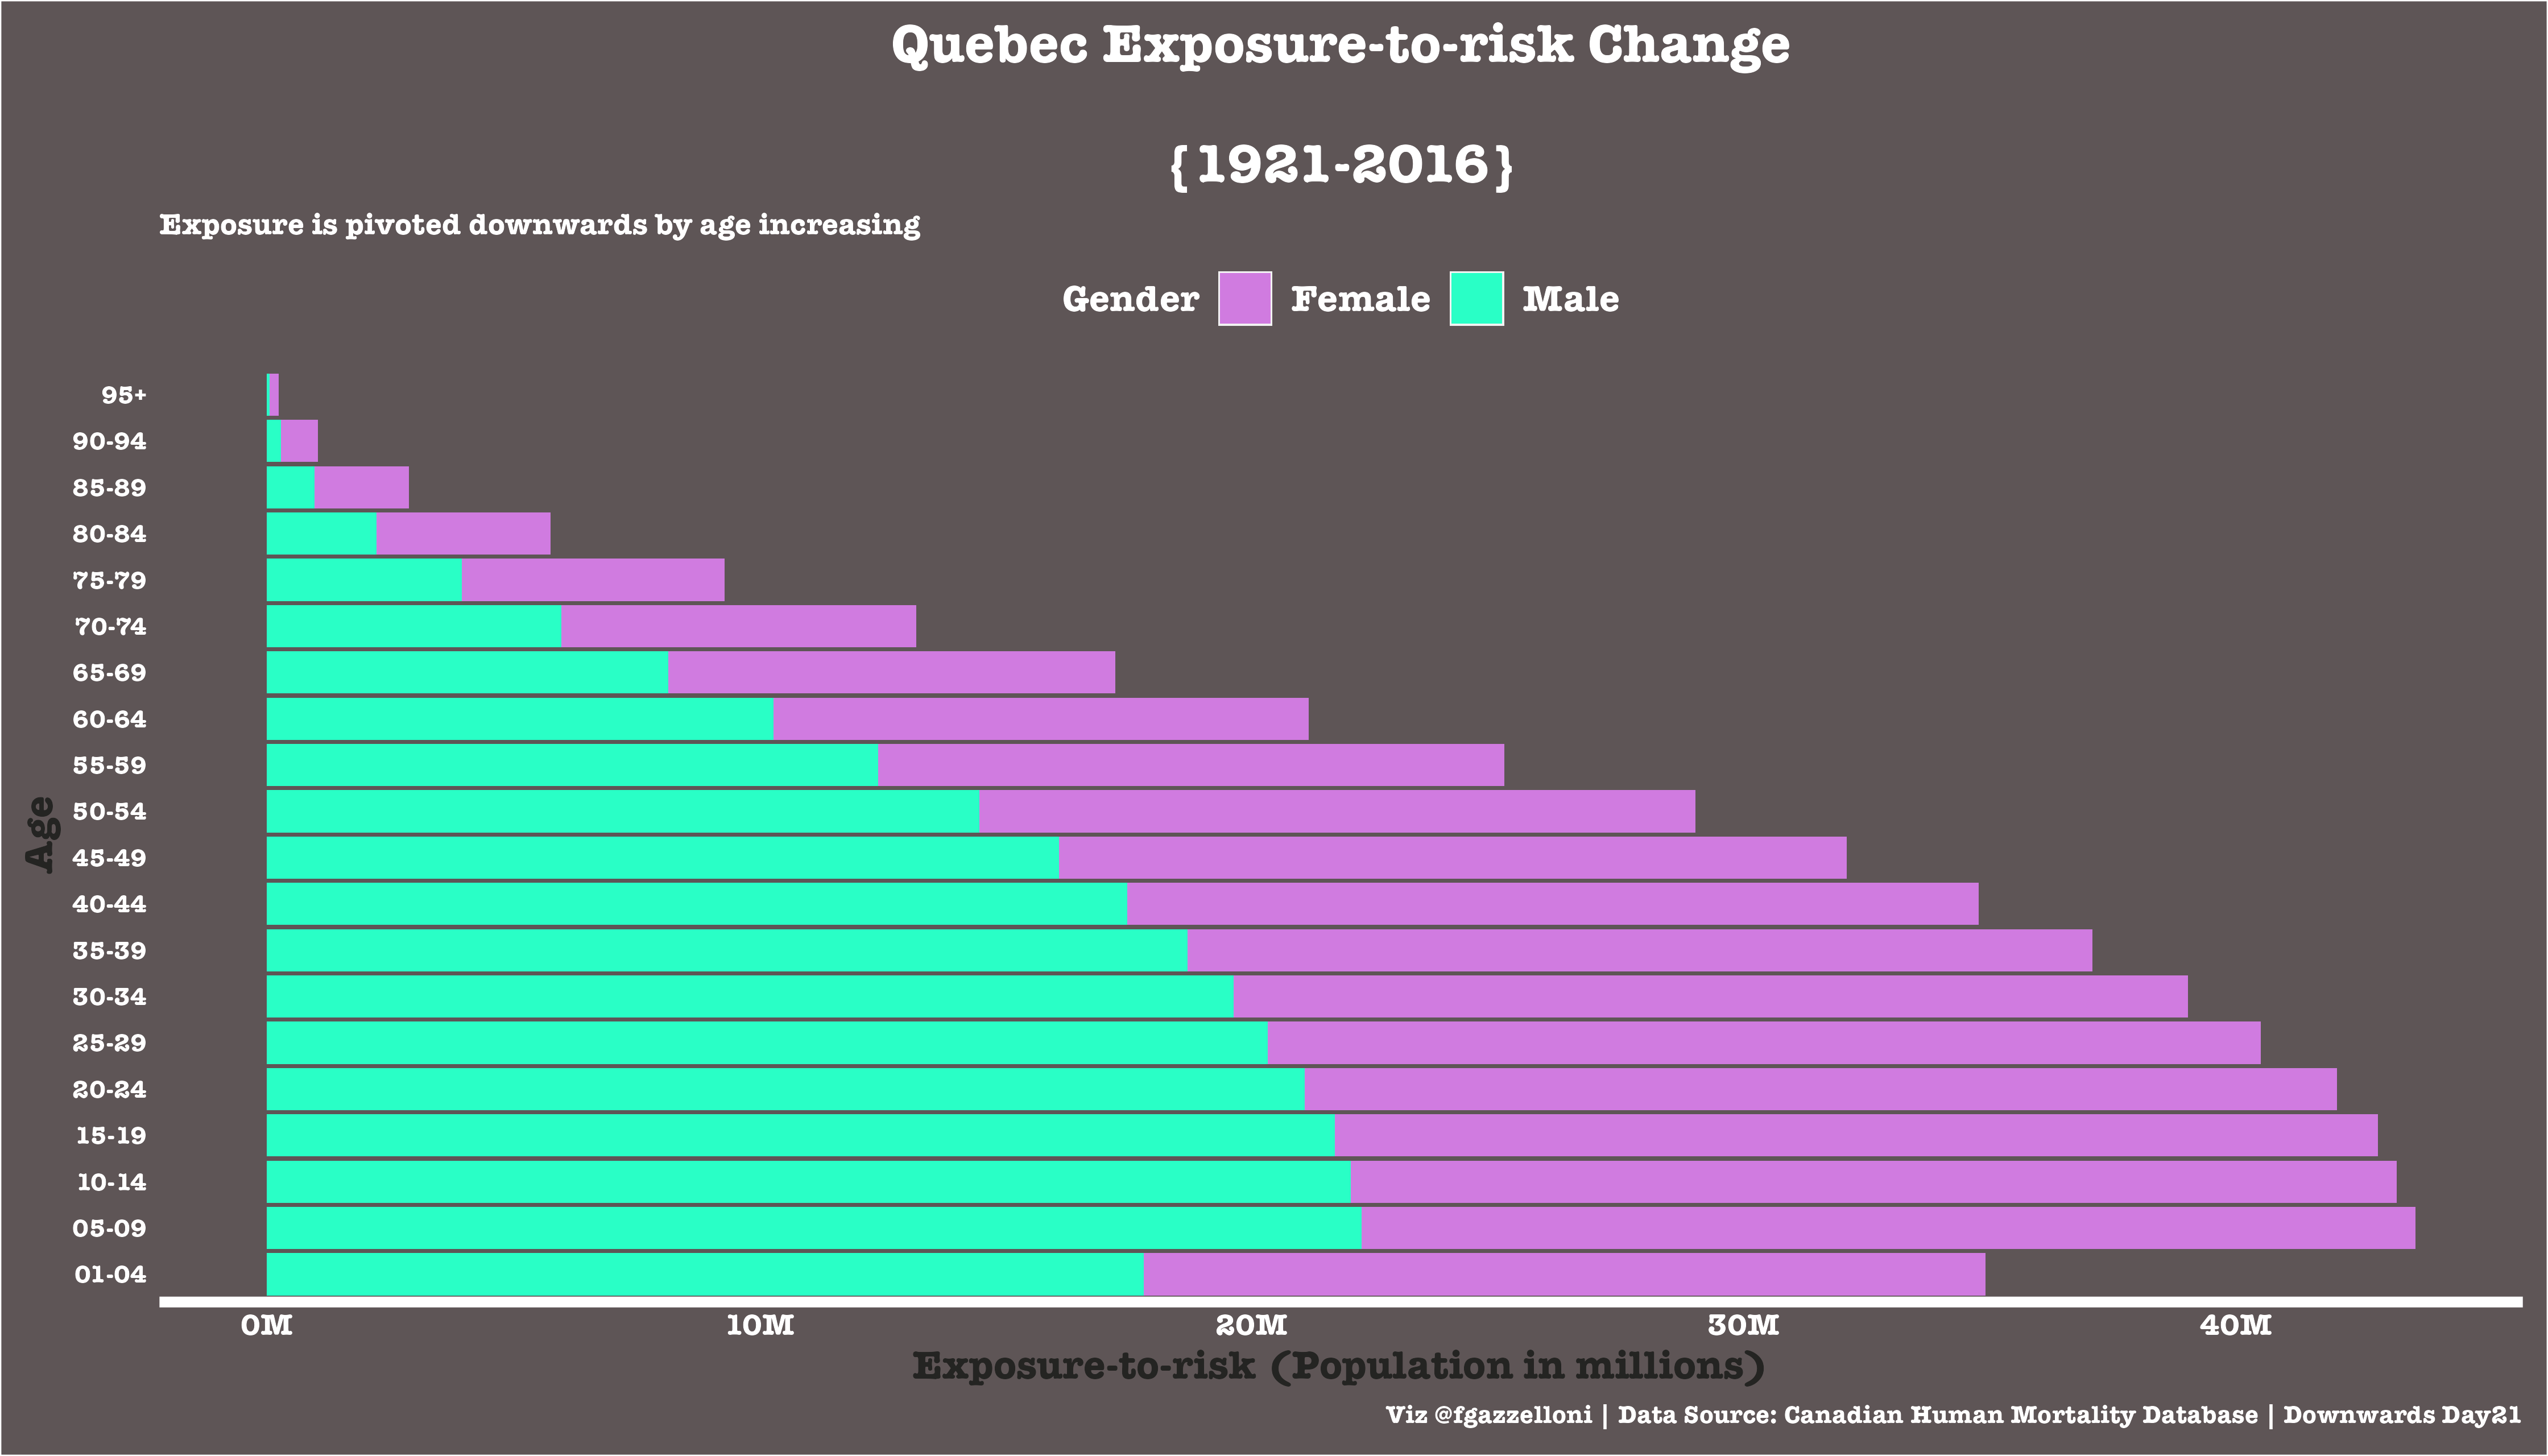
A flipped bar chart comparing Quebec exposure-to-risk by age and sex from 1921 to 2016.
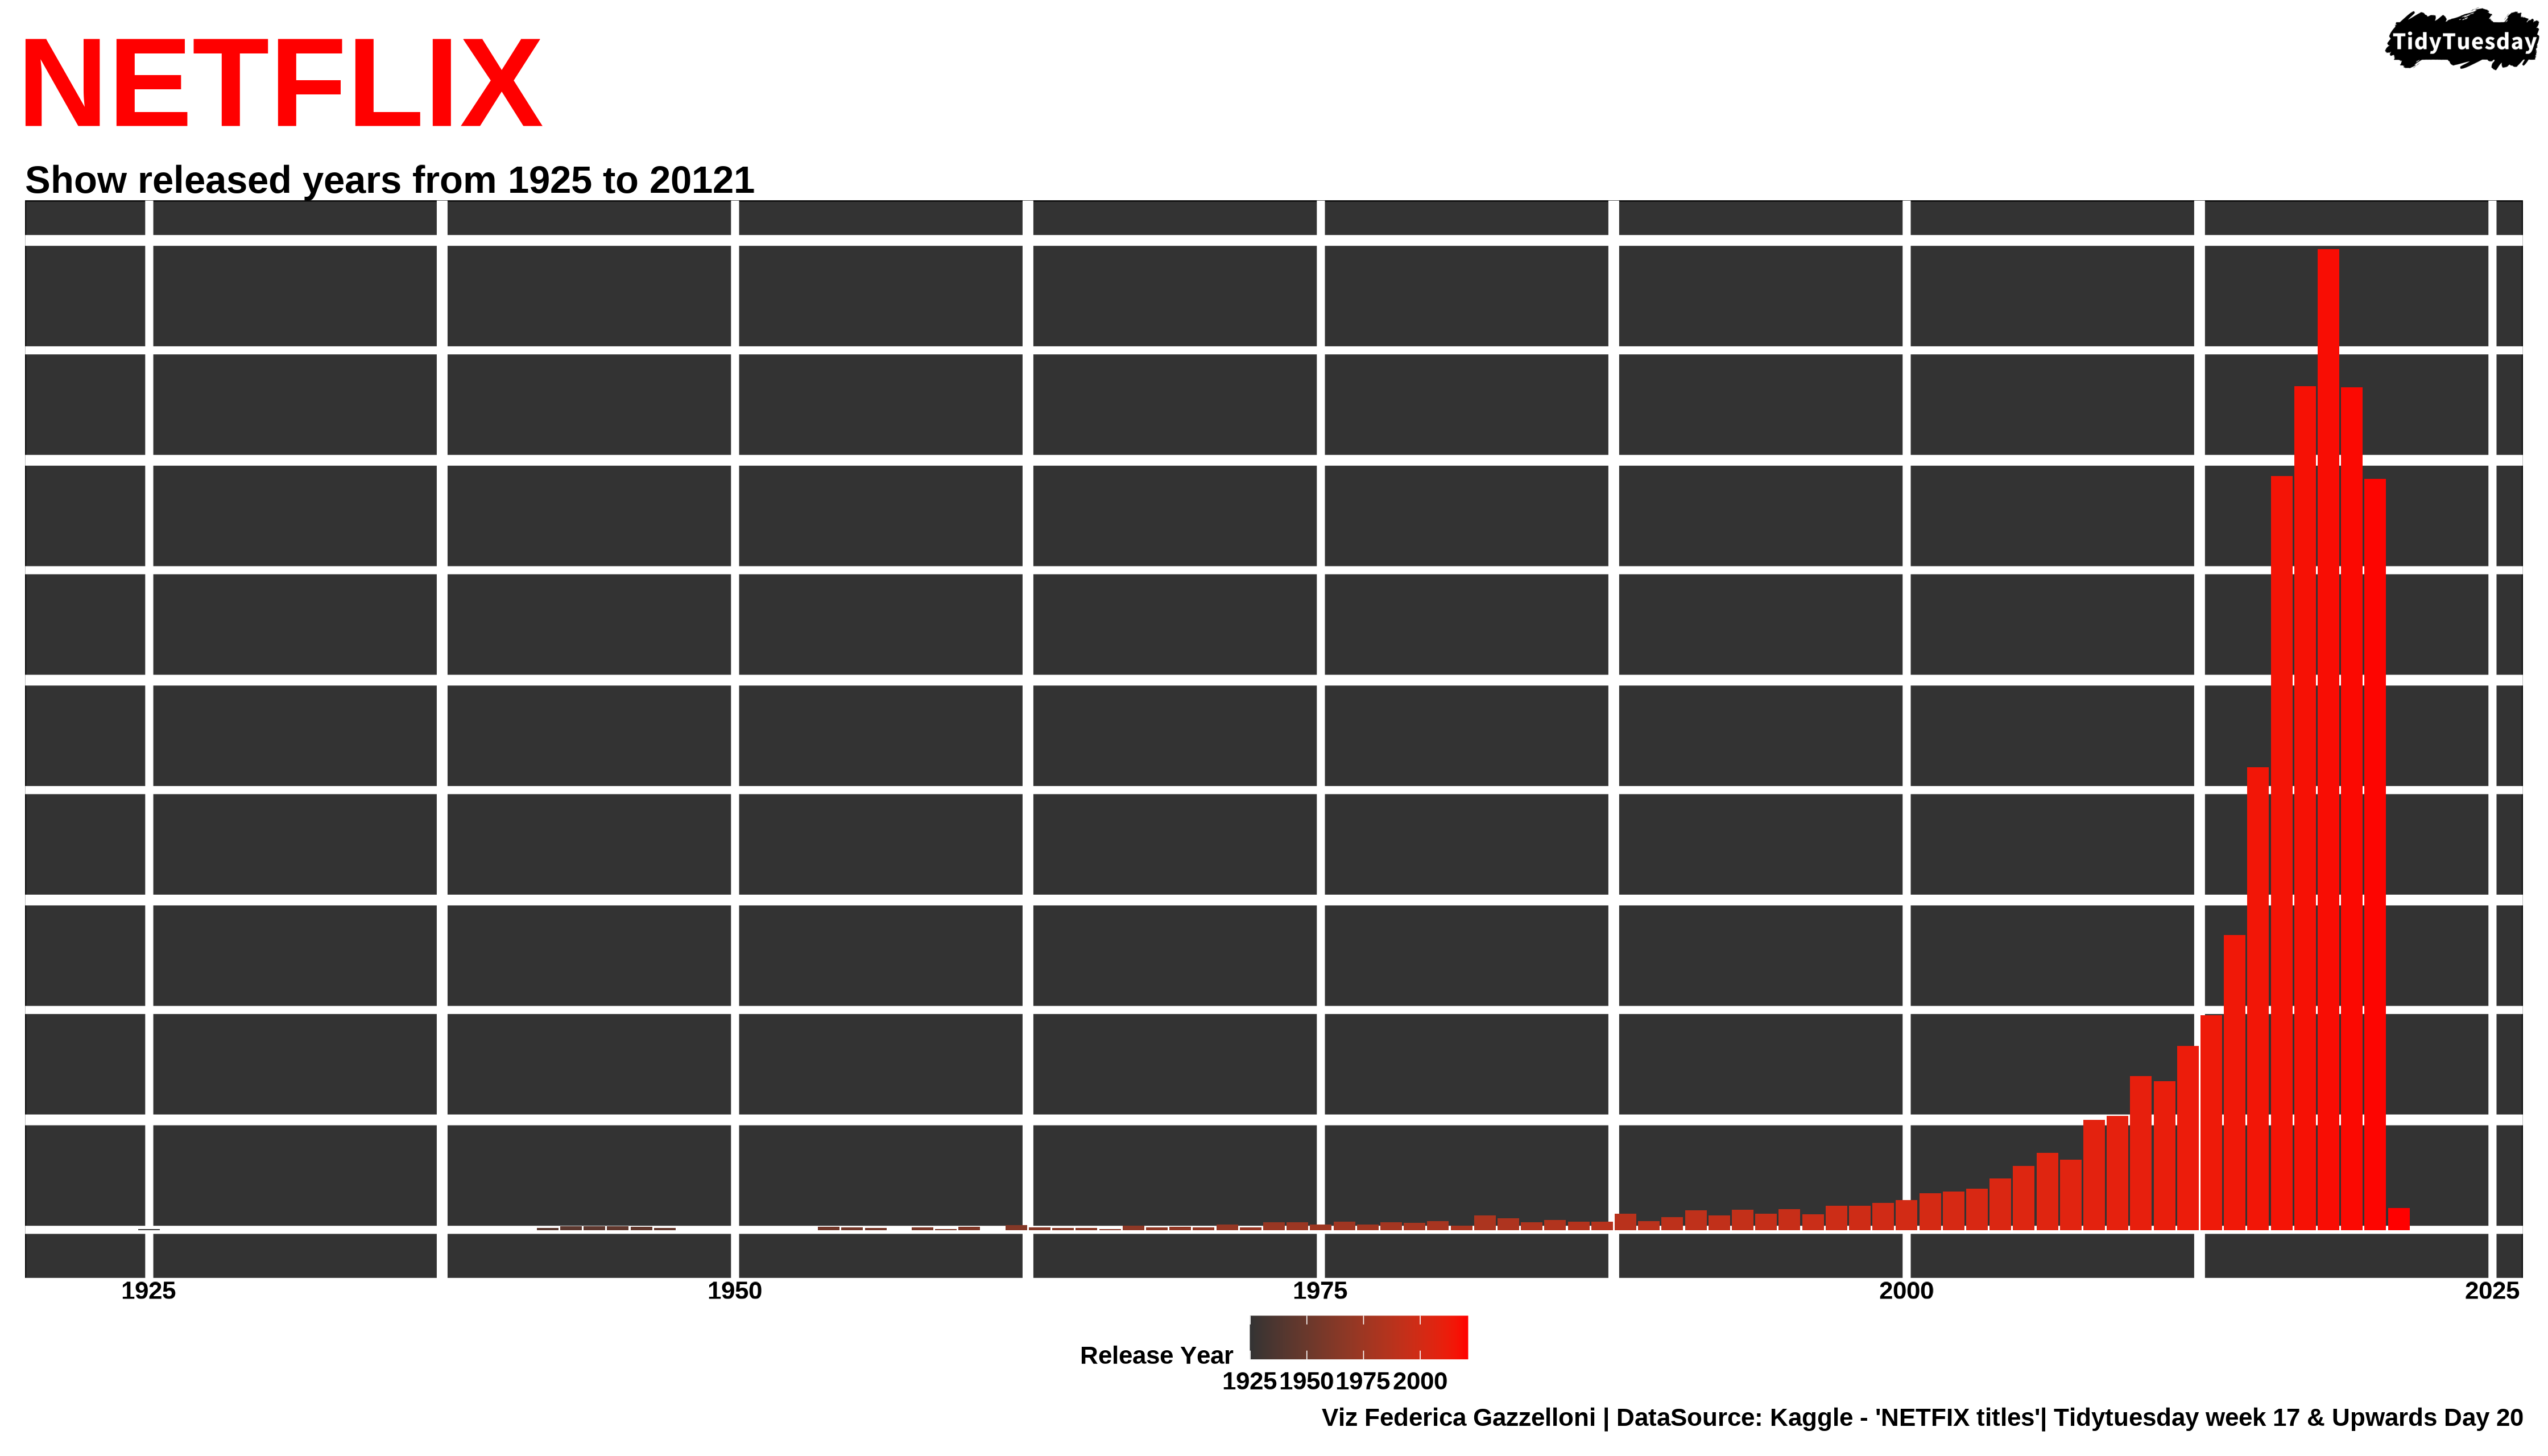
A timeline of Netflix titles by release year, showing the growth of the catalog from 1925 onward.
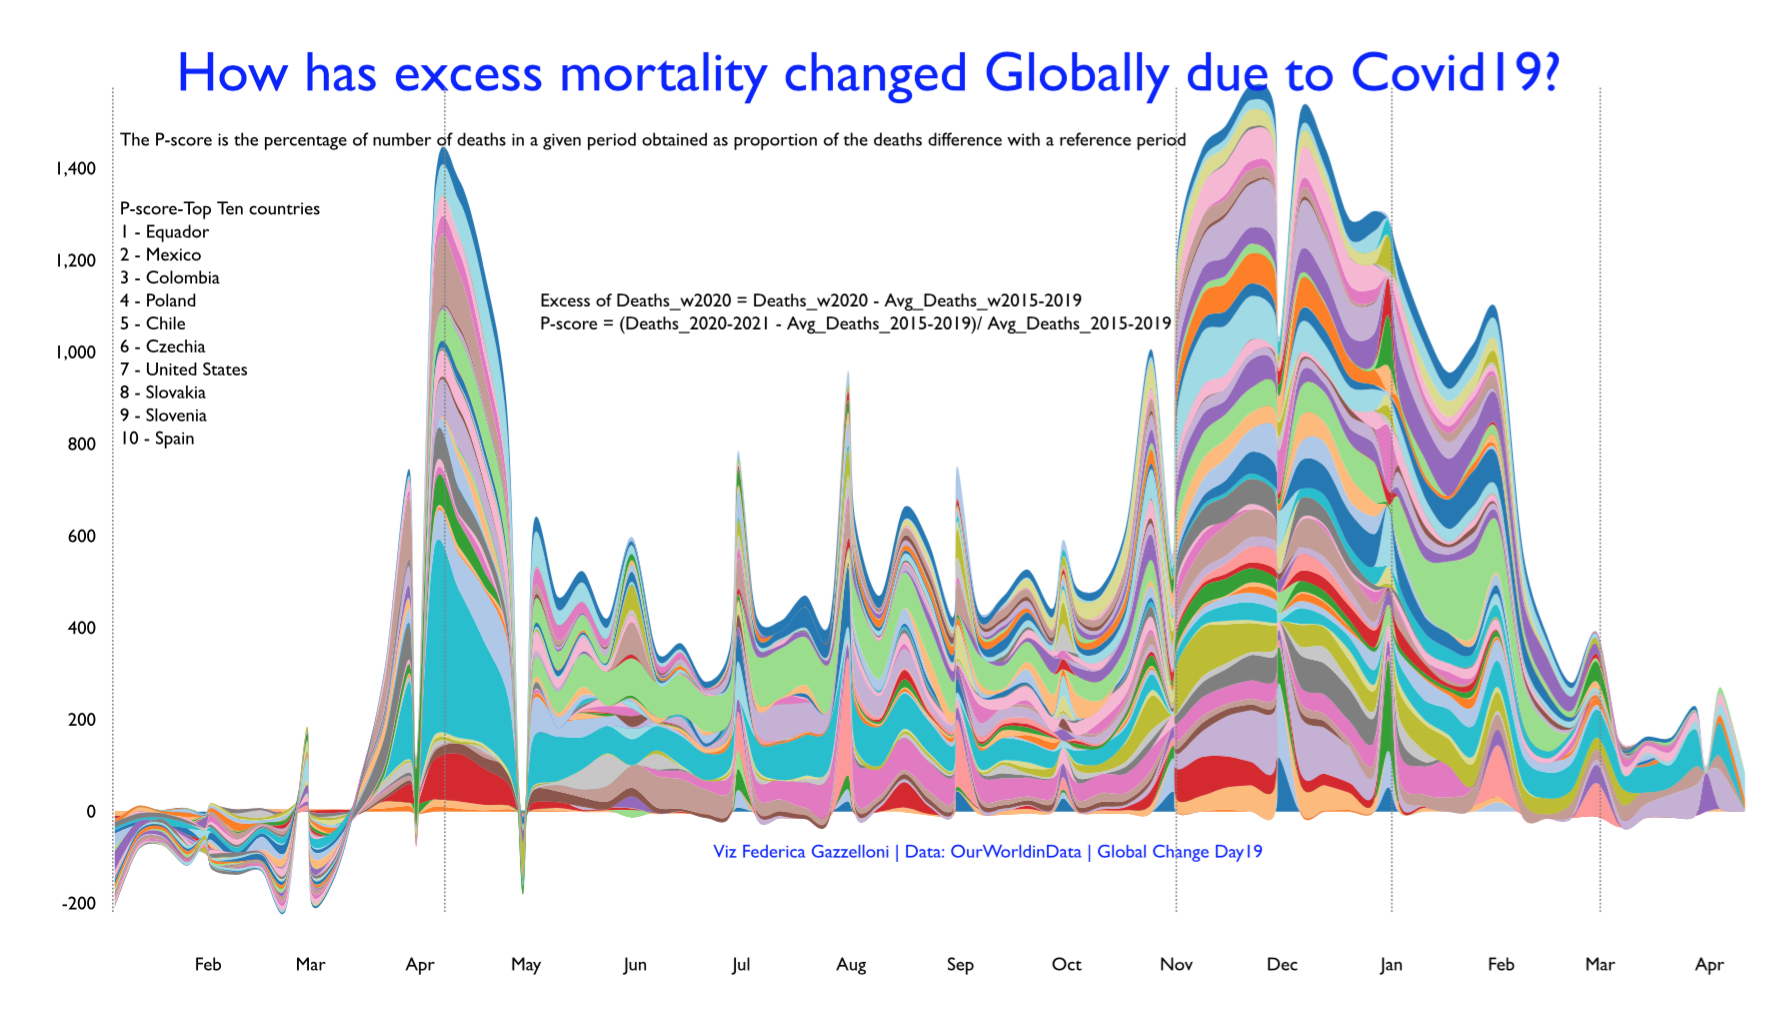
A streamgraph tracking excess deaths across countries during the COVID-19 period using Our World in Data estimates.
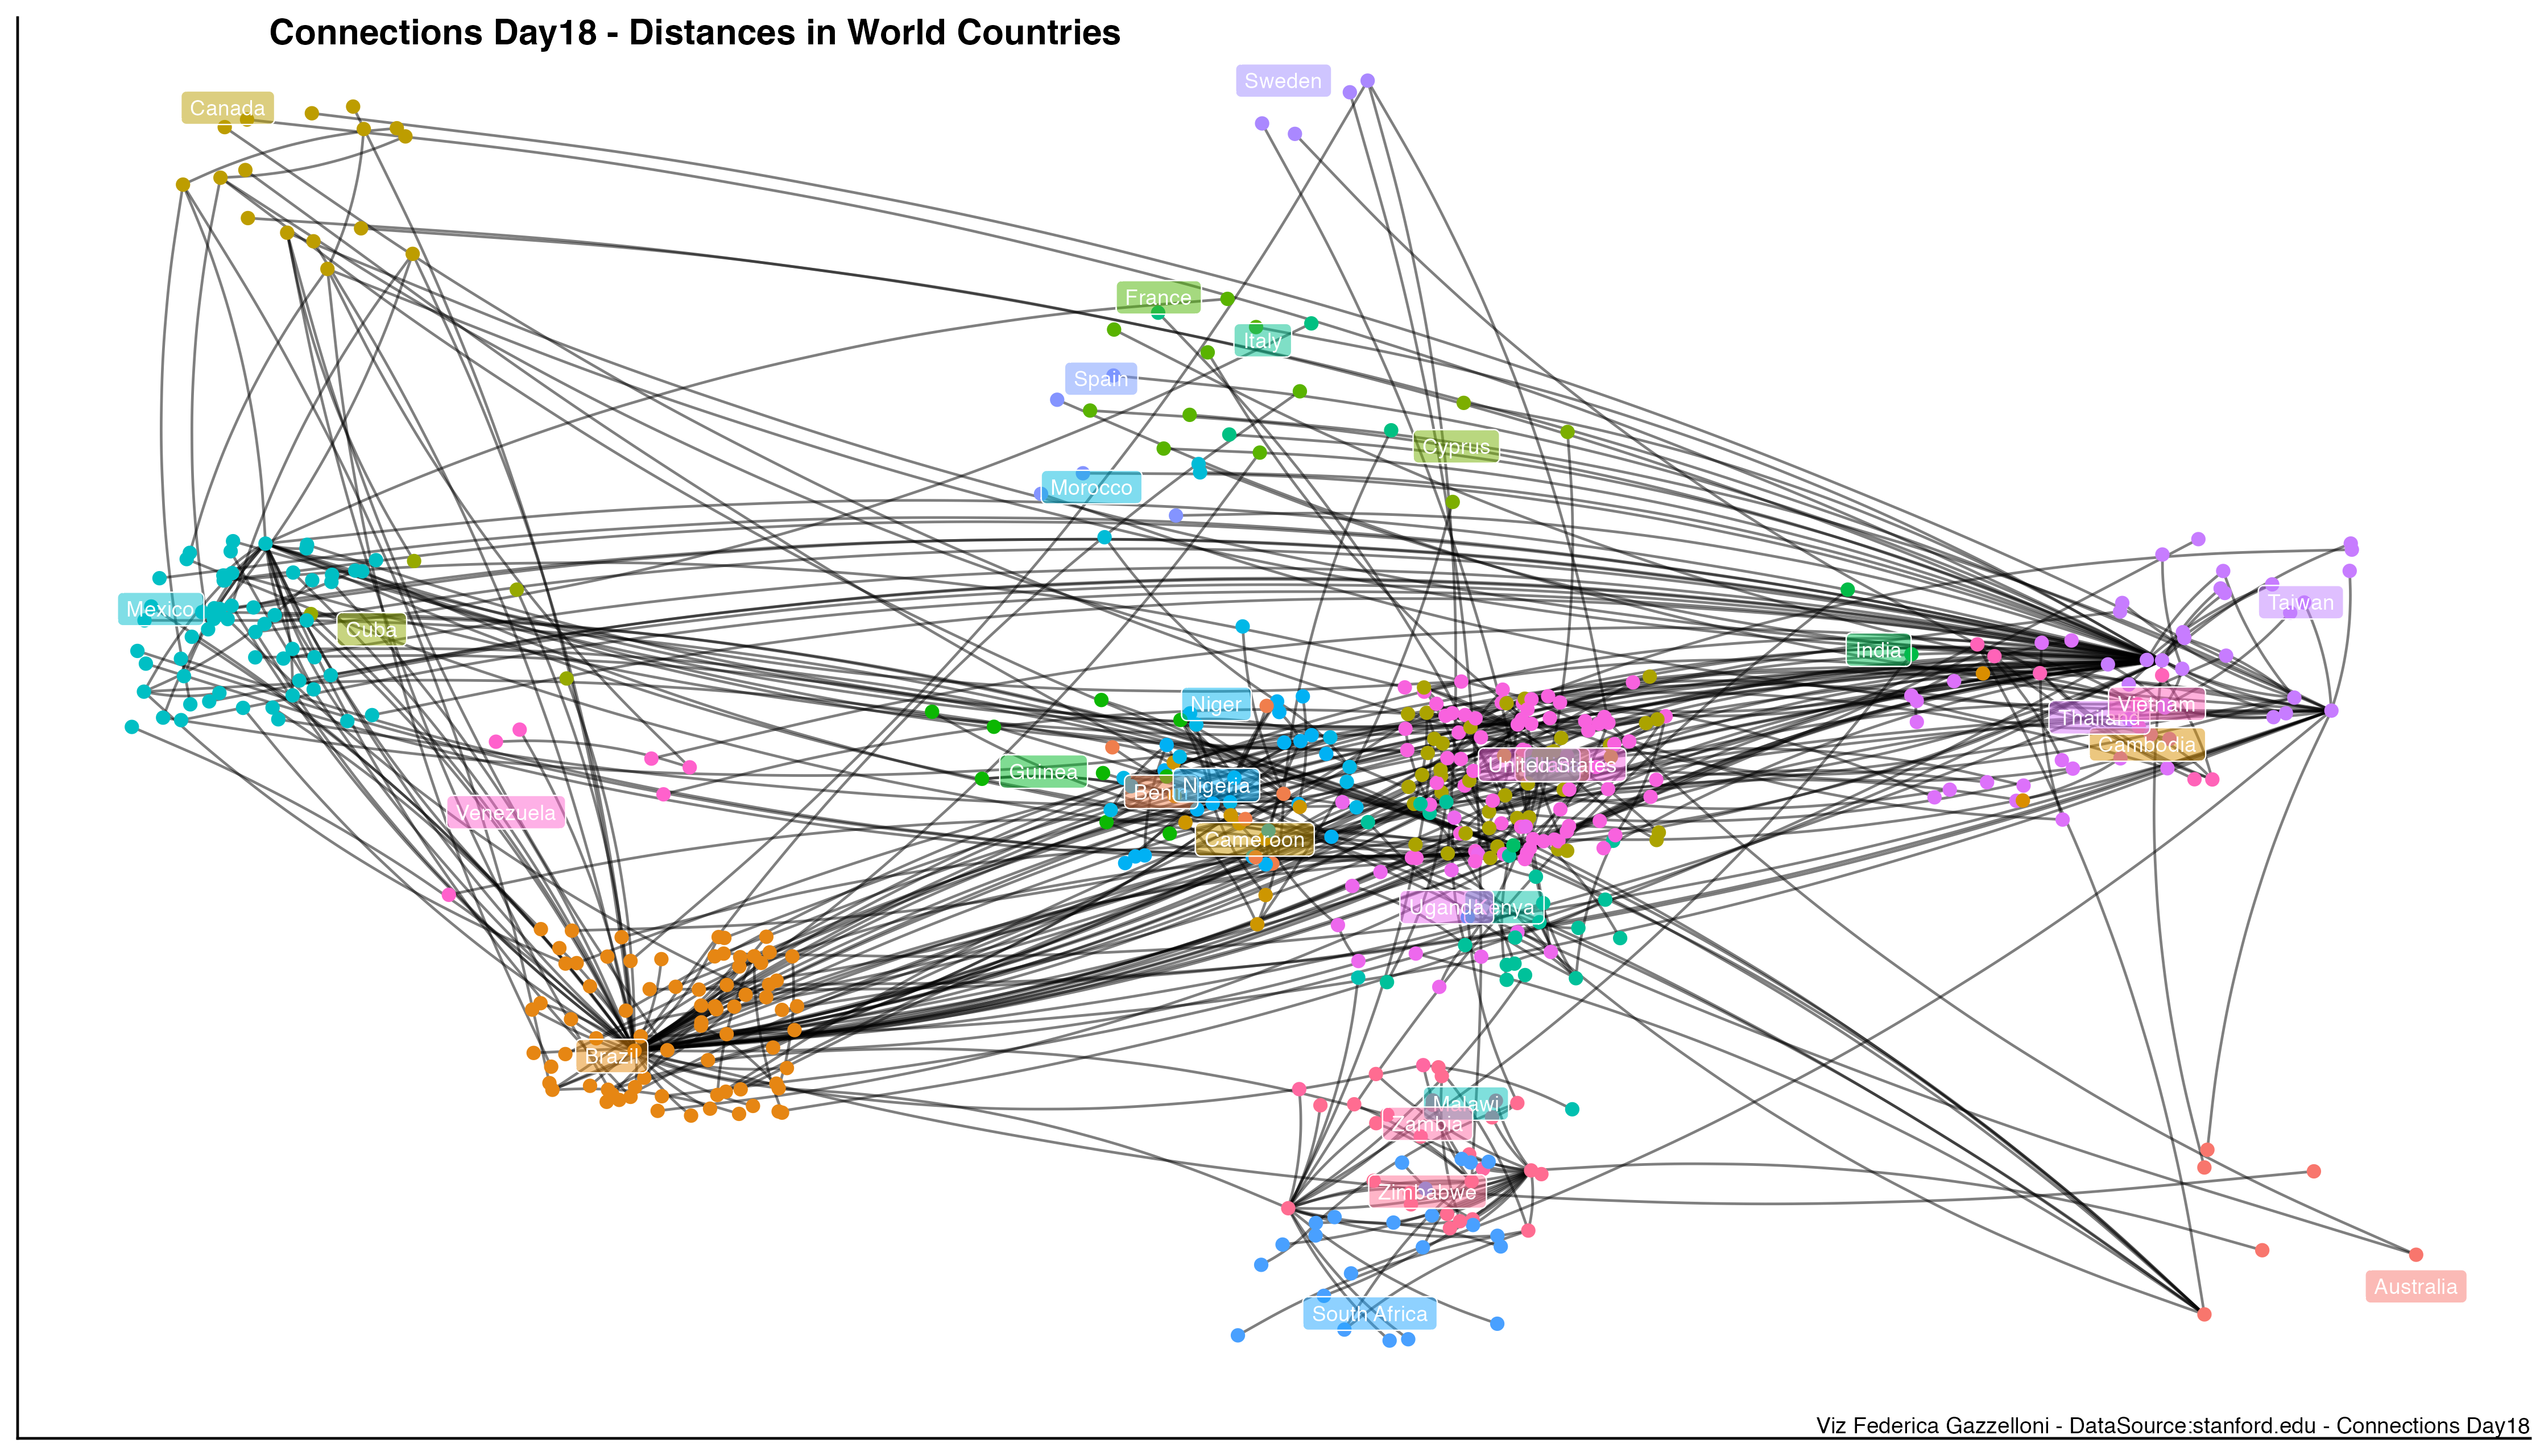
A geographic network connecting world countries by distance, built from a minimum spanning tree of country-distance data.
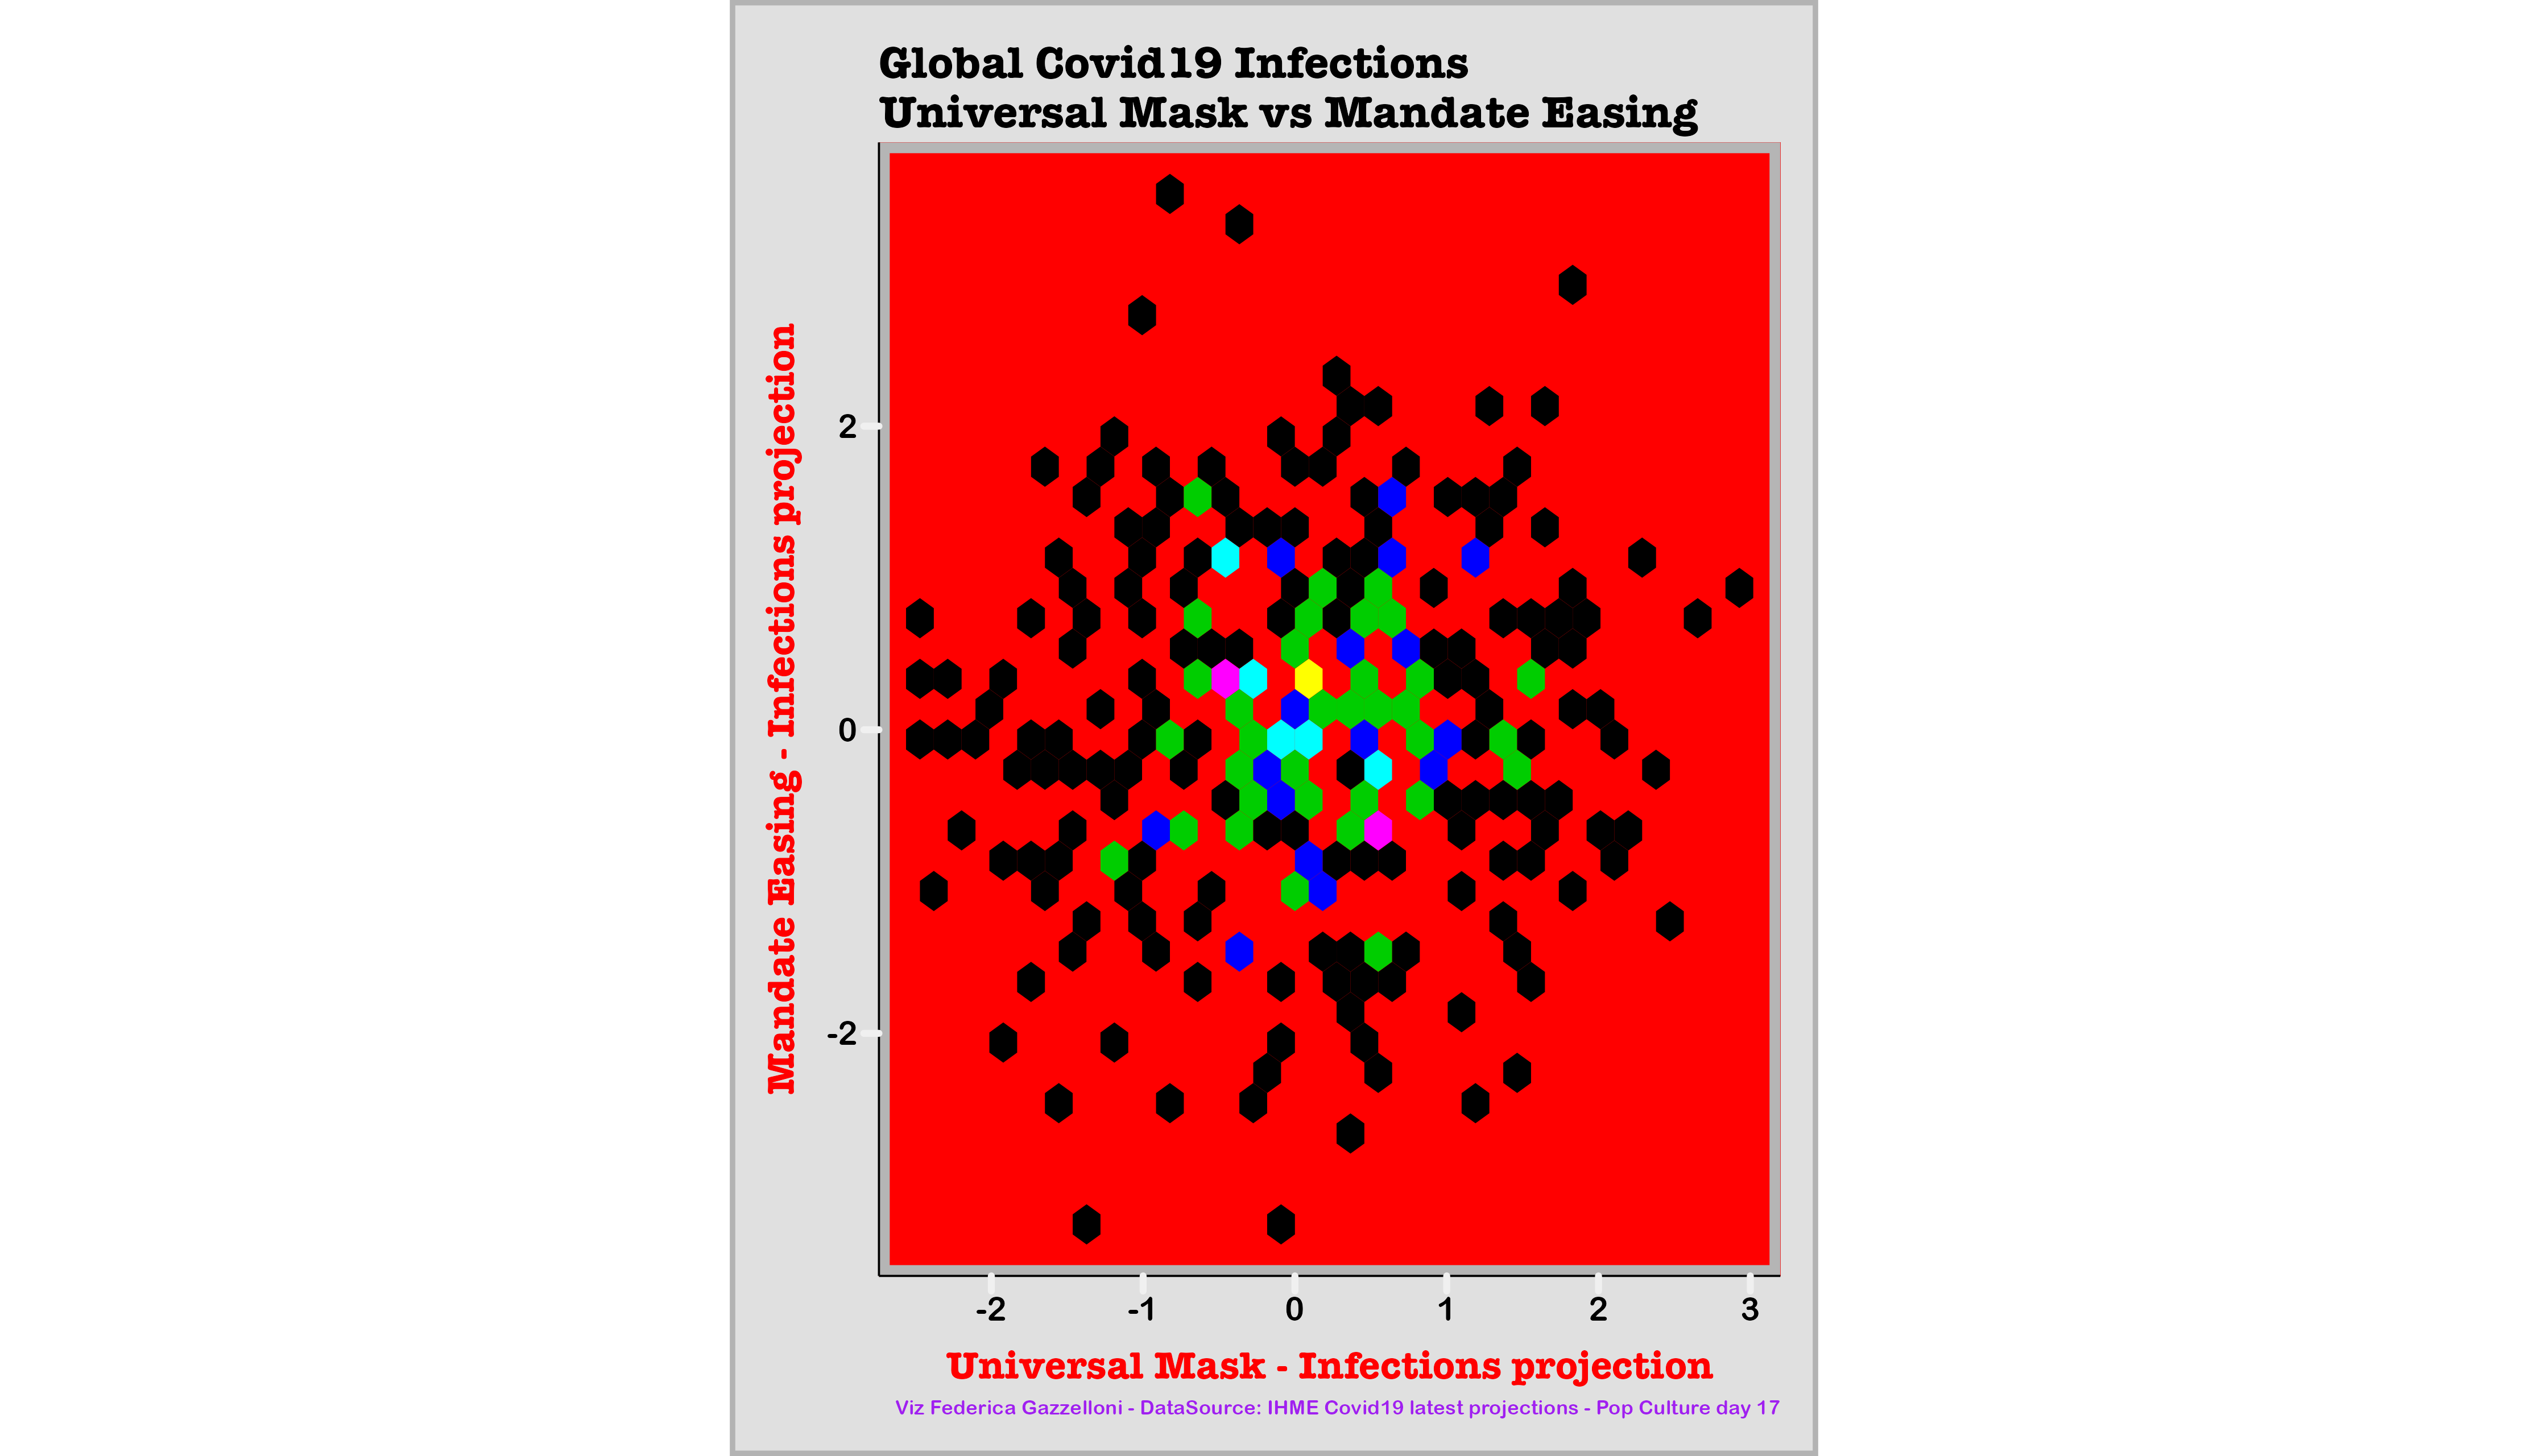
A comparison of projected global COVID-19 infections alongside mask use and the easing of mask mandates.
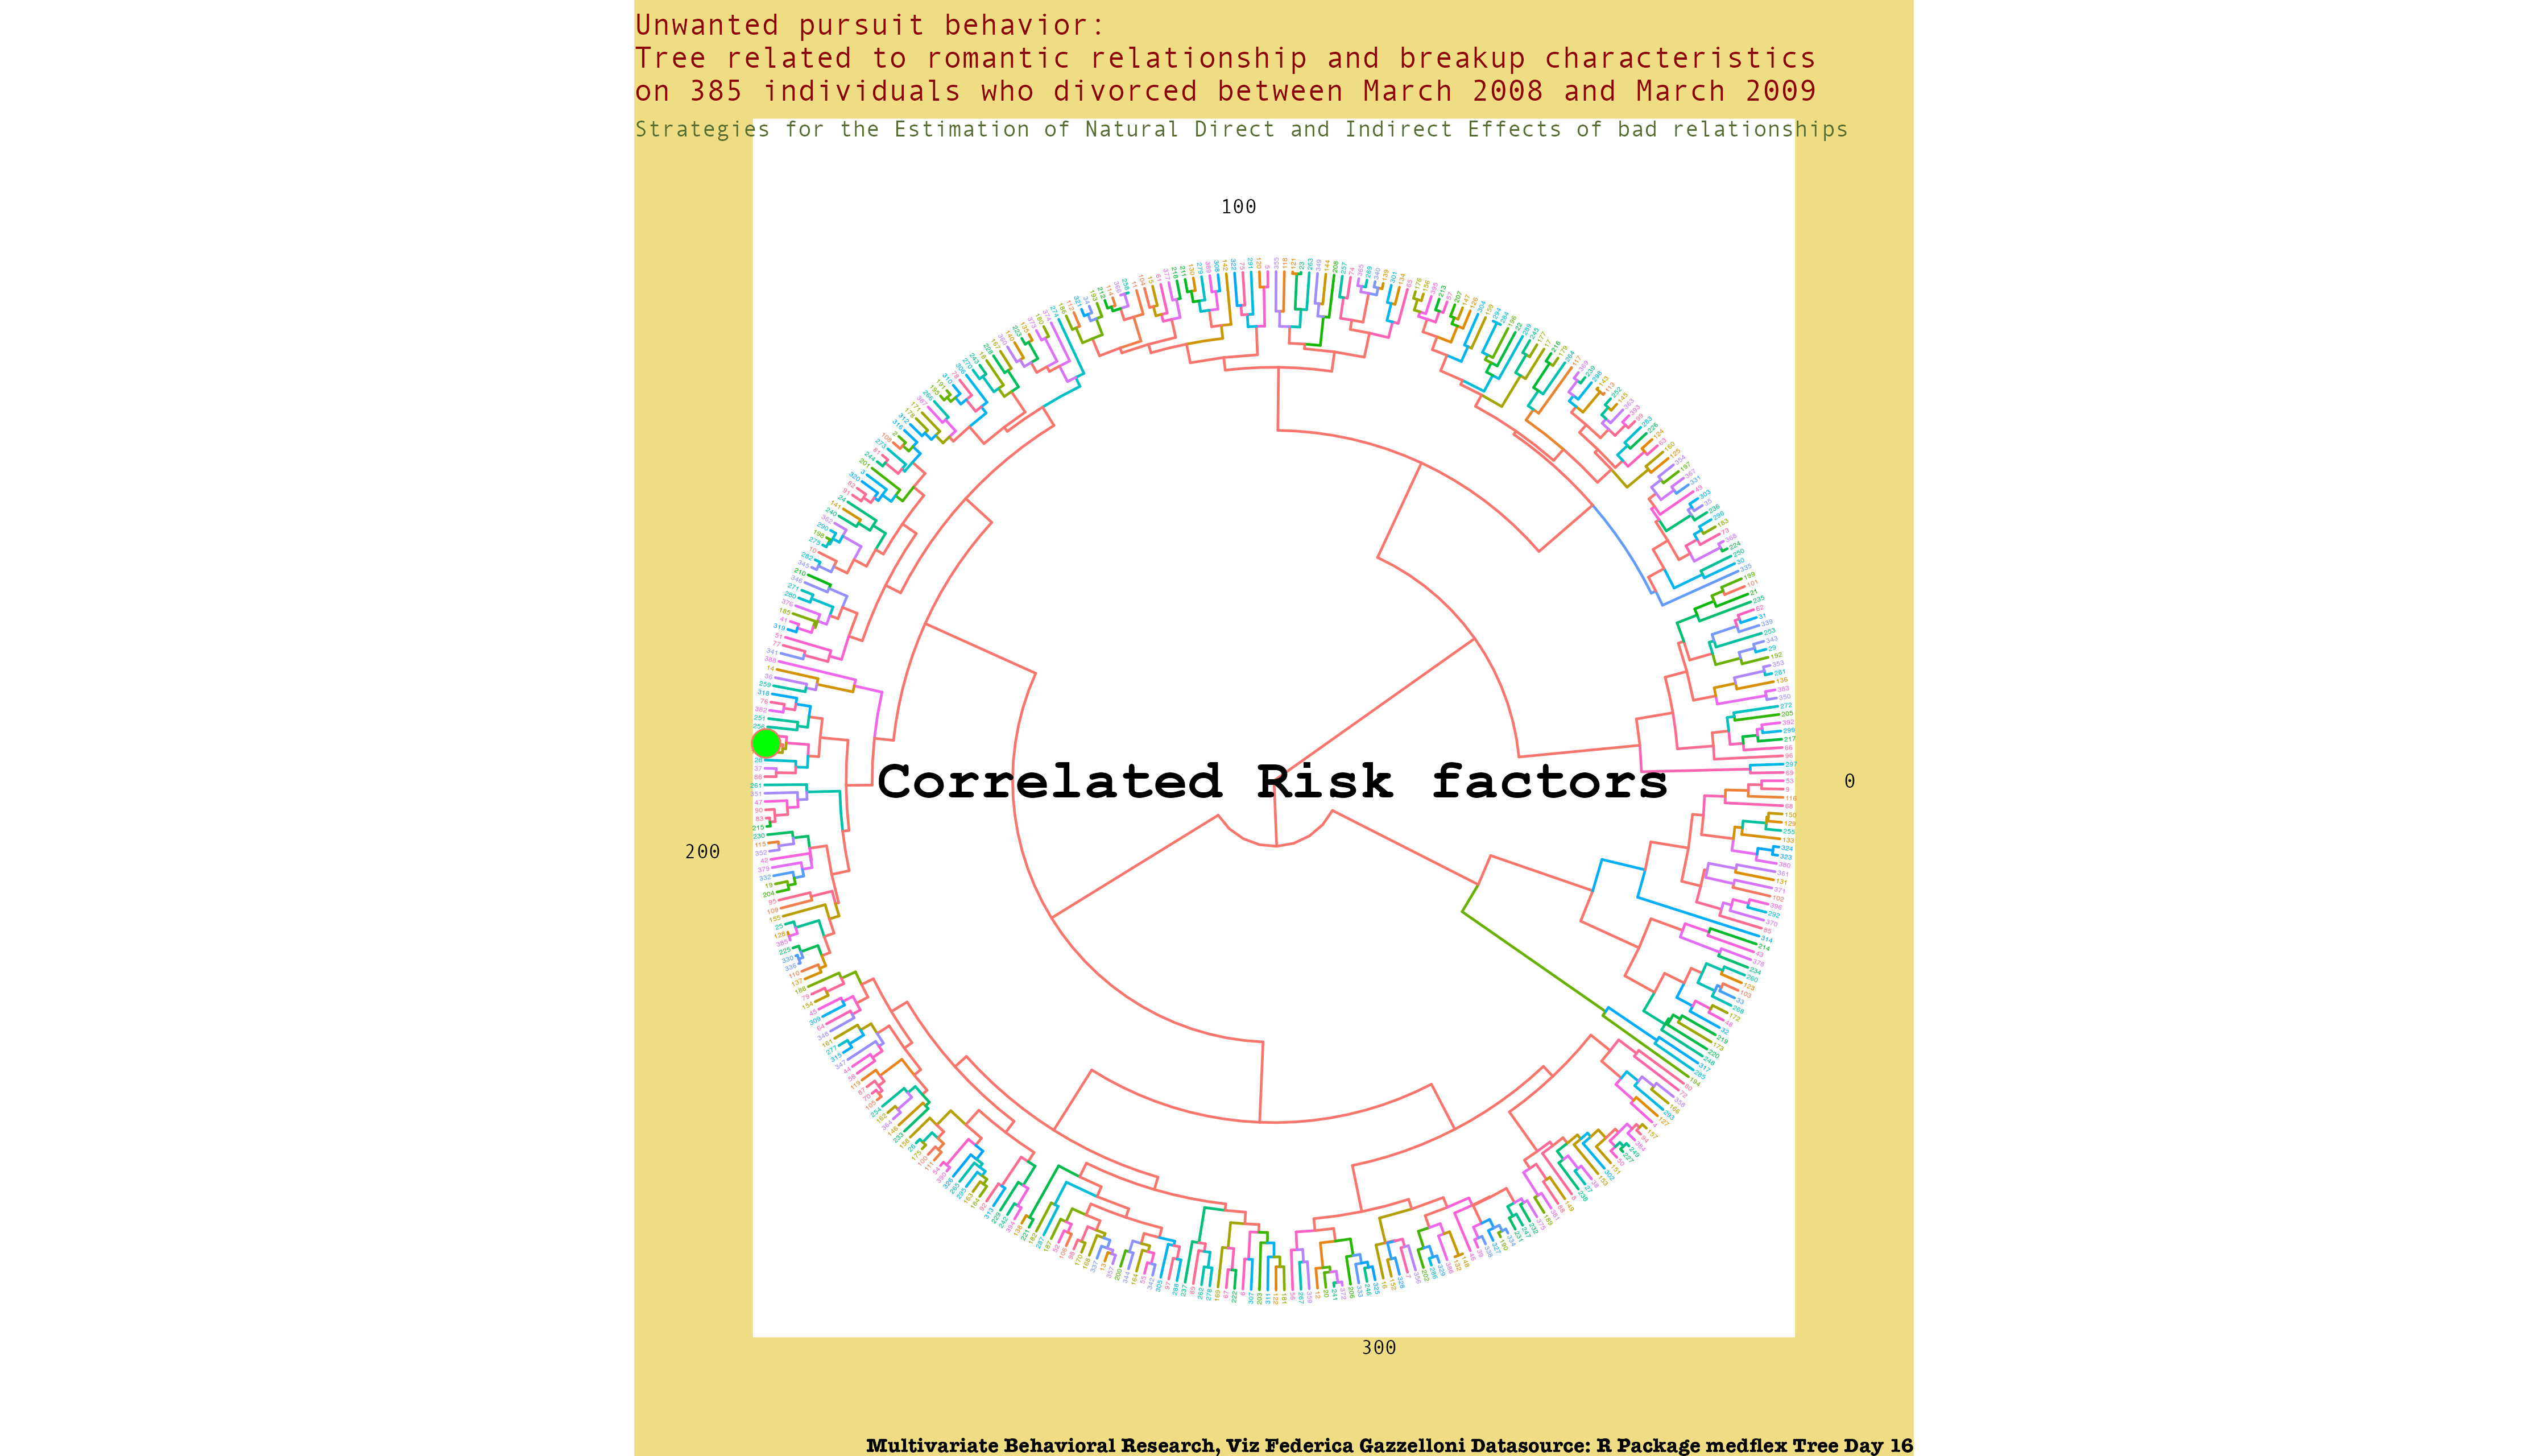
A tree-style view of estimated direct and indirect effects in relationship data using the medflex R package.
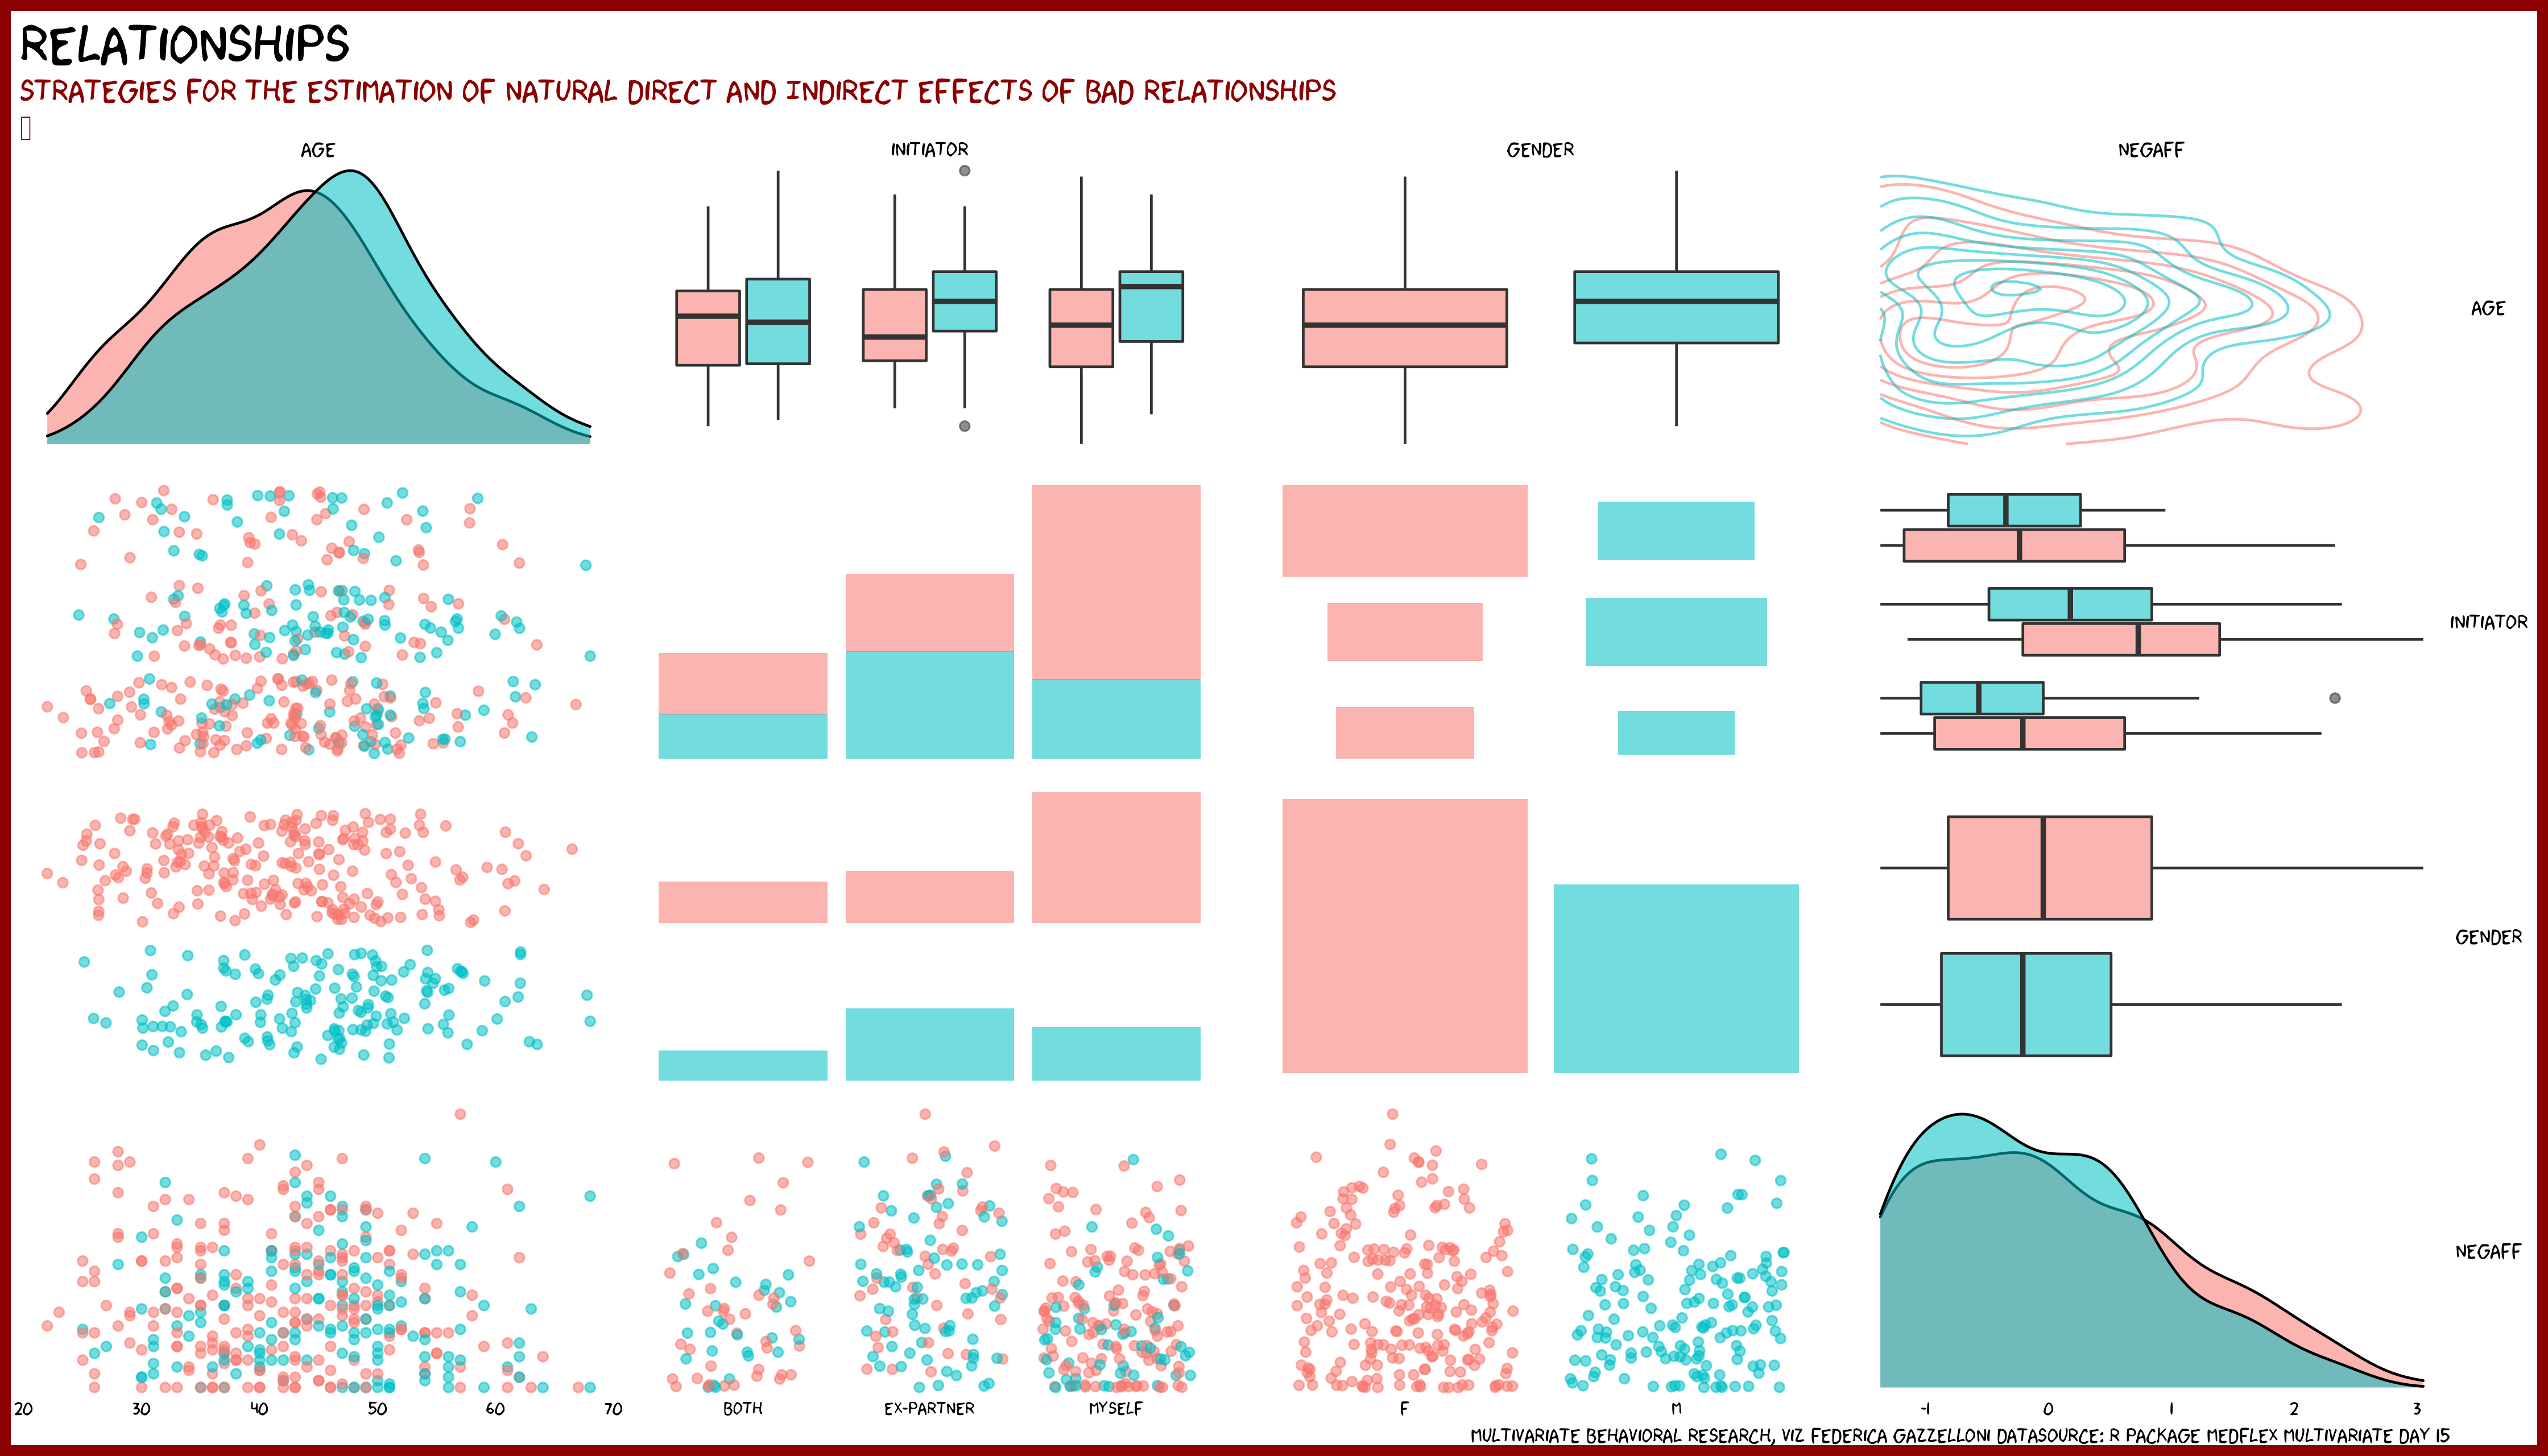
A multivariate visualization of estimated direct and indirect effects in relationship data using the medflex R package.
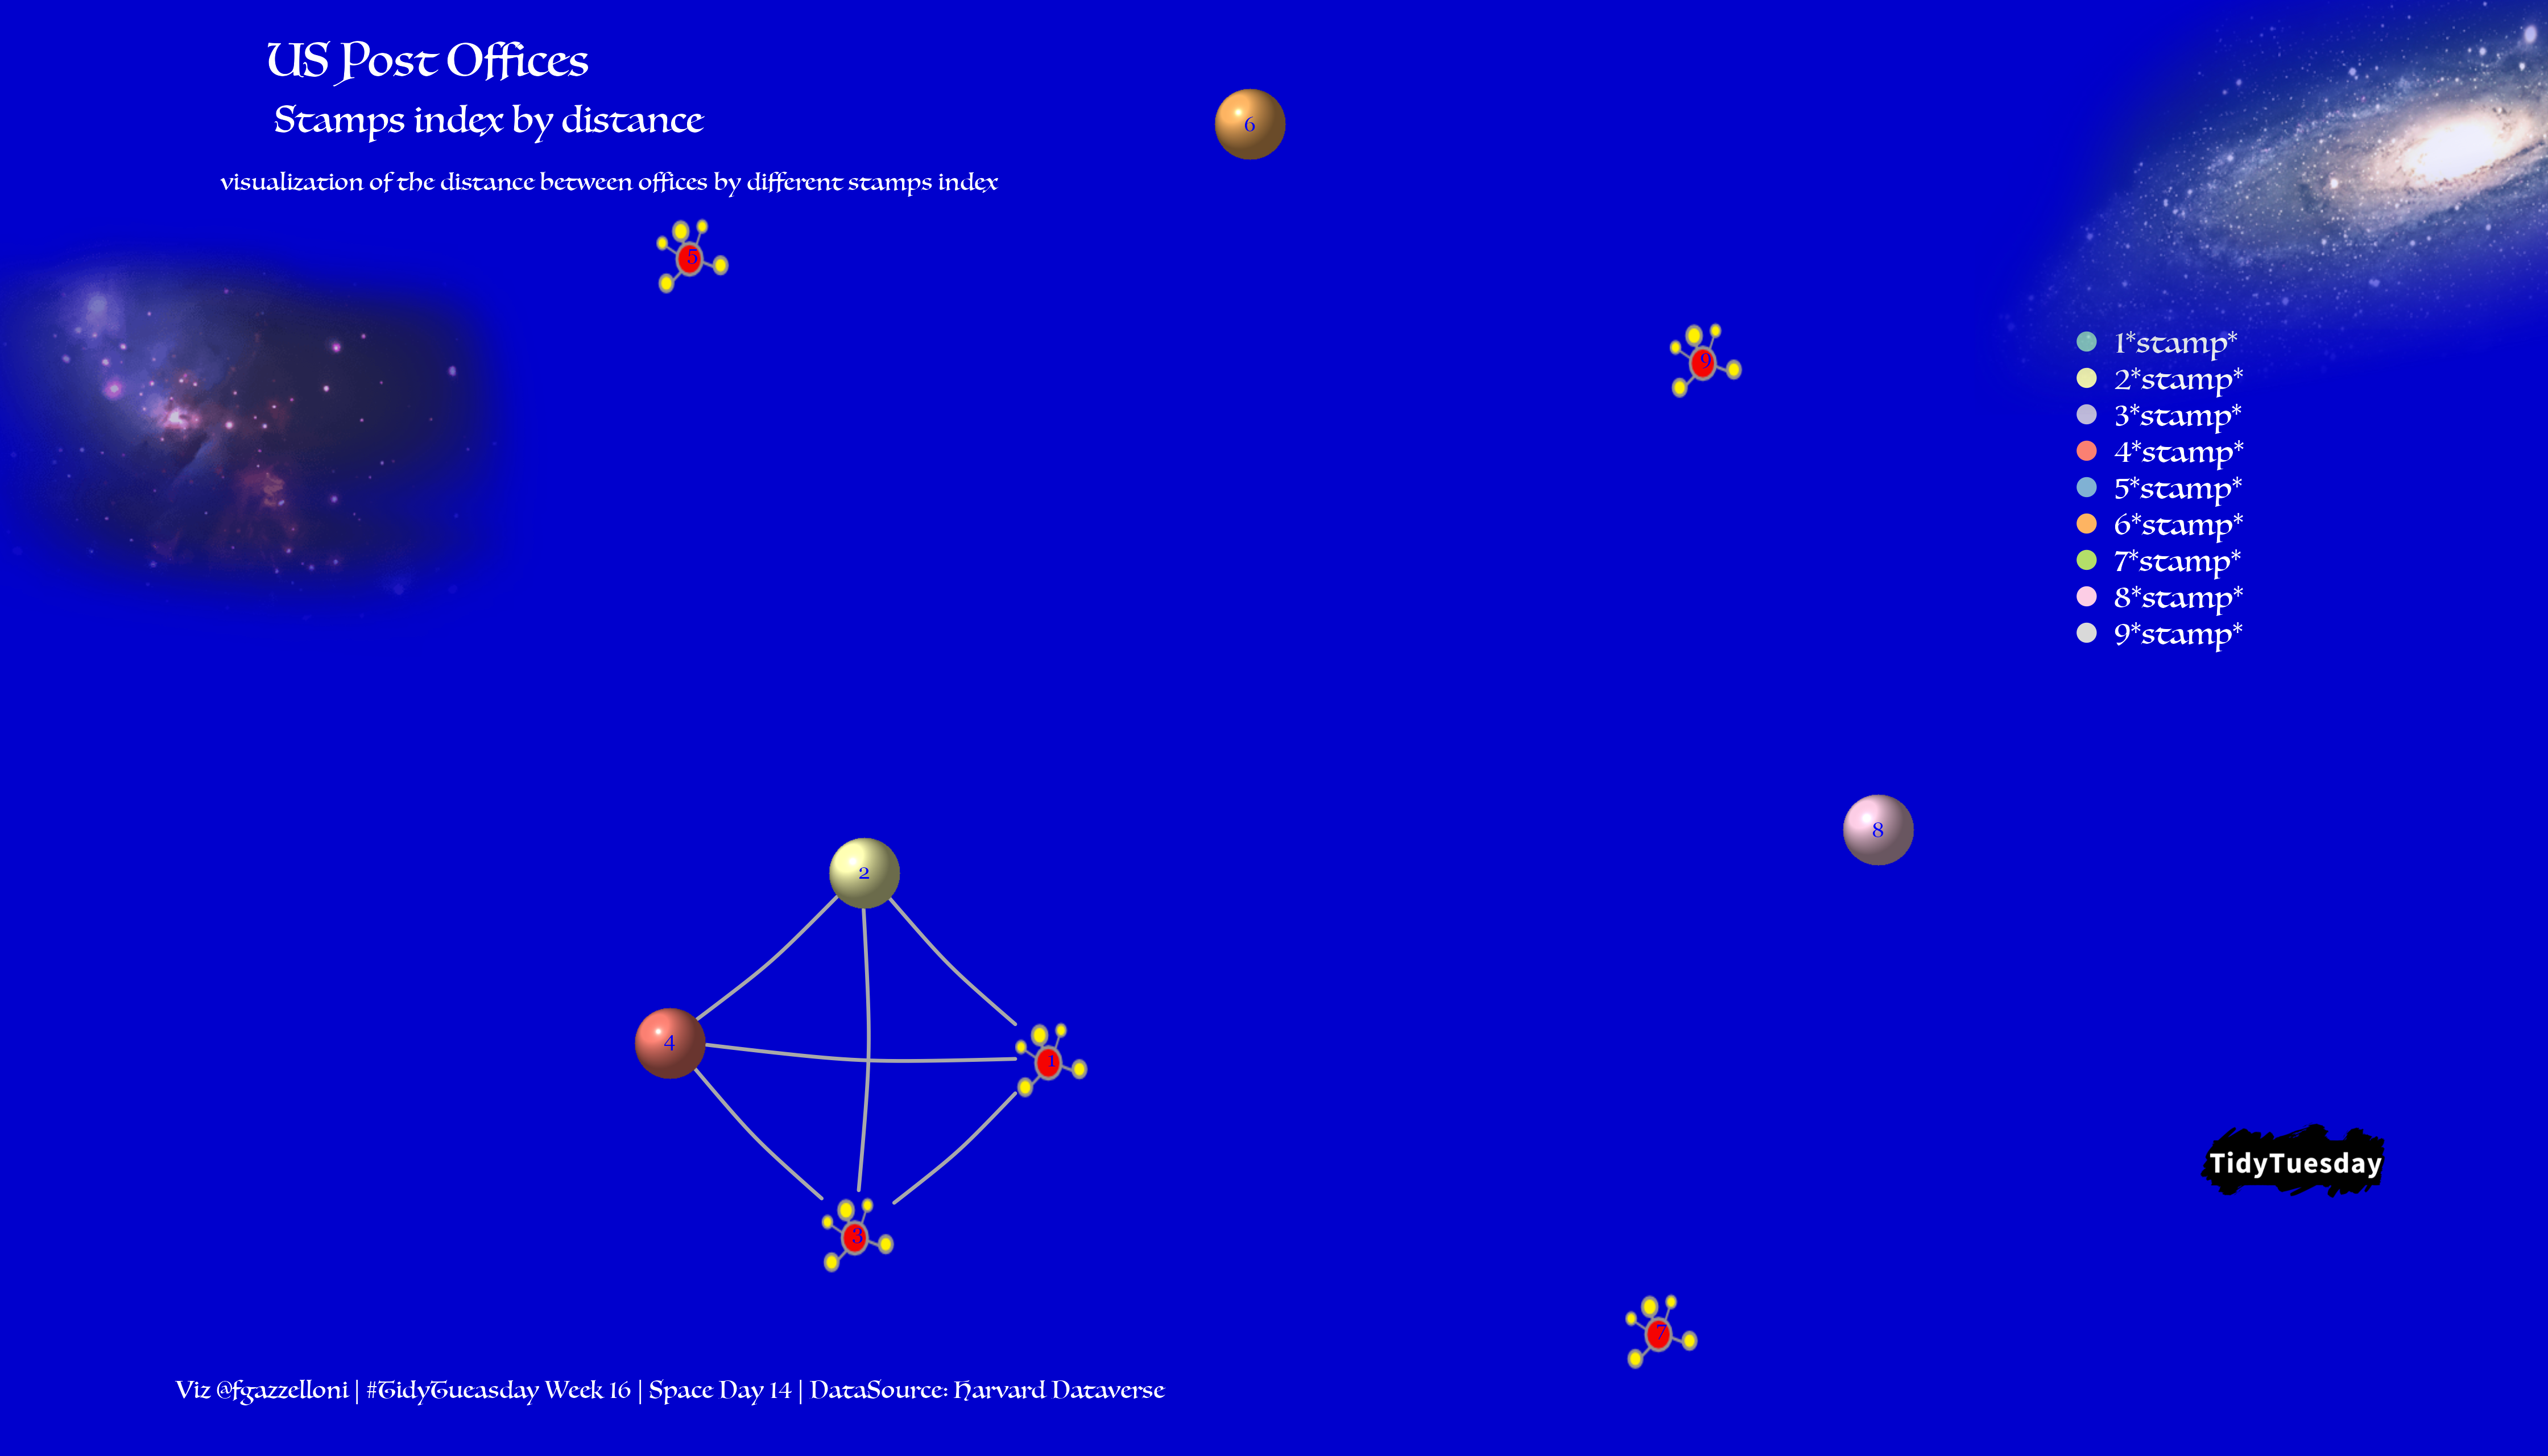
A network map linking US post offices by stamp index and the average duration and distance between offices.
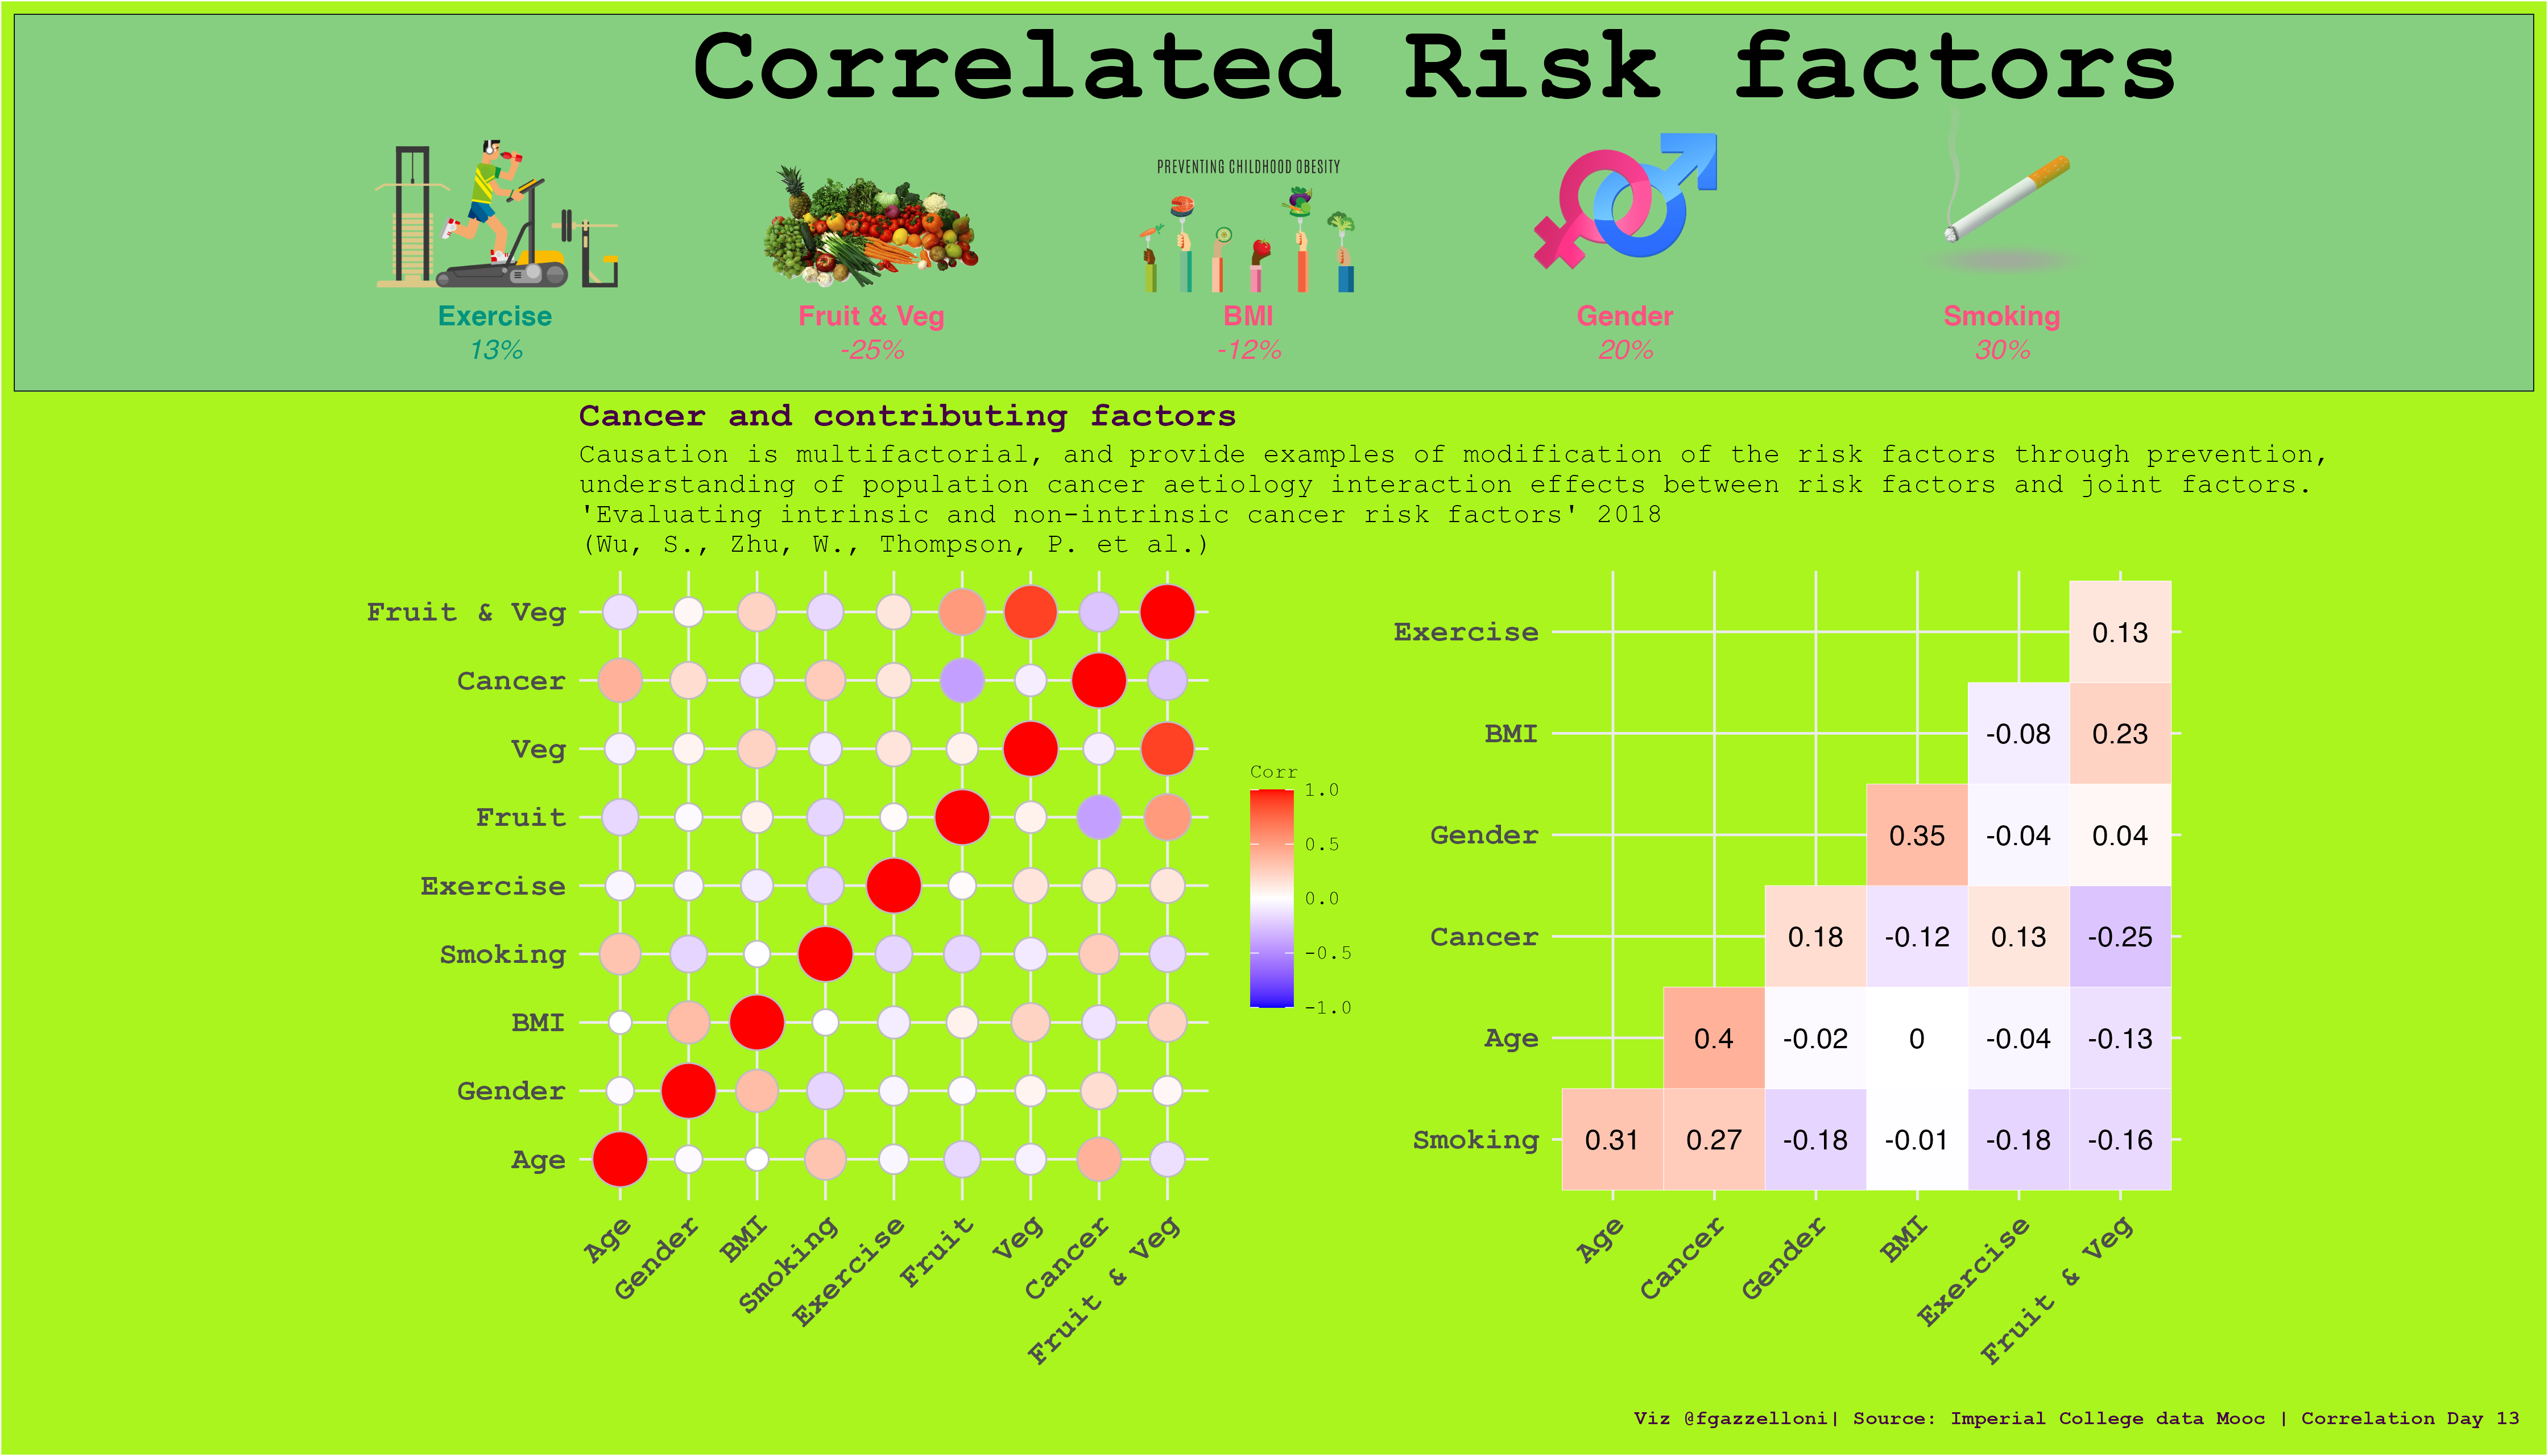
A correlation-focused view of intrinsic and non-intrinsic cancer risk factors and their interactions.
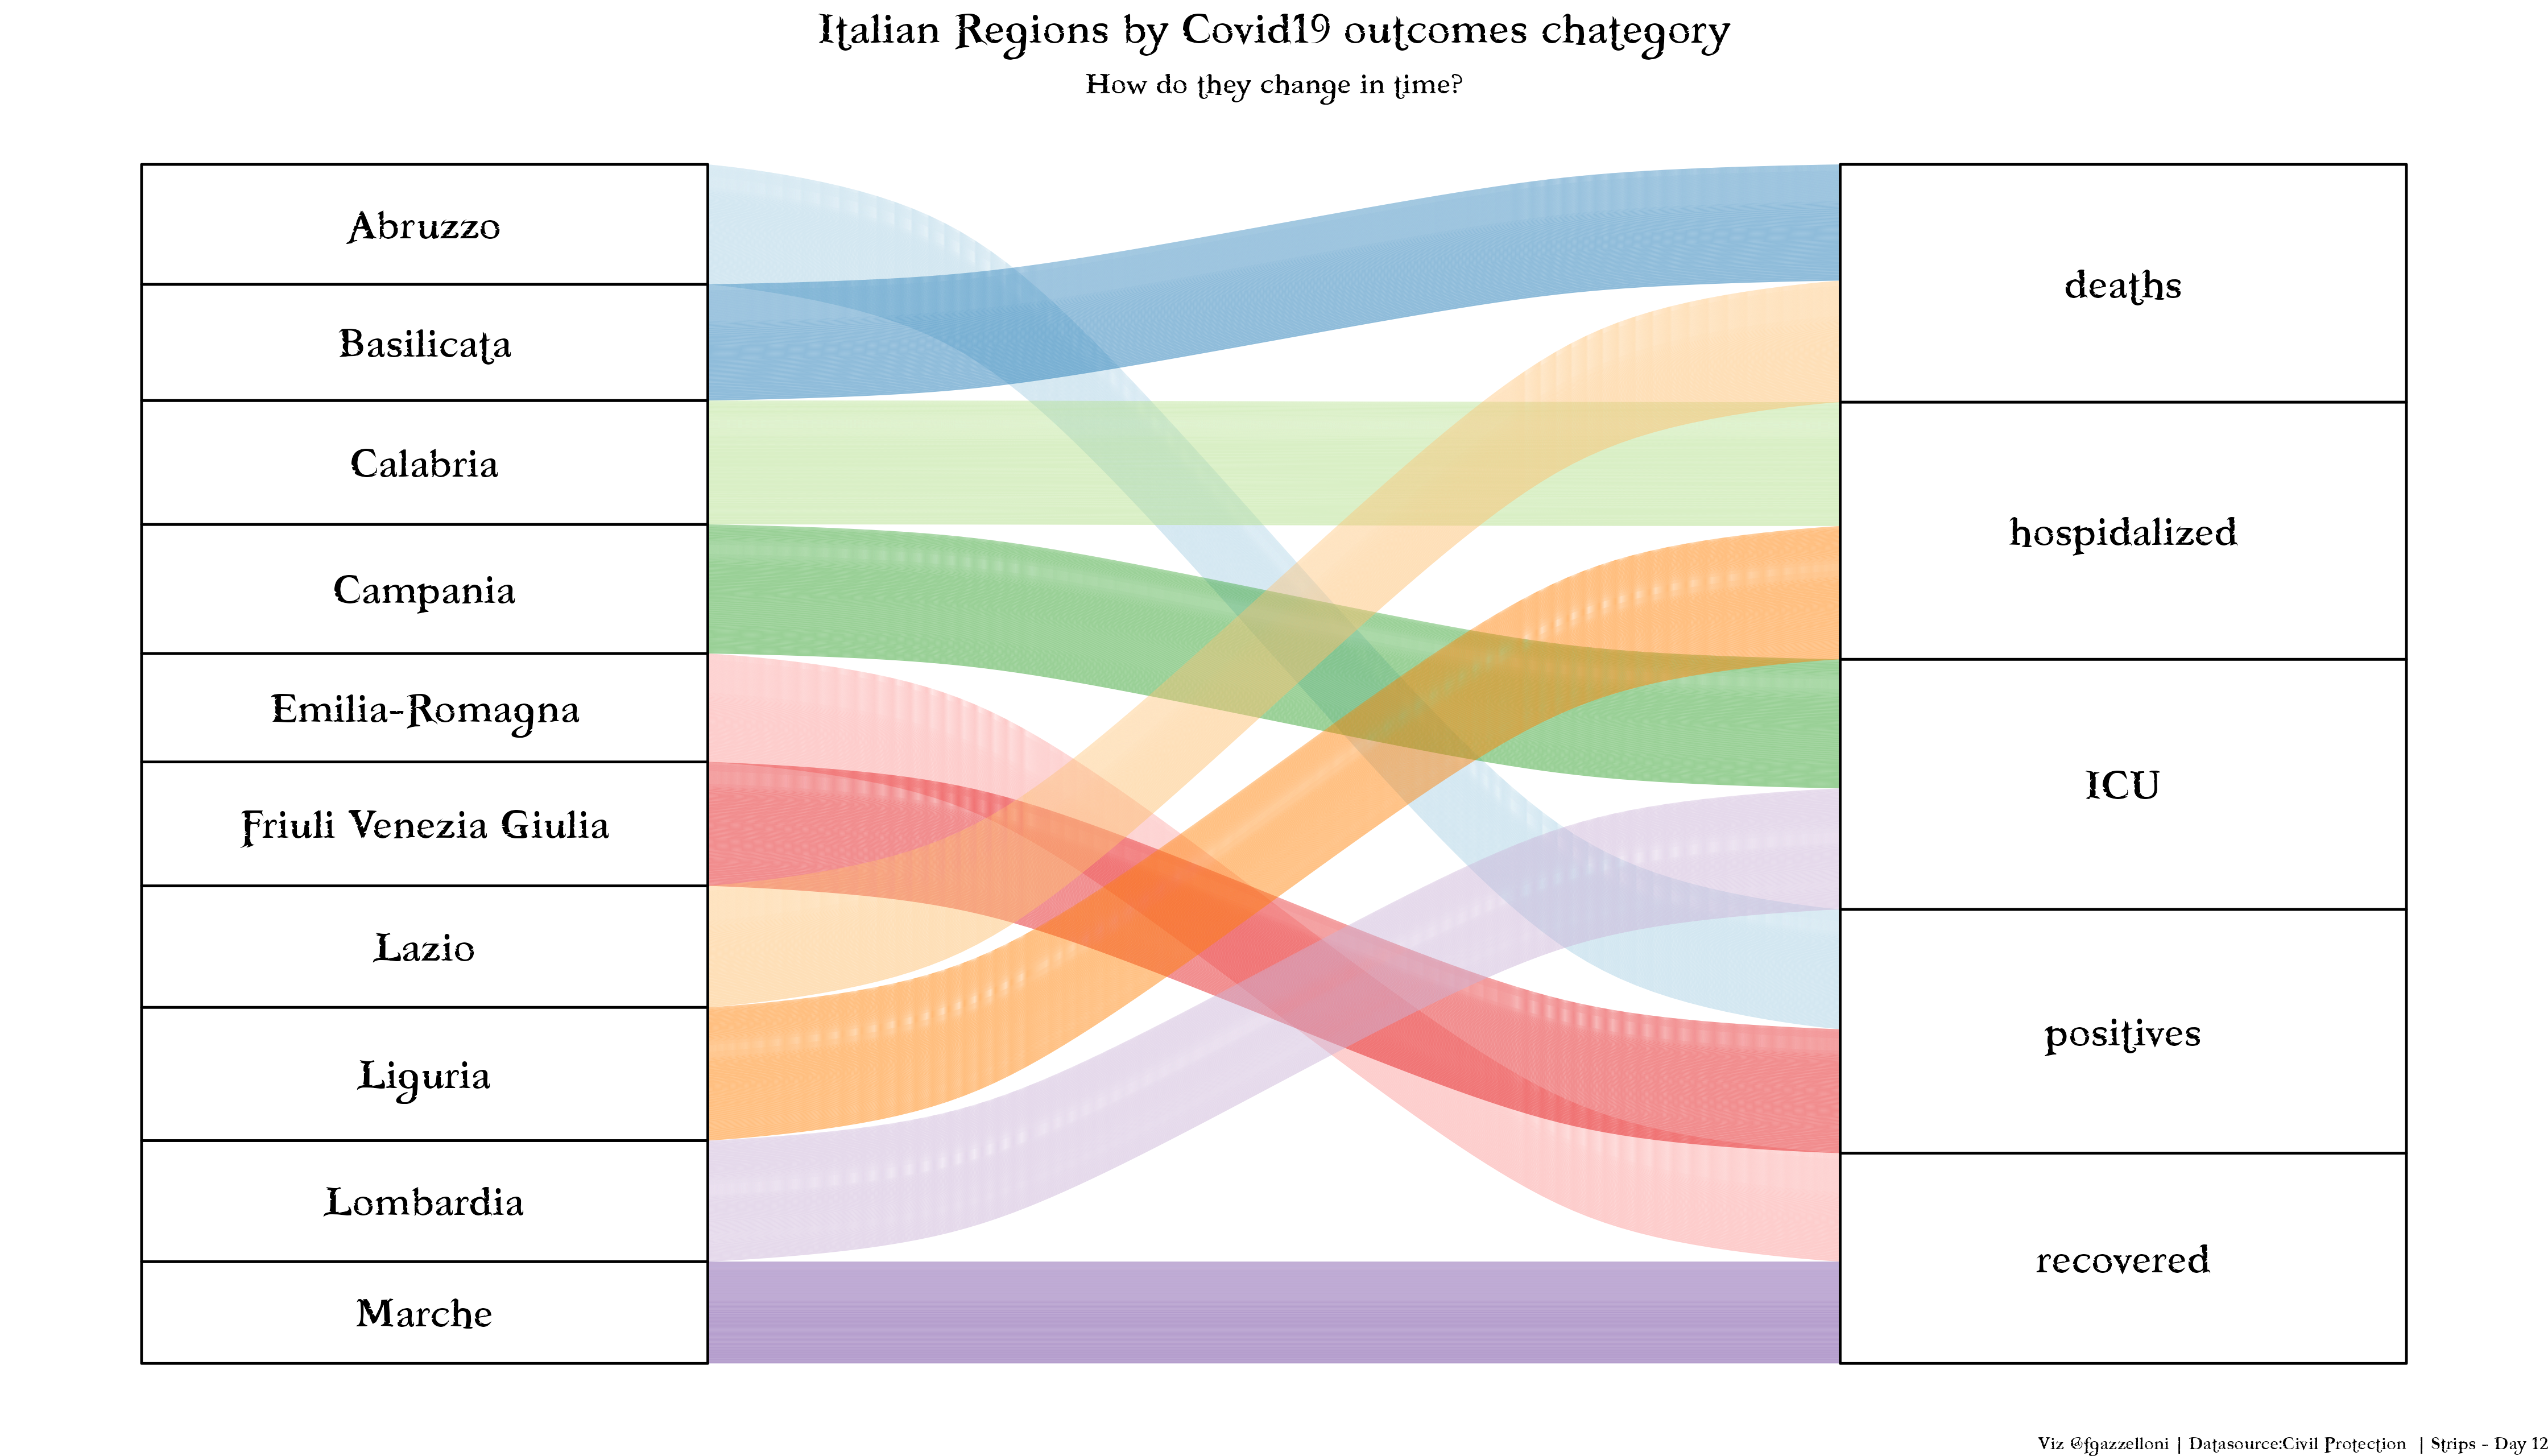
An alluvial chart comparing COVID-19 cases, deaths, hospitalizations, intensive care, and recoveries across ten Italian regions.
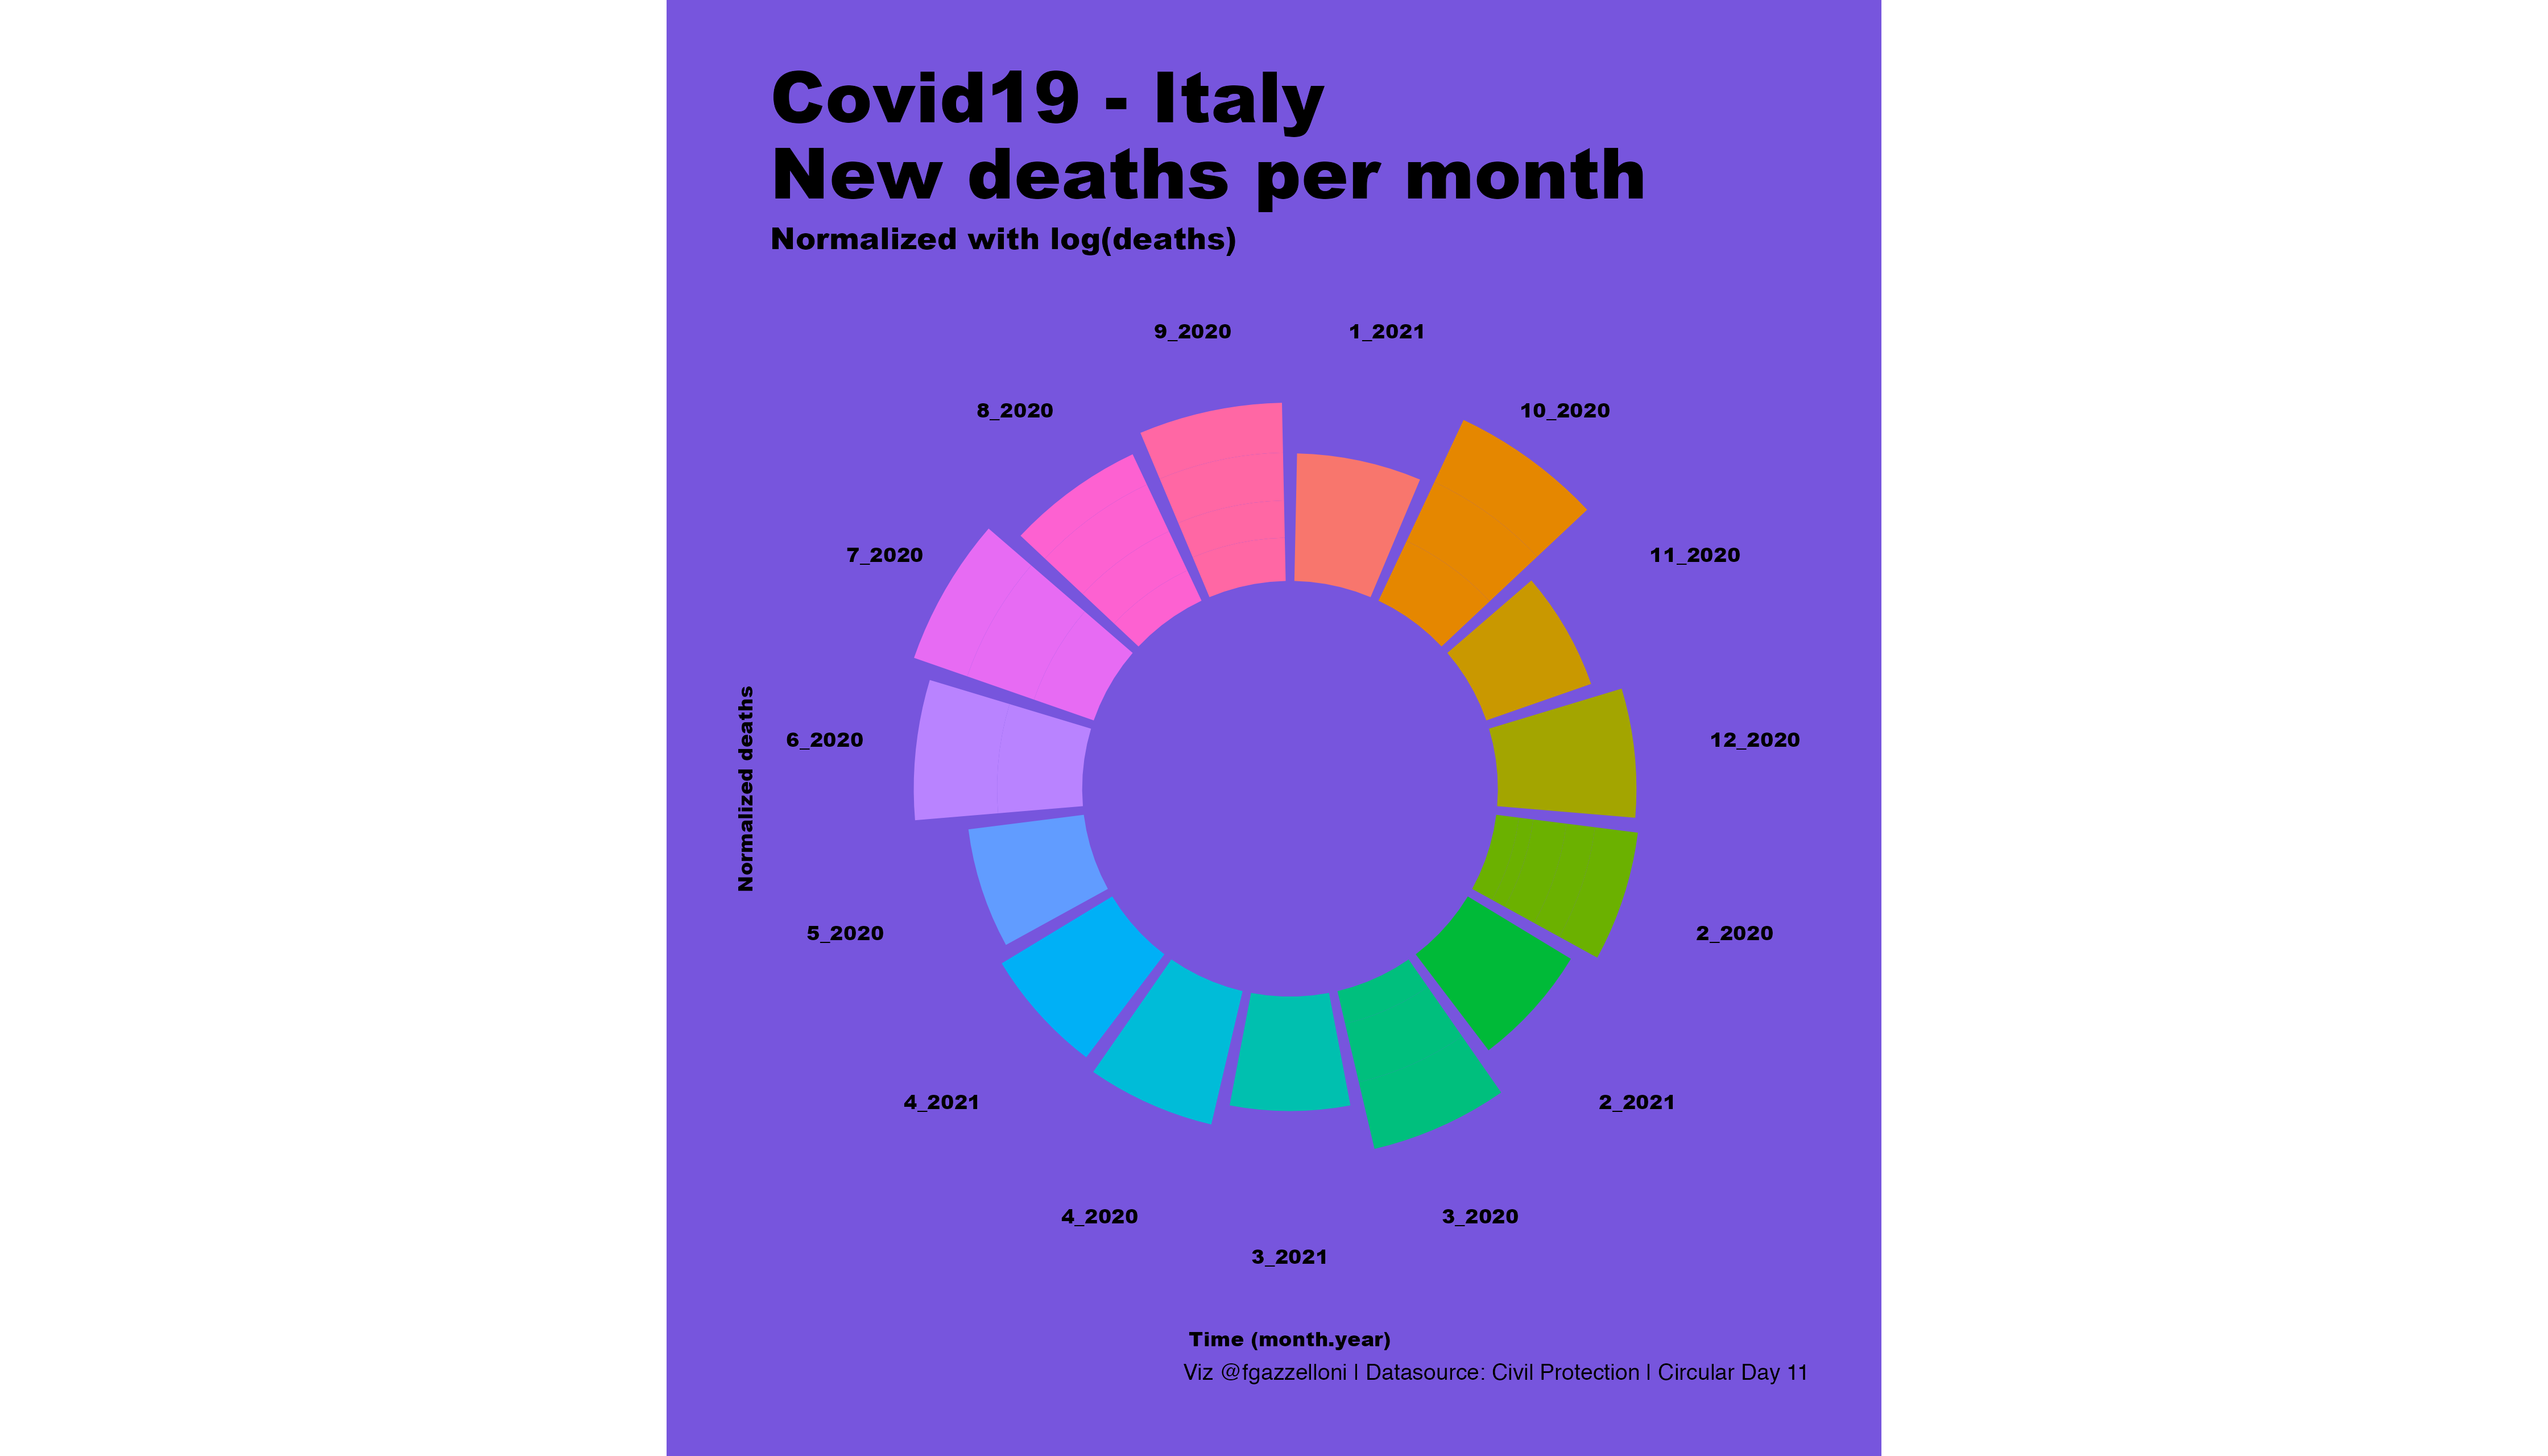
A circular chart of monthly COVID-19 deaths in Italy, with death counts normalized on a logarithmic scale.
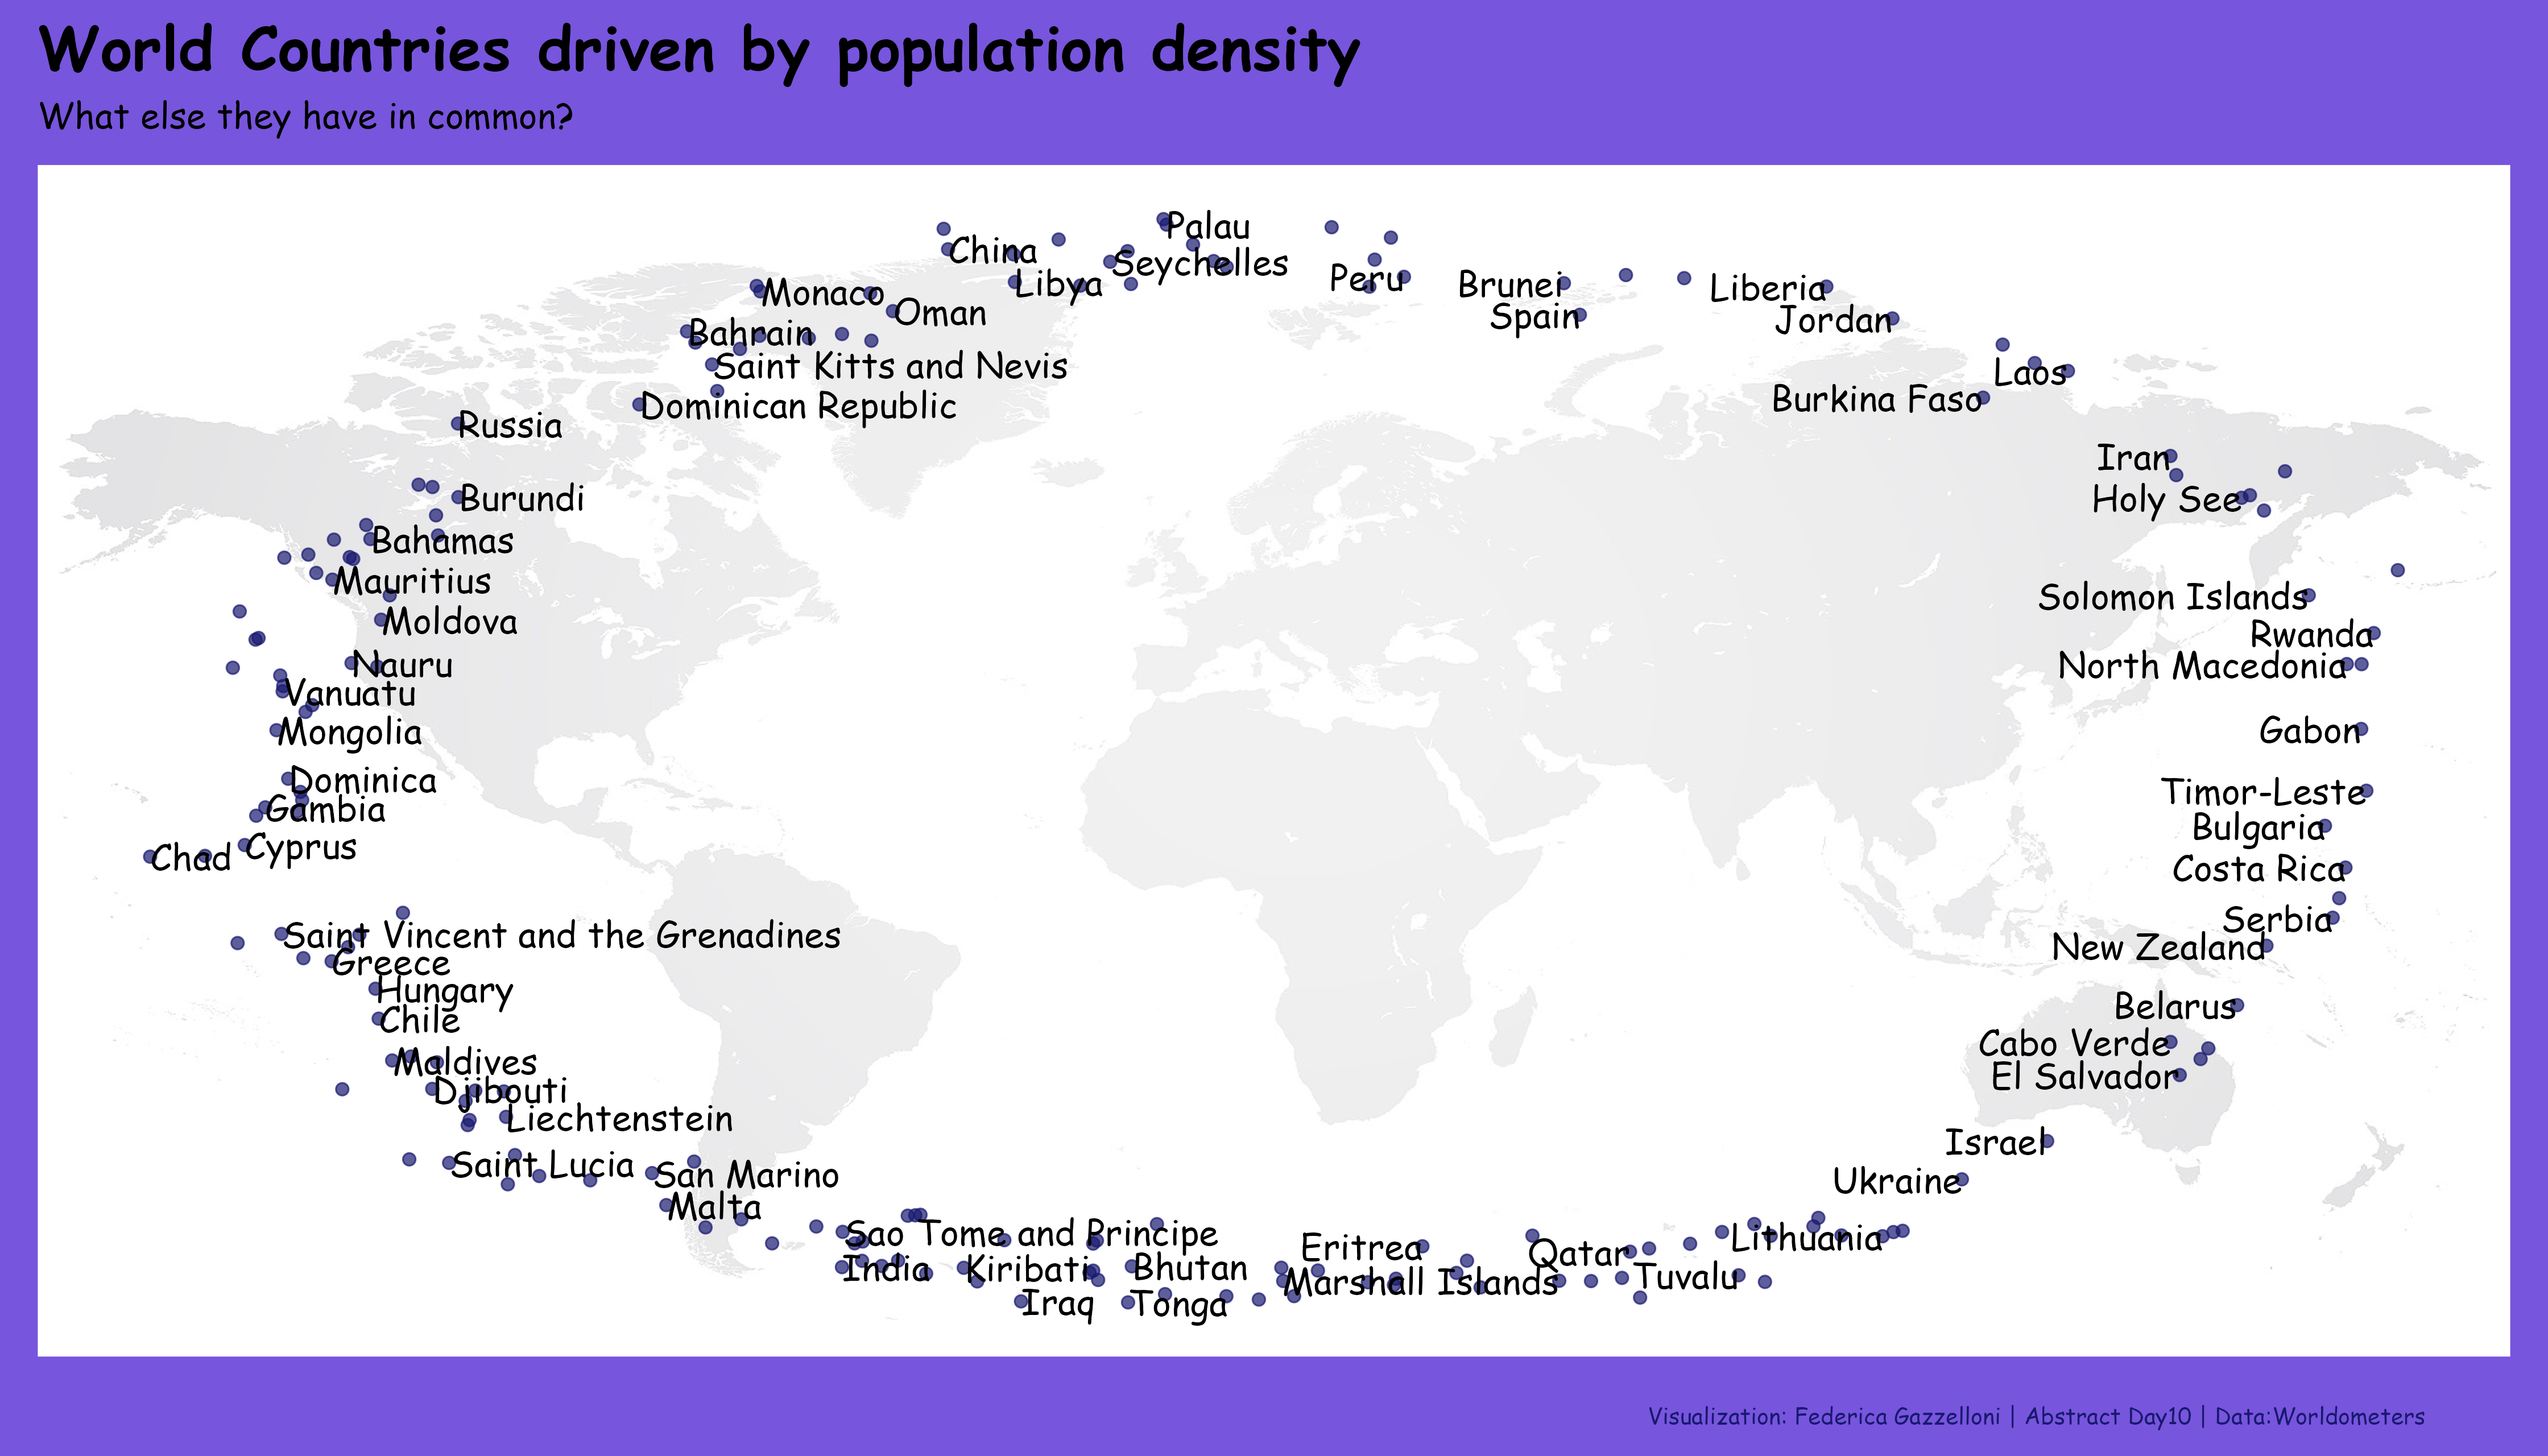
A comparison of country-level population-density diversity, highlighting Seychelles, Antigua and Barbuda, and San Marino.
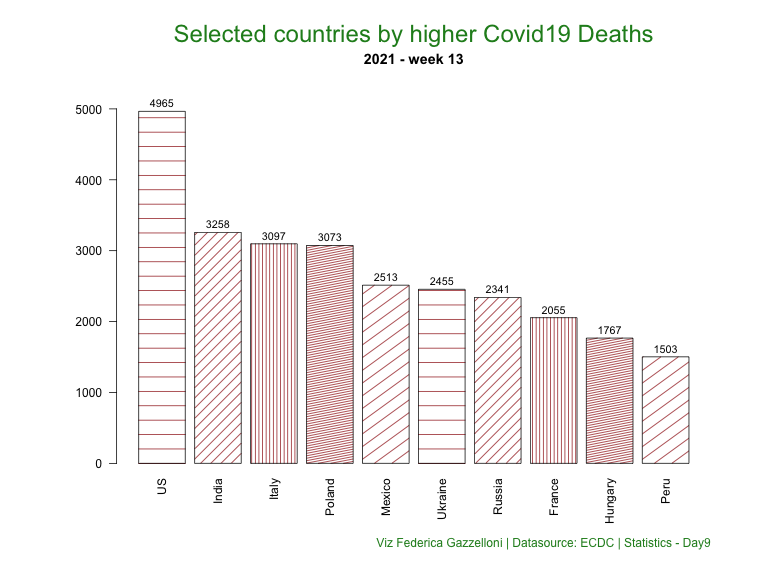
A bar chart comparing weekly COVID-19 deaths in ten selected countries during week 13 of 2021.
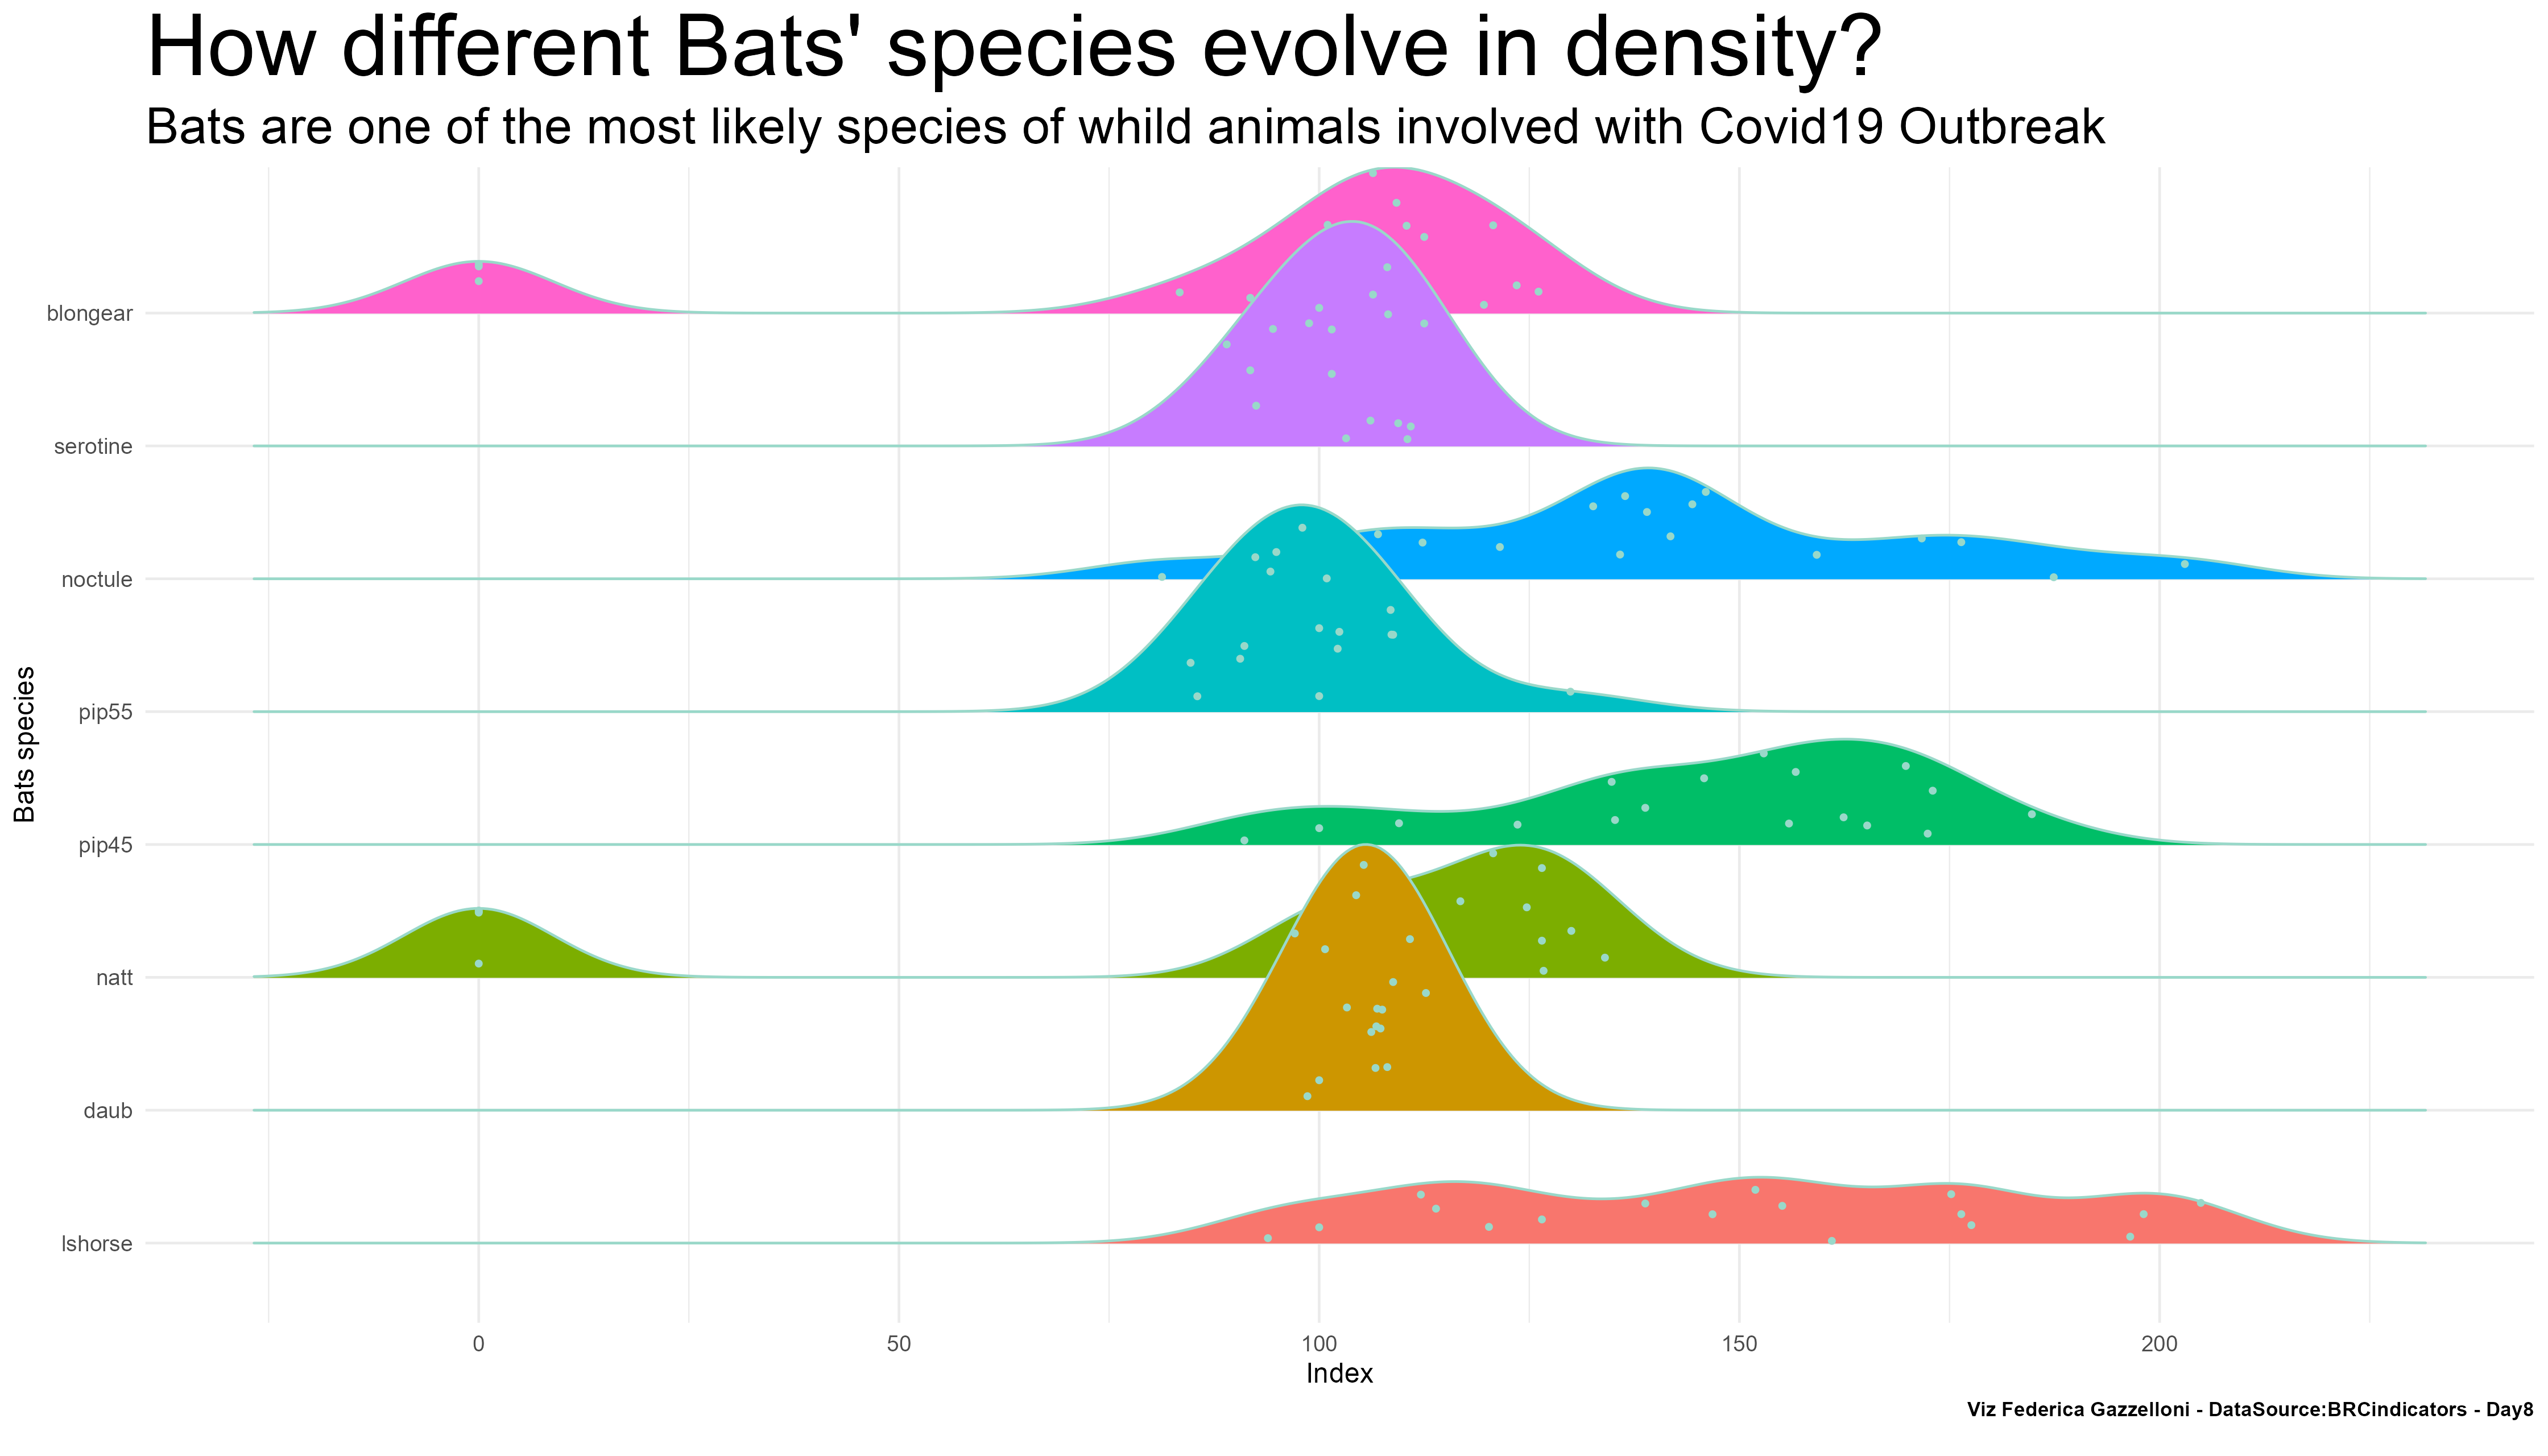
A comparison of bat species density and their potential involvement in the COVID-19 outbreak.
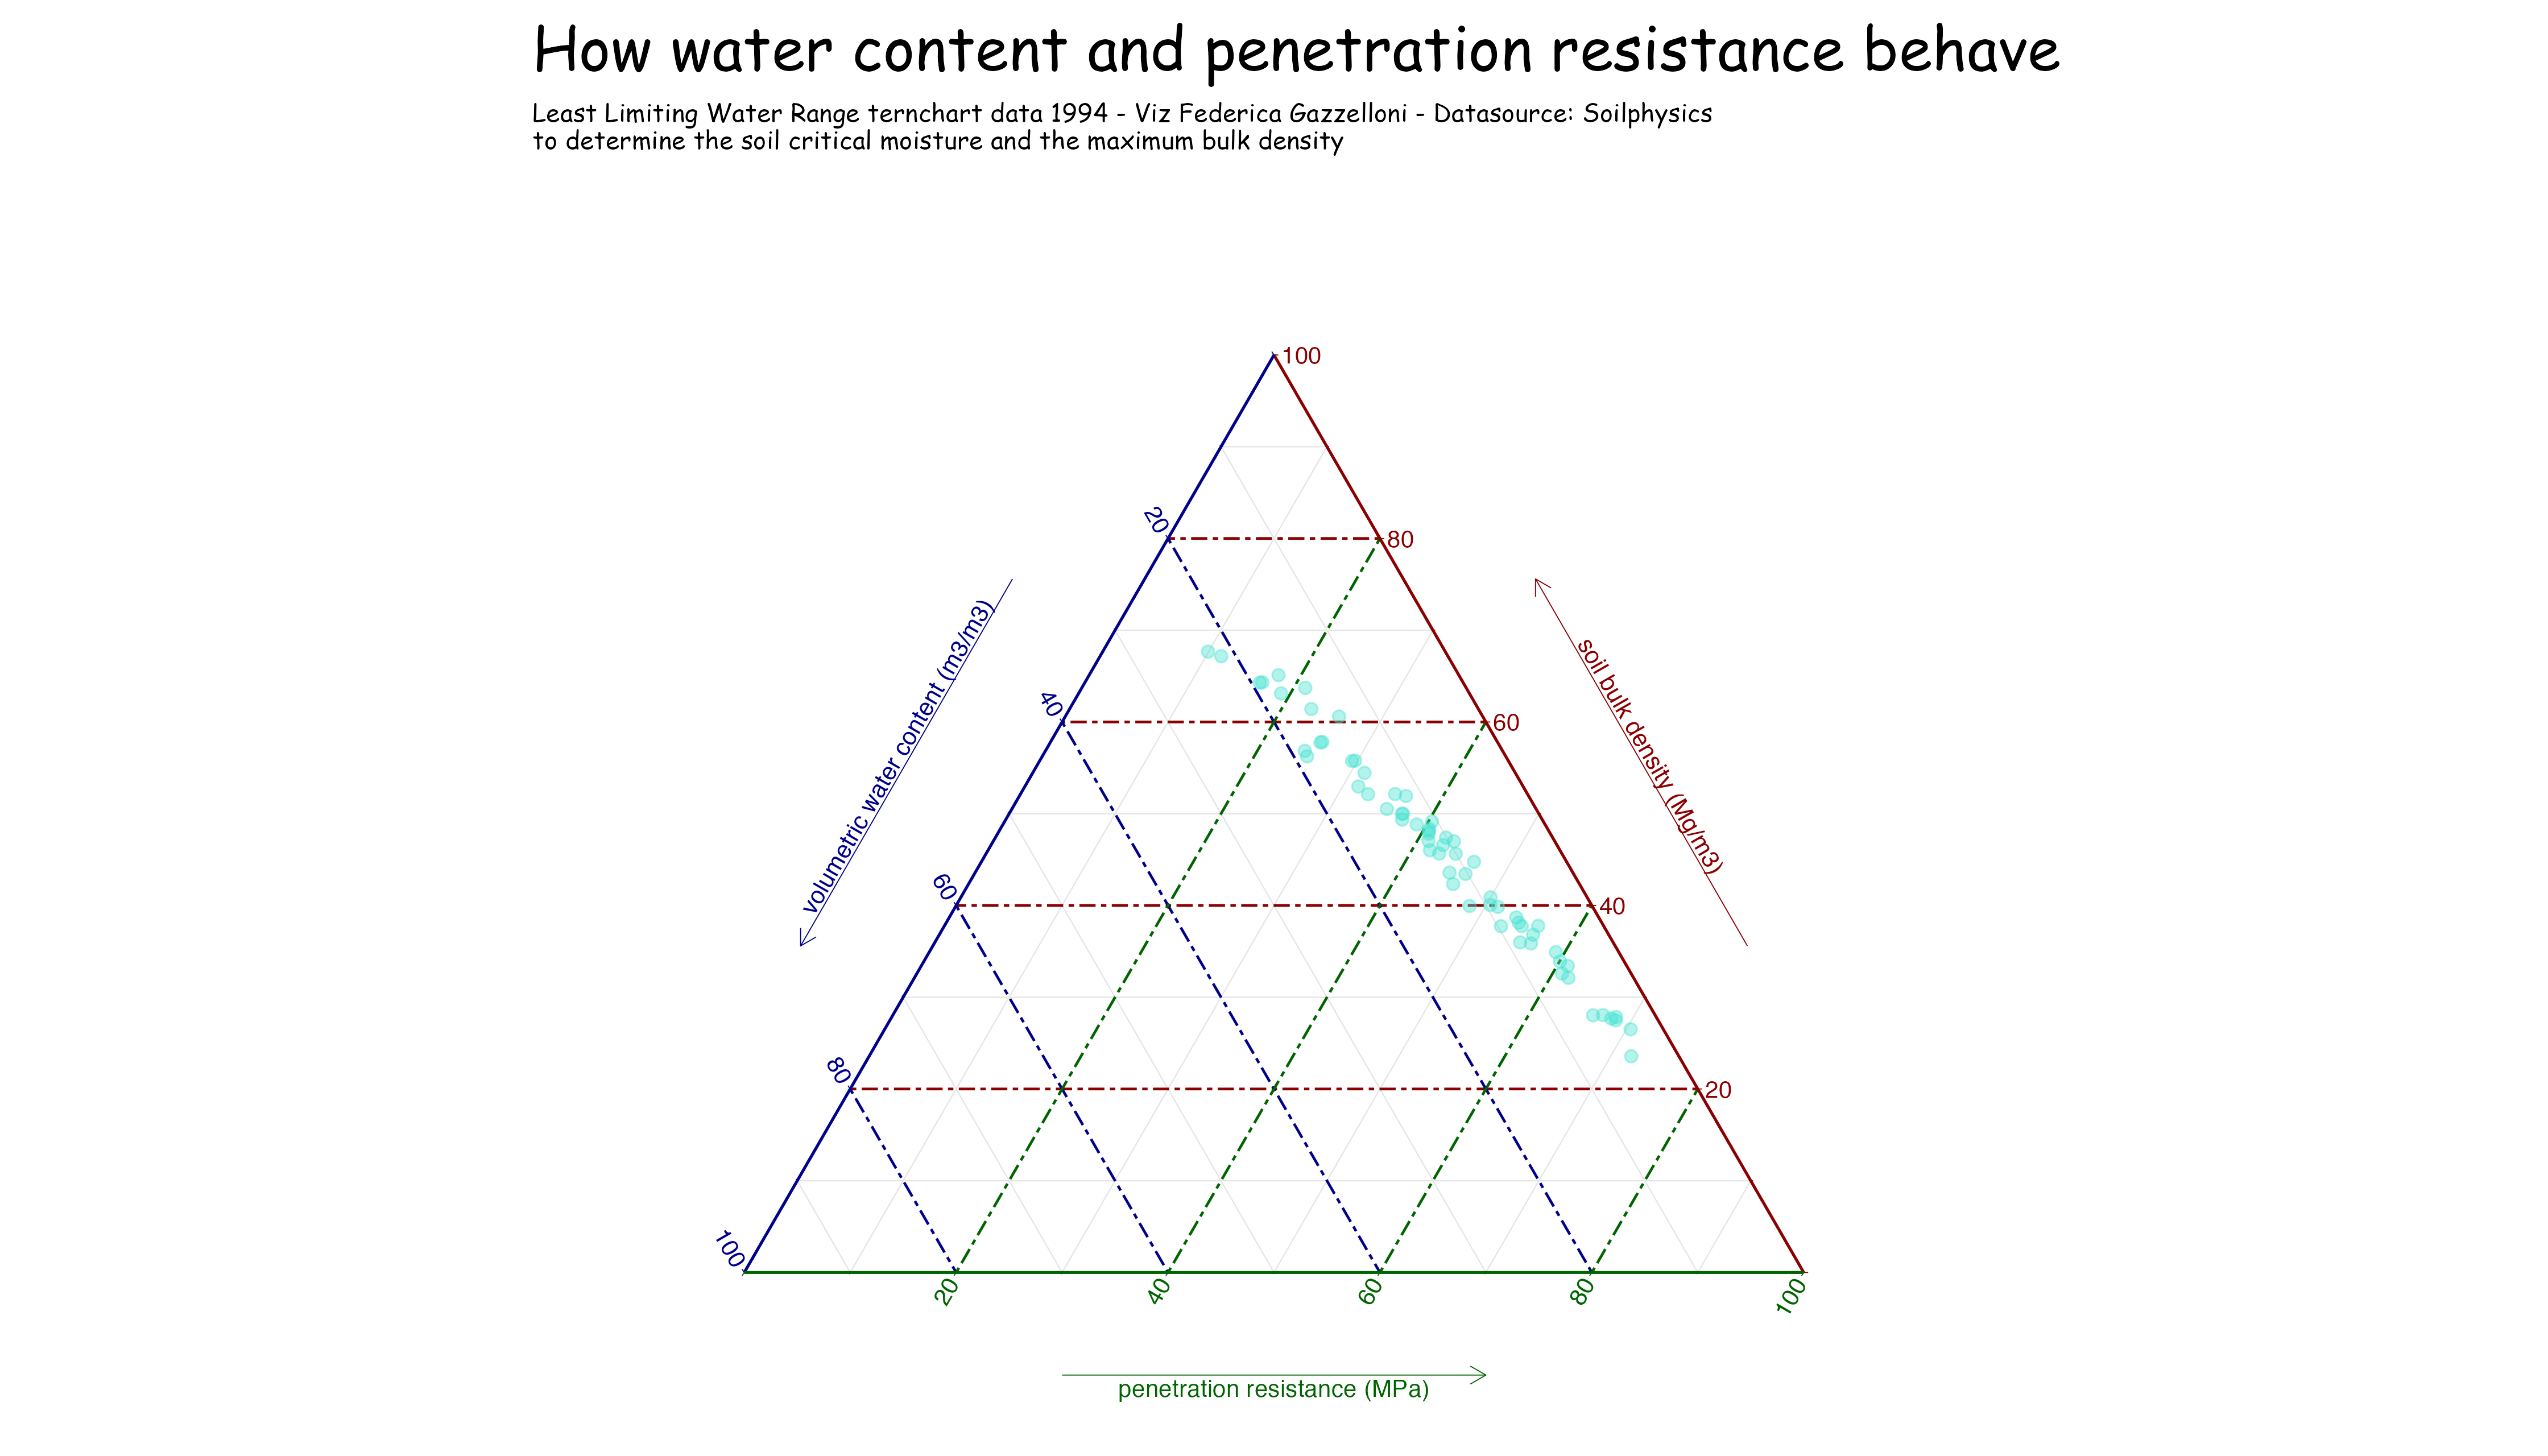
A soil-physics chart relating volumetric water content to penetration resistance and the least limiting water range.
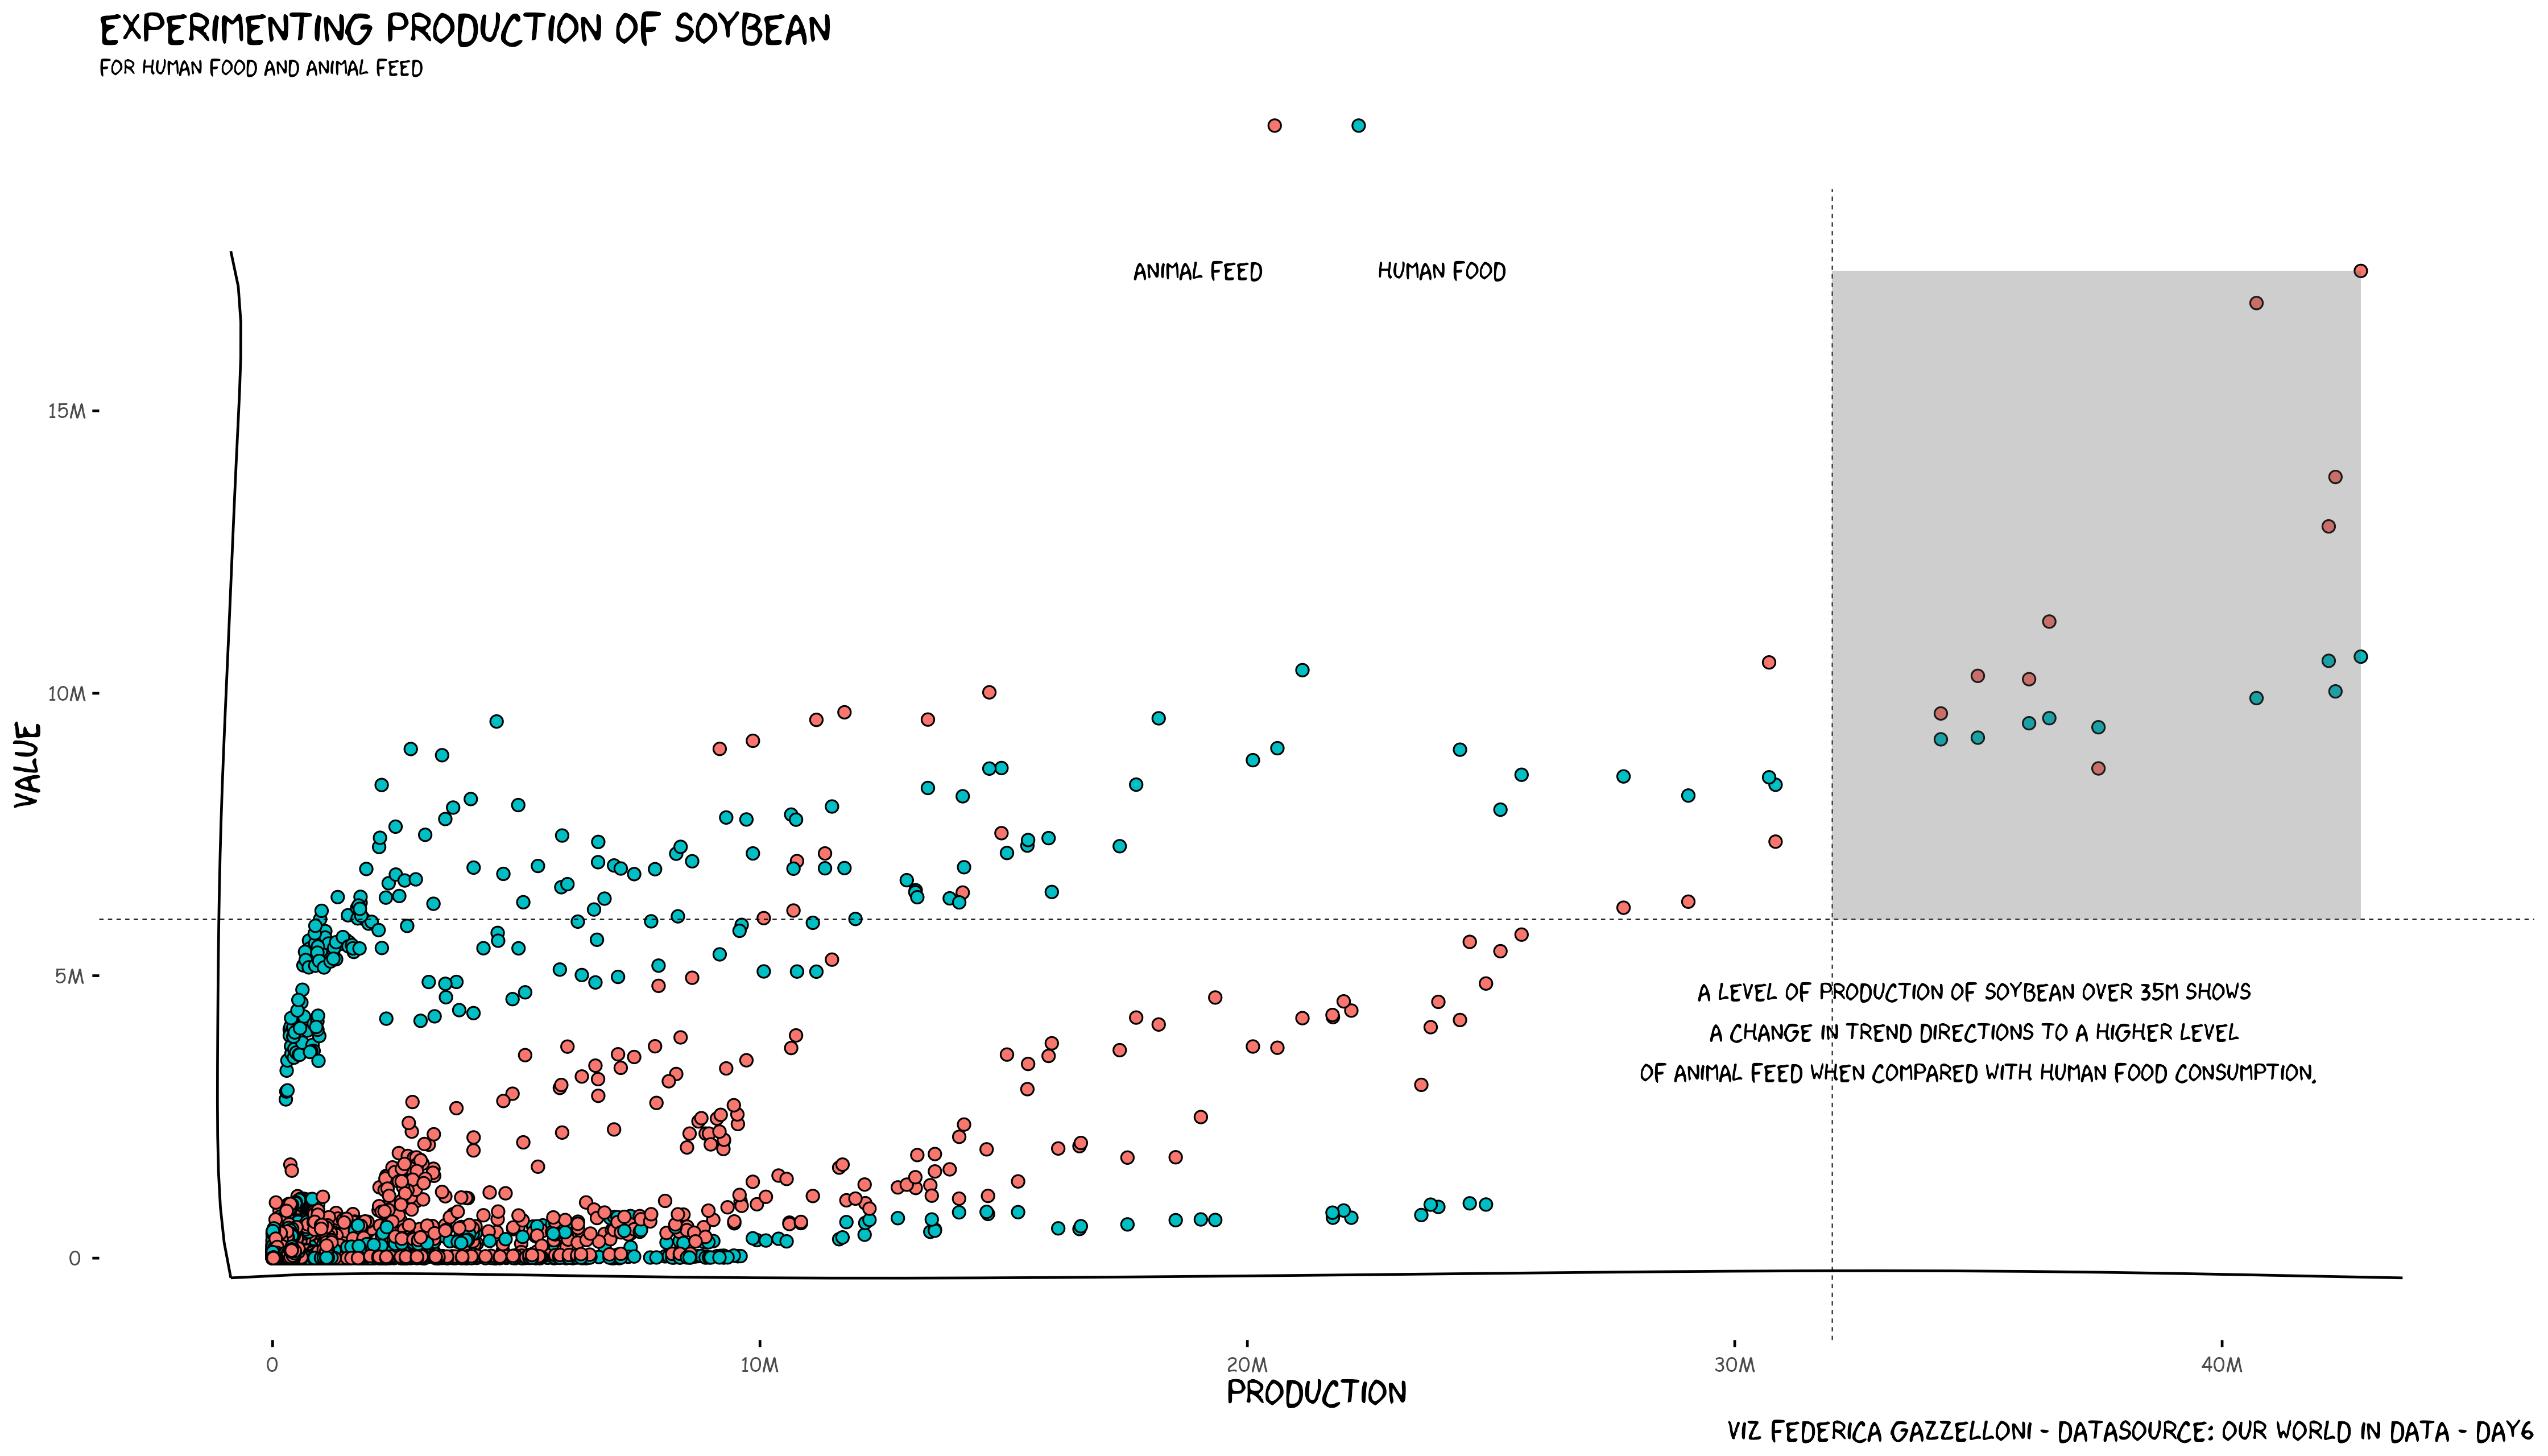
A comparison of soybean production for human food and animal feed using Our World in Data.
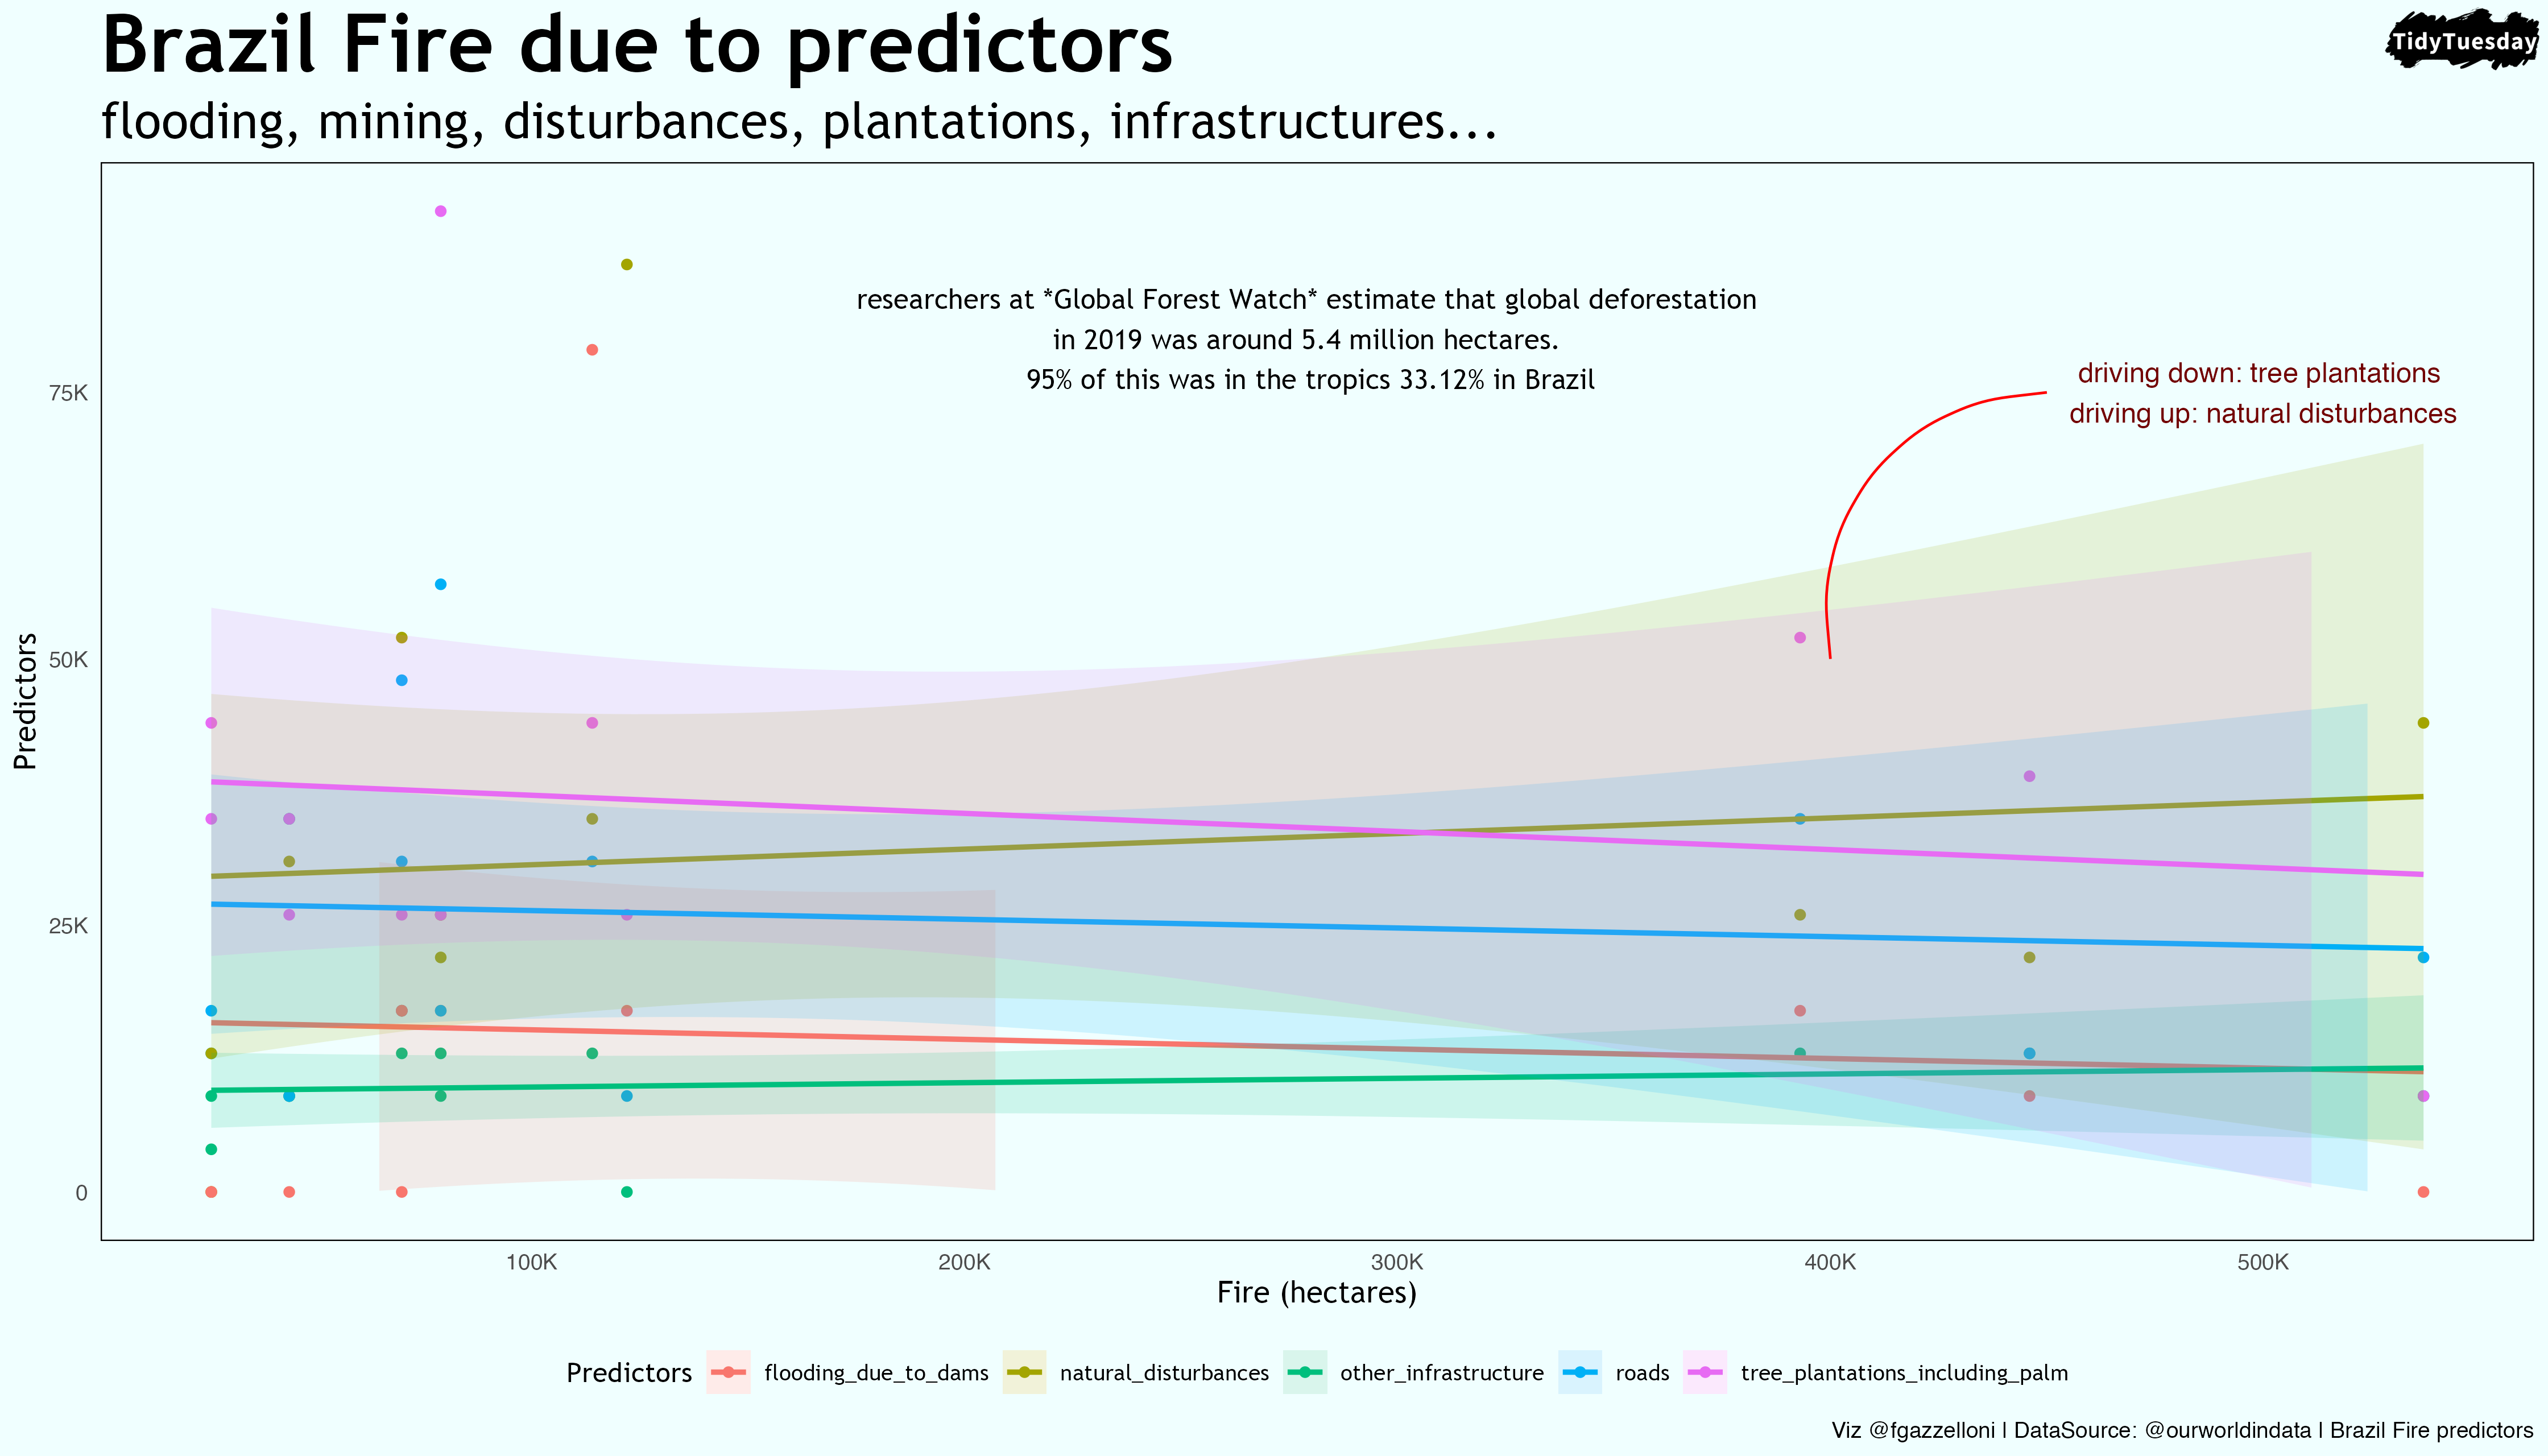
Slope
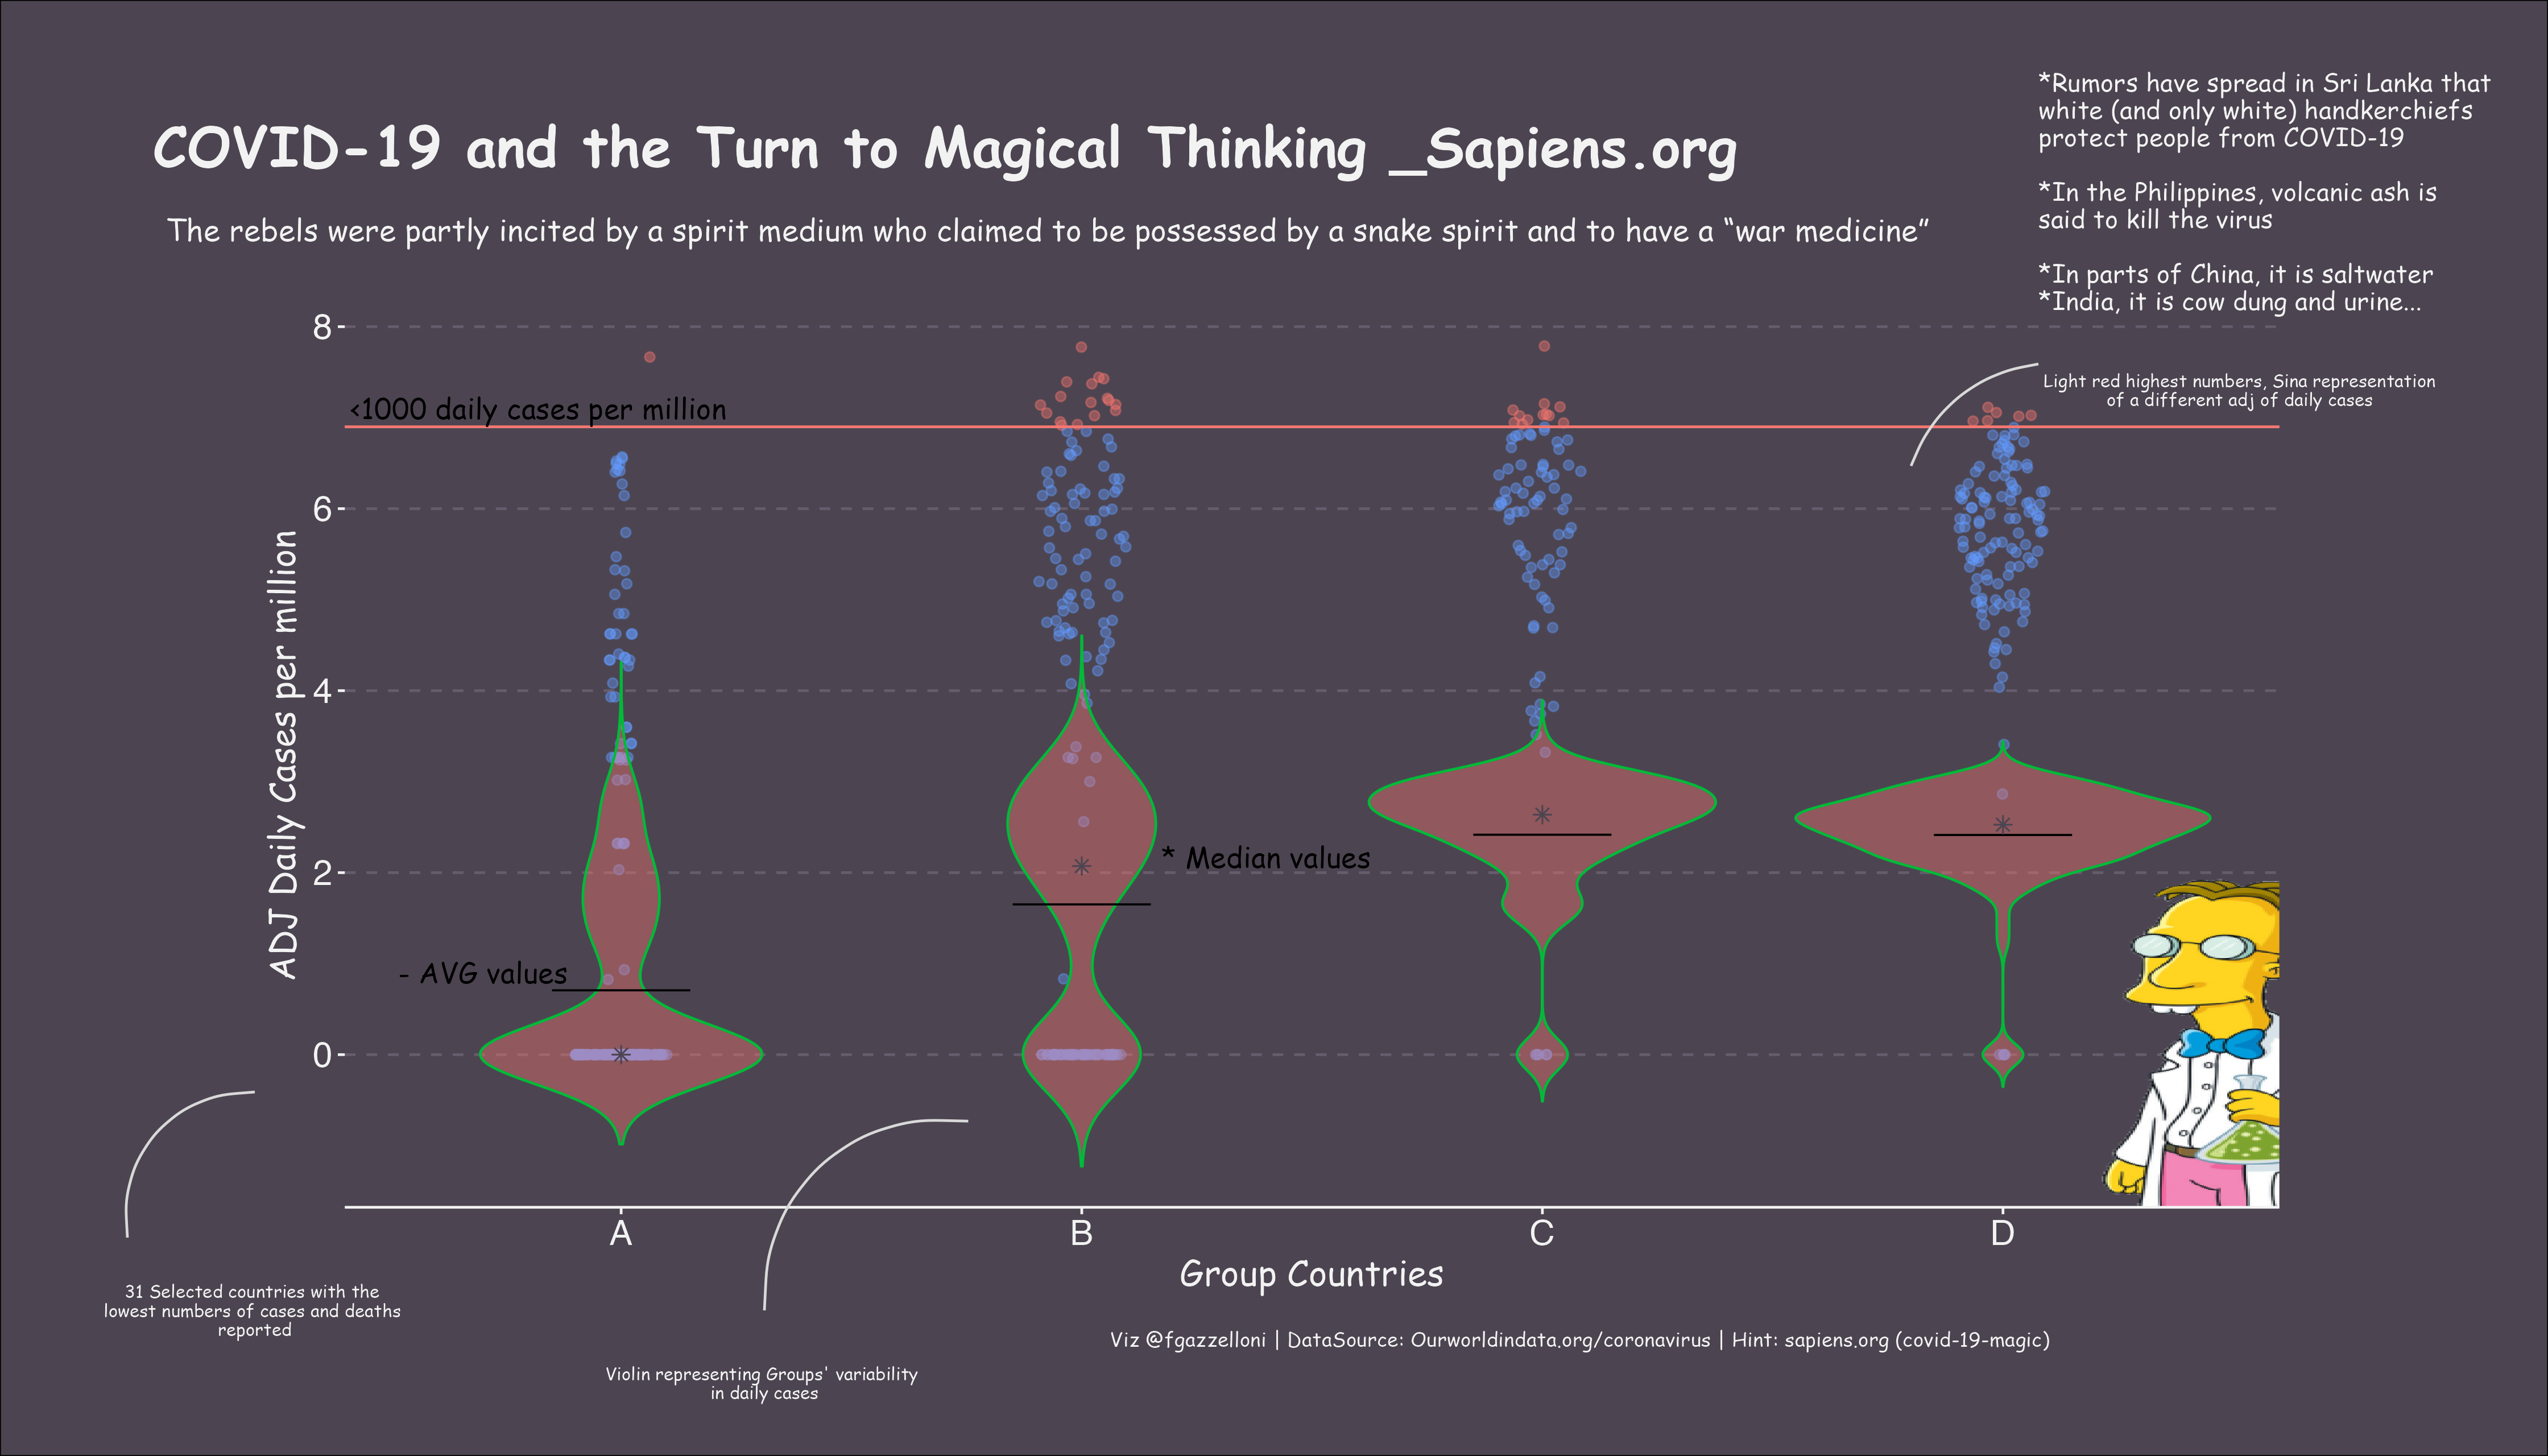
This plot explores the relationship between groups of countries with low covid19 deaths and their reported daily cases, using magical elements to highlight the theme of…
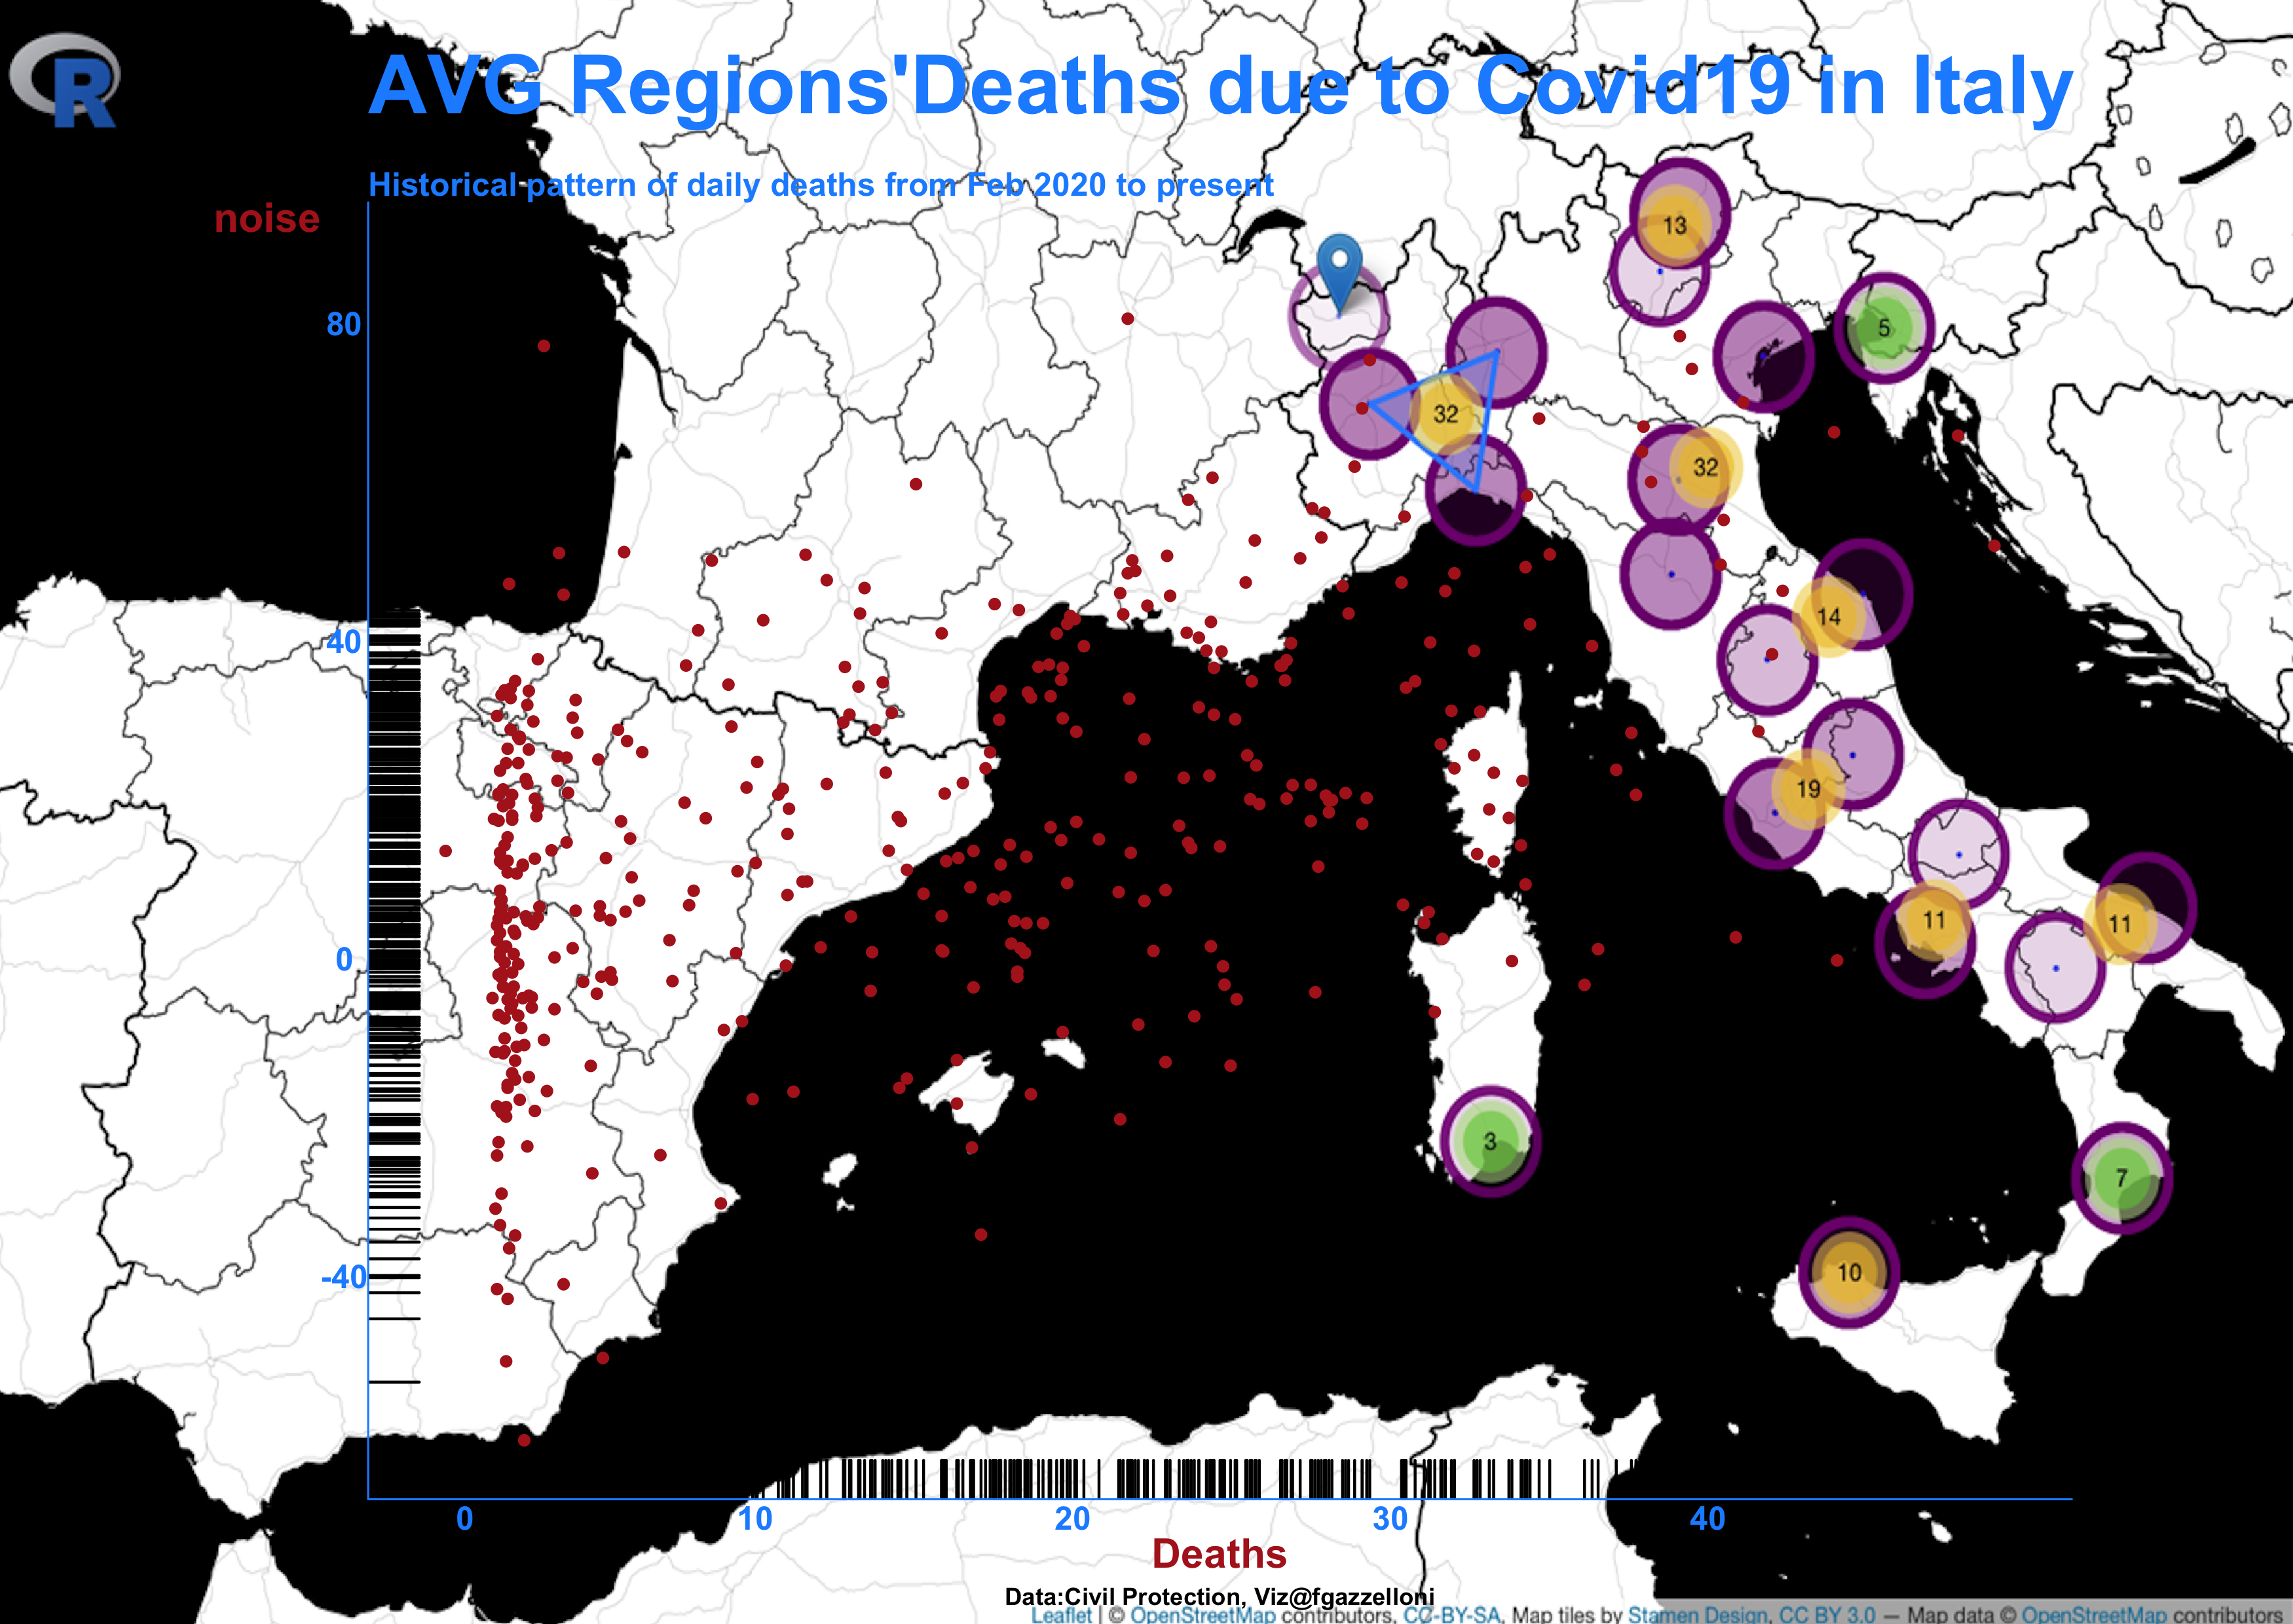
Historical pattern of daily deaths due to Covid19 in Italy from February 2020 to present.
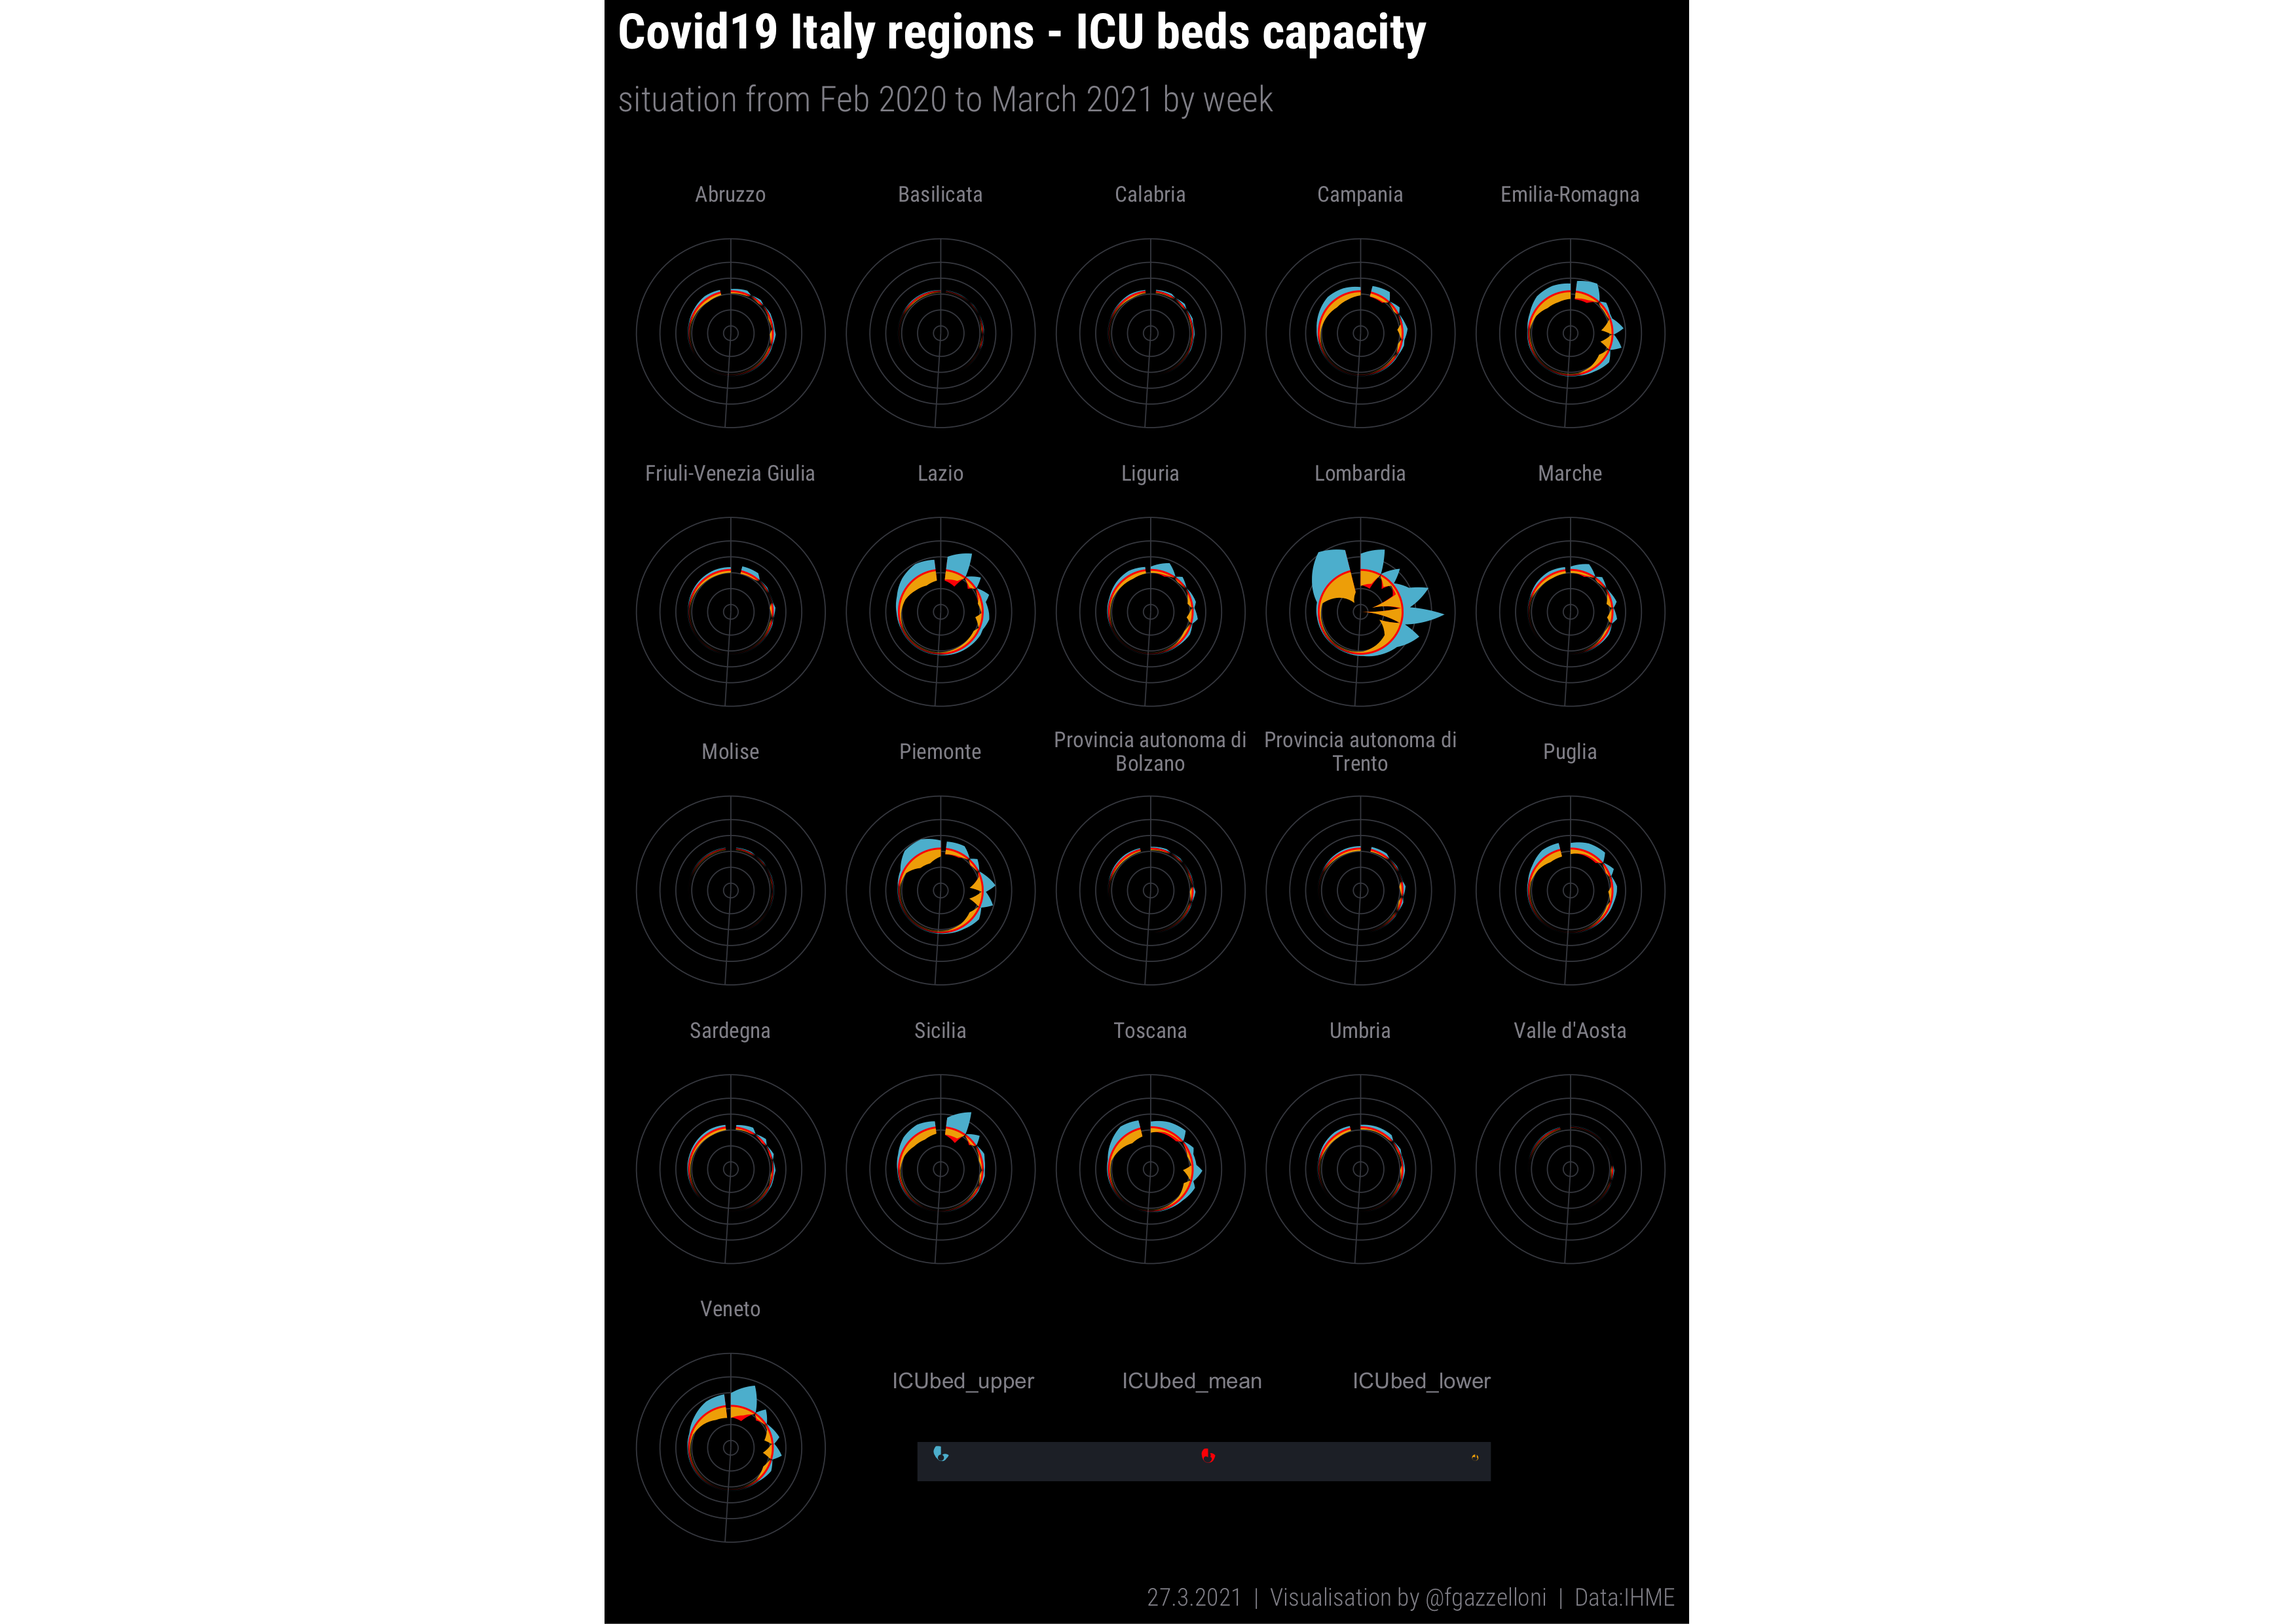
Covid-19 Pictogram: this visualization shows the ICU bed capacity in different Italian regions from February 2020 to March 2021.
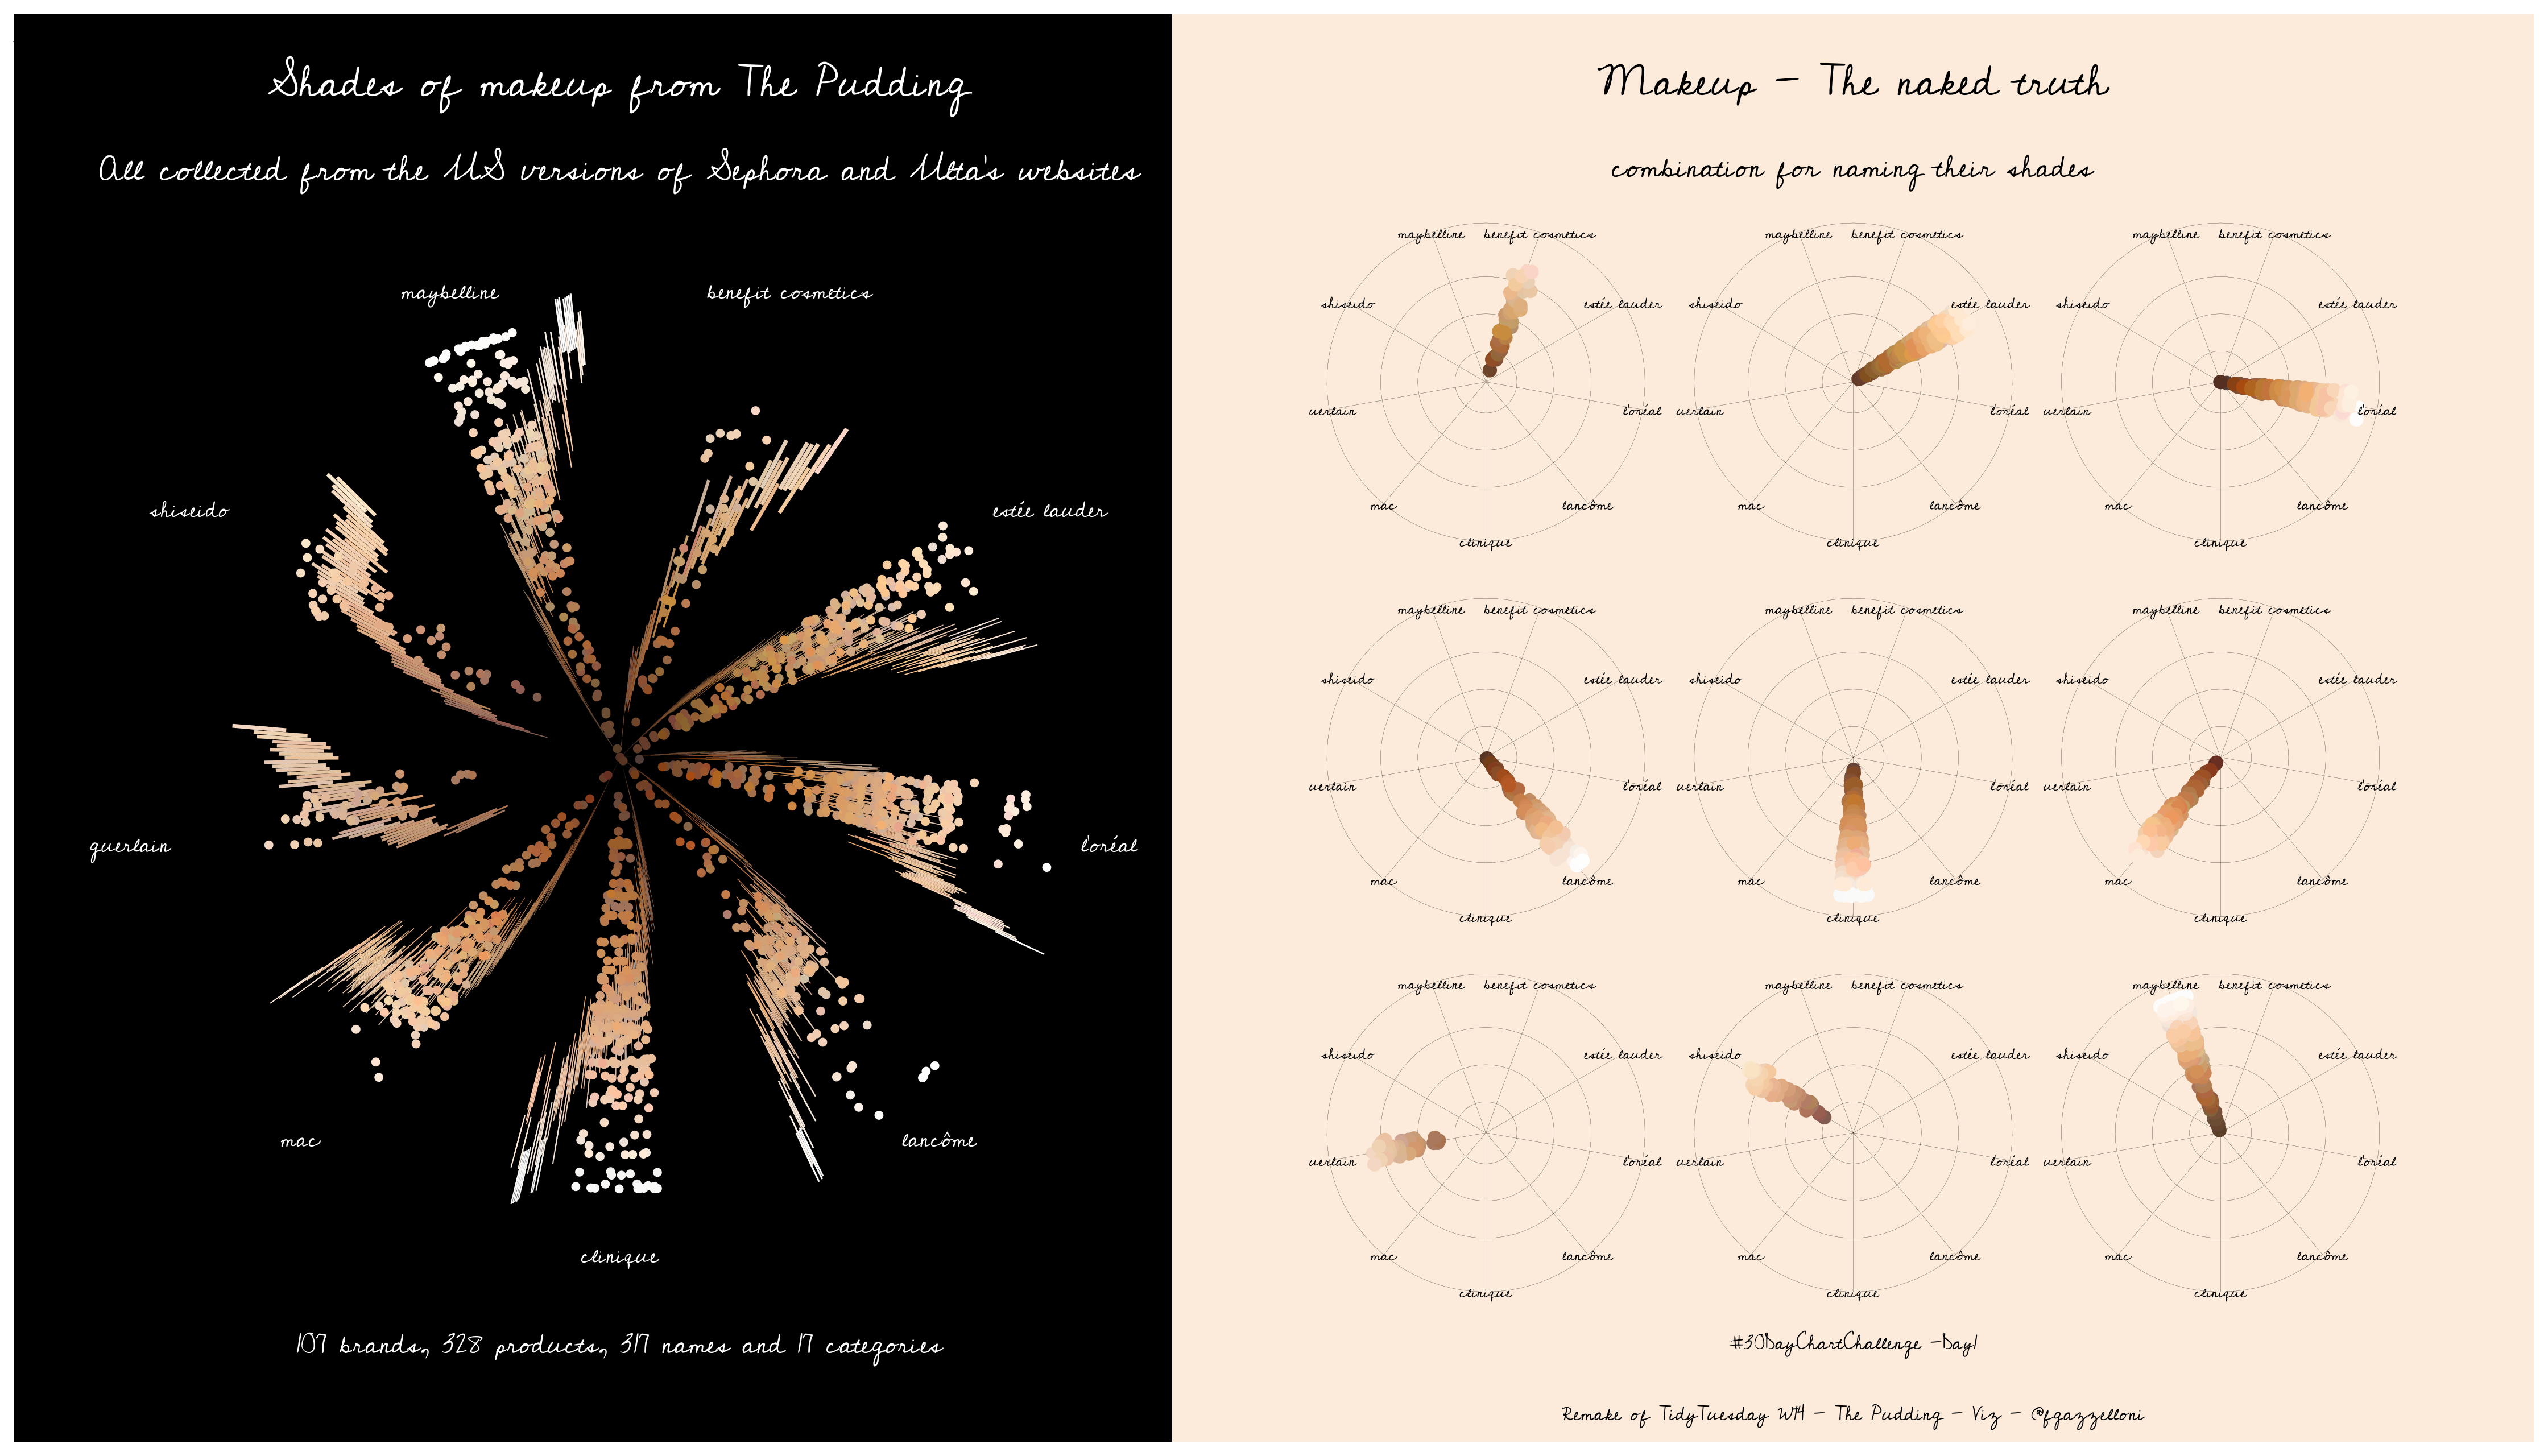
The Pudding Data used for this first visualization.